4638
MIXTURE-DOSMA: A comprehensive and multi-parametric quantitative 3D knee MR exam in 10 minutes1Philips Japan, Tokyo, Japan, 2Department of Radiology, Eastern Chiba Medical Center, Chiba, Japan, 3Philips Healthcare NA, San Francisco, CA, United States, 4Electrical Engineering, Stanford University, Stanford, CA, United States, 5Radiology, Stanford University, Stanford, CA, United States, 6Philips Healthcare, Best, Netherlands
Synopsis
Multi-Interleaved X-prepared TSE with inTUitive RElaxometry (MIXTURE) is a recently developed 3D magnetization-prepared turbo spin-echo sequence. MIXTURE provides 3D high-resolution isotropic knee morphometry and T1ρ relaxometry in a clinically reasonable scan time. In this study, we integrated MIXTURE with the Deep Open-Source Medical Analysis (DOSMA) framework for deep learning-powered musculoskeletal MR image analysis to expand its clinical usage. By exploiting the advantage of both techniques, we show that the combination of MIXTURE and DOSMA enables a comprehensive whole knee MR exam including 3D proton density-weighted isotropic submillimeter imaging, T2- and T1ρ-mapping, and standardized image analysis techniques.
Introduction
In MR examination of the knee, 3D high-resolution imaging is clinically important to depict subtle pathophysiological changes. In addition, quantitative relaxometry values, such as T2 and T1ρ, have attracted much attention because they can potentially be useful for non-invasive early diagnosis of degenerative disease of the knee joint, including osteoarthritis1–4, and for monitoring rehabilitation following acute joint injuries5. However, acquiring high-resolution morphological as well as quantitative images is time-consuming and thus hinders clinical translation.For this reason, a new technique termed MIXTURE (Multi-Interleaved X-prepared TSE with inTUitive RElaxometry) was recently introduced6. MIXTURE is 3D magnetization-prepared turbo spin-echo (TSE) imaging and provides proton density-weighted (PDW) image with 3D isotropic submillimeter resolution in a clinically reasonable scan time7. In addition, multiple TSE shots with arbitrary echo times in MIXTURE can be used to compute 3D T1ρ relaxometry map8.
In order to standardize and simplify image analysis workflow, we utilize the Deep Open-Source Medical Analysis (DOSMA) framework that enables deep learning-powered musculoskeletal MR image analysis9. DOSMA provides a variety of analysis methods such as automatic cartilage segmentation, interscan registration, relaxometry parameter quantification, and visualization. Therefore, the combination of MIXTURE and DOSMA has the potential to provide a comprehensive whole knee MR exam, including T2- and T1ρ-mapping, 3D PDW isotropic submillimeter resolution imaging, and standardized image analysis techniques. The purpose of this study was to integrate MIXTURE into DOSMA and exploit the 3D high-resolution morphological and quantitative information both techniques provide.
Methods
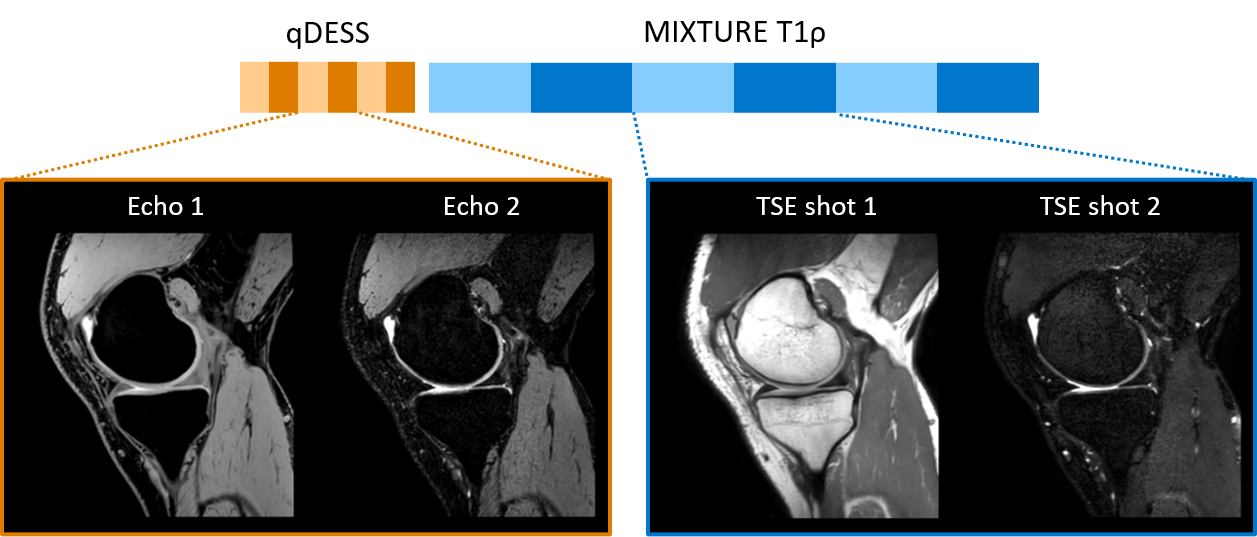
Two volunteers were examined on 3.0T whole-body clinical systems (Ingenia CX, Philips Healthcare, Best, the Netherland) with a 16ch knee coil. The study was approved by the local IRB, and written informed consent was obtained from all subjects.We acquired quantitative Double Echo Steady State (qDESS)10 and MIXTURE to compute T2 and T1ρ relaxometry, respectively. The acquisition scheme of qDESS and MIXTURE is shown in Fig. 1. The qDESS images were acquired with TE = 5.0 and 10.0 ms. MIXTURE has two interleaved TSE shot blocks to acquire two images with different spinlock (SL)-preparation times (SL = 1.0 and 50.0 ms) with amplitude of the SL pulse 500 Hz. The first TSE shot in MIXTURE did not employ spectral-selective IR (SPAIR) pulse and thus provides PDW contrast image, which is commonly used for diagnostic purposes. Both qDESS and MIXTURE were acquired at 0.76 mm3 resolution and reconstructed to 0.38 mm3.
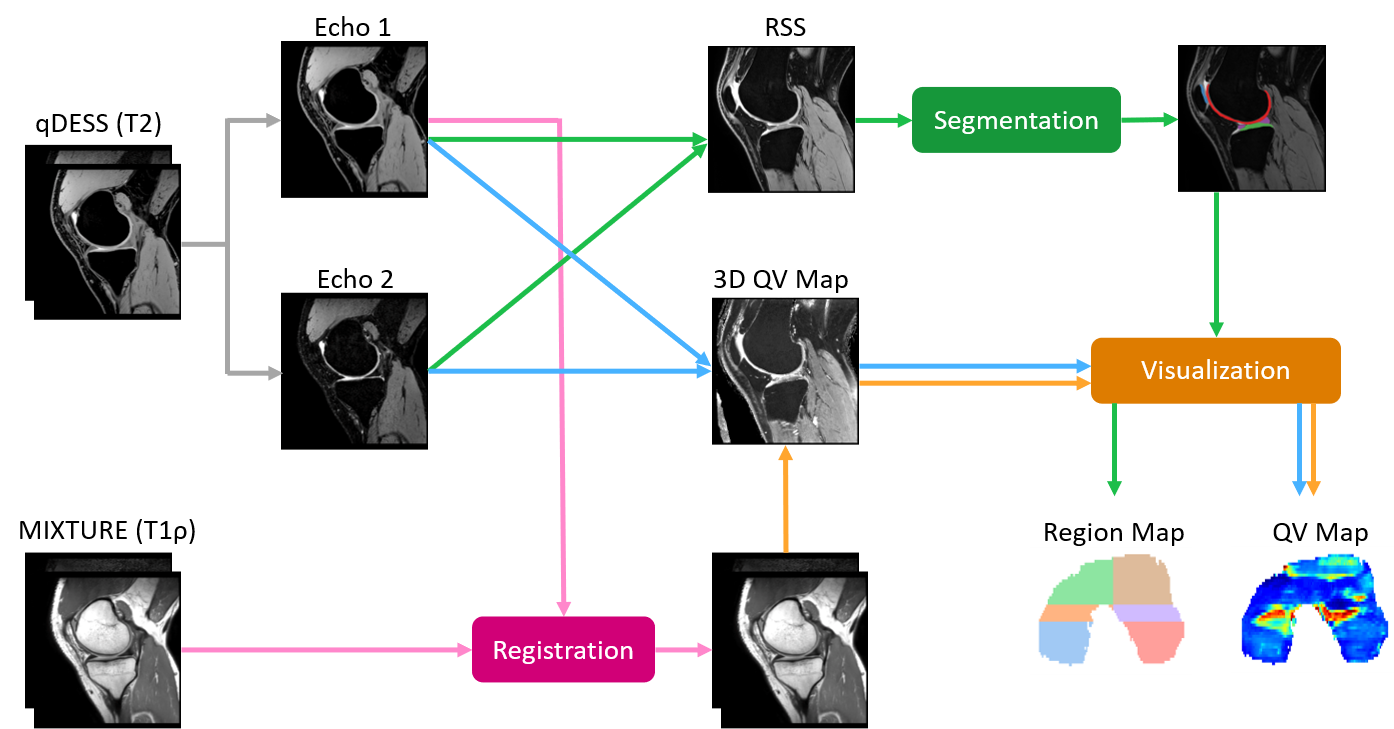
Fig. 2 shows the workflow of DOSMA (v0.1.0) in conjunction with MIXTURE and qDESS. First, the root-sum-of-squares (RSS) of the two echoes in qDESS was computed and then used as an input to a built-in segmentation deep neural network model in DOSMA11,12. Among models available, the model trained on Osteoarthritis Initiative DESS scans11 was selected, and knee tissues including femoral cartilage, patellar cartilage, tibial cartilage, and meniscus were automatically segmented. Next, MIXTURE images were intra-registered and then registered to the first echo of the qDESS image. 3D T2 and T1ρ relaxometry maps were computed from the two echoes of qDESS and two TSE shots of MIXTURE, respectively13. Lastly, the 3D quantitative maps corresponding to the femoral cartilage segmentation mask were unrolled and visualized in 2D projection maps. In the image analysis step using DOSMA, both qDESS and MIXTURE were reconstructed to 0.38x0.38x1.5 mm3 to increase the signal to noise ratio.
The scan parameters were optimized for 3.0T with the main imaging parameters for qDESS: sagittal acquisition, acquisition voxel size=0.76 mm3, reconstruction voxel size=0.38 mm3, FOV=150x150 mm, C-SENSE reduction factor=2.5, TR/TE1/TE2=15.2/5.0/10 ms, and total acquisition time=3:34. For MIXTURE T1ρ: 3D PDW TSE, sagittal acquisition, acquisition voxel size=0.76 mm3, reconstruction voxel size=0.38 mm3, FOV=150x150 mm, C-SENSE reduction factor=4.0, TR/TE=1600/50 ms, TSE factor=70, and total acquisition time=7:52.
Results and Discussions
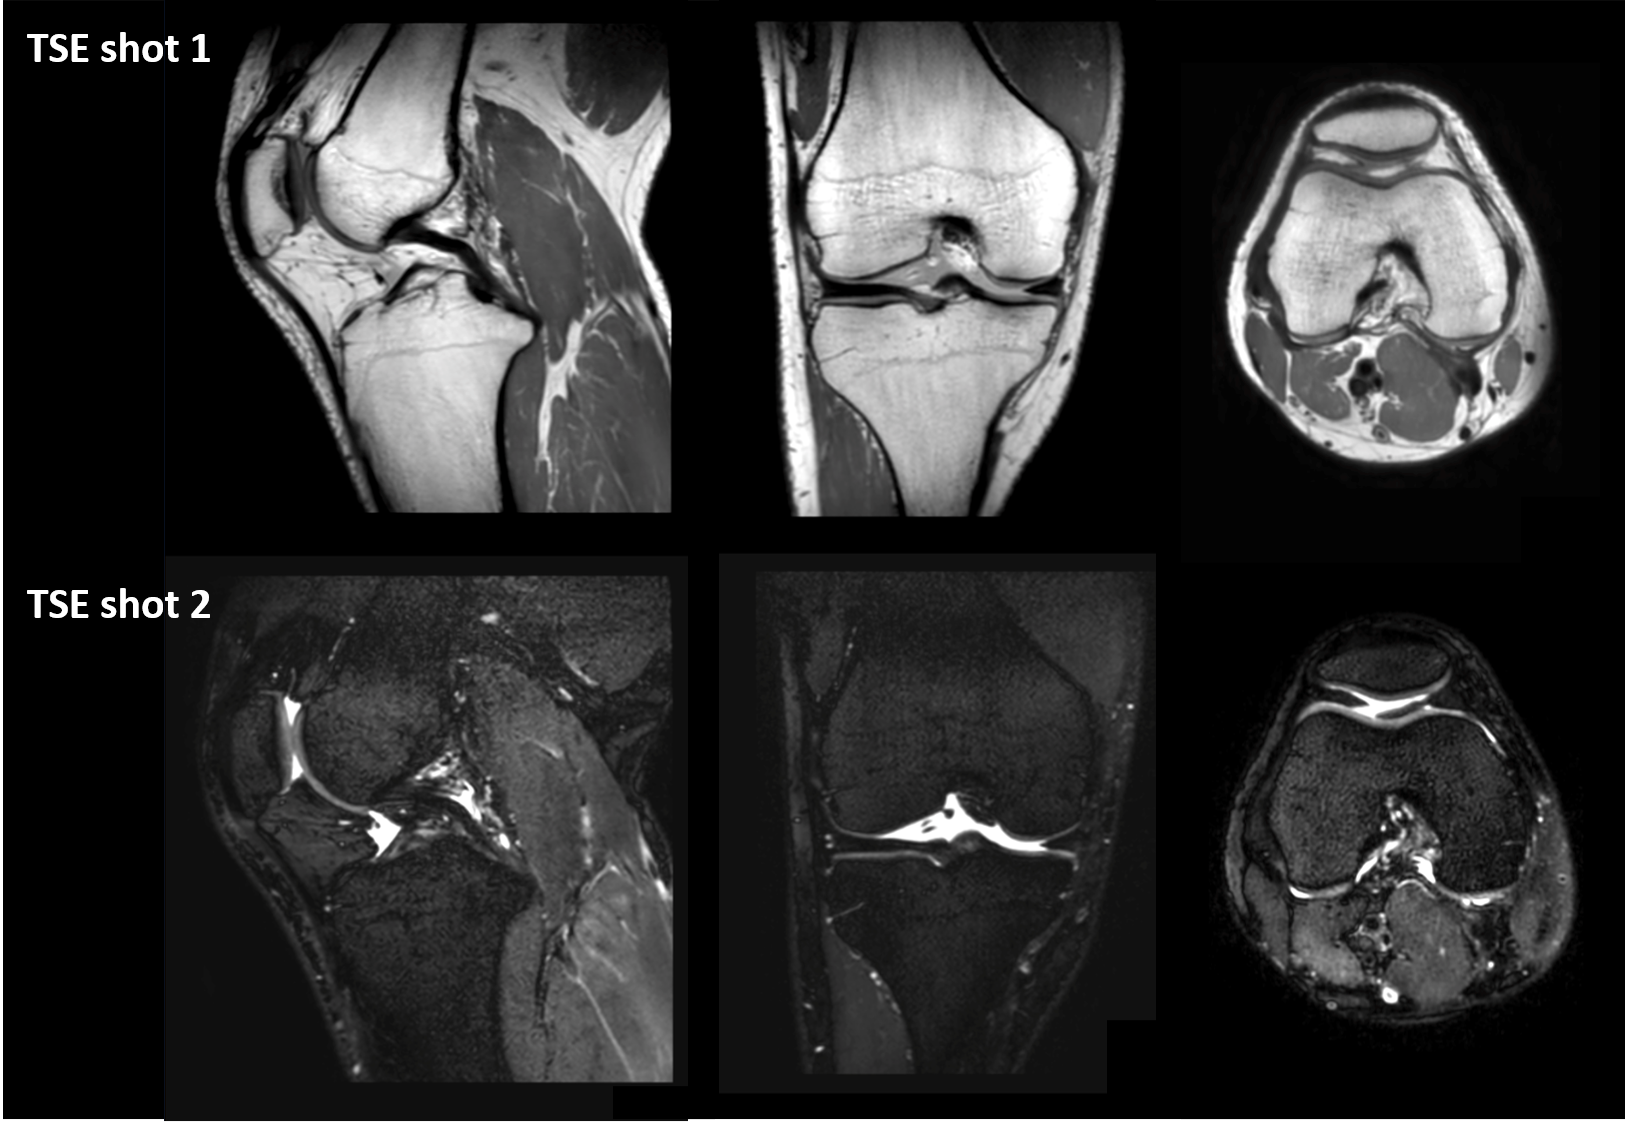
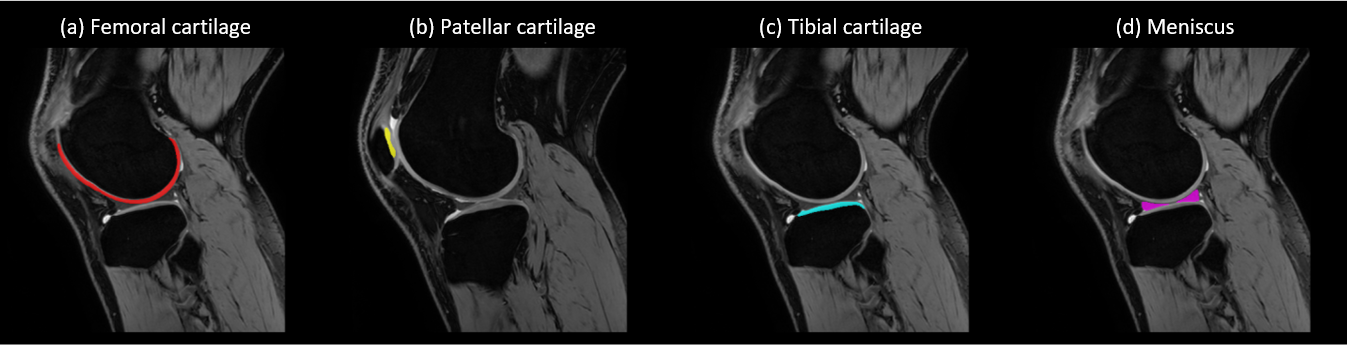
MIXTURE and qDESS can be reformatted in arbitrary slice thicknesses and orientations due to their isotropic resolution. Fig. 3 shows multiplanar reconstruction (MPR) of the first TSE shot image from MIXTURE. The 3D isotropic submillimeter resolution and PDW contrast enabled morphometric measurement.Fig. 4 shows the automatic segmentations of femoral cartilage, patellar cartilage, tibial cartilage, and meniscus. Although the volunteers in this study were different from the cohort from which the deep learning model was trained, visually the structures appeared to be well segmented across multiple slices.
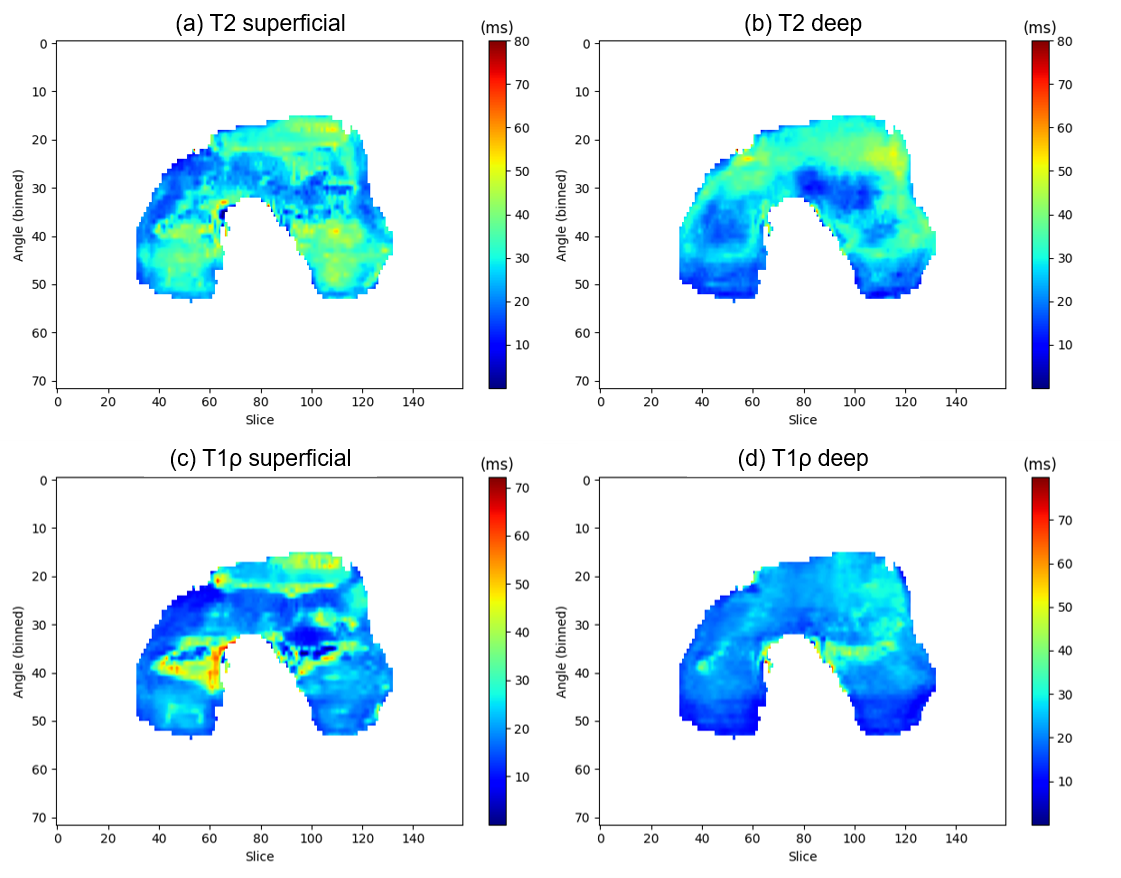
Fig. 5 shows the 2D projection of the T2 and T1ρ maps of the femoral cartilage. The average T2 value of the superficial layer was 30.2 ms, which was higher than the 27.1 ms of the deep layer. This trend is in line with the previous report9. For the T1ρ values, the averages of the superficial and deep layers were 24.1 and 22.5 ms, respectively.
Conclusion
We demonstrated the technical feasibility of integrating MIXTURE into DOSMA. This combination enabled a comprehensive whole knee MR exam including 3D PDW isotropic submillimeter resolution morphometry, 3D T2 and T1ρ relaxometry mapping, and standardized image analysis. Further investigations are warranted to evaluate the clinical usefulness of this technique.Acknowledgements
No acknowledgement found.References
1. Xia Y, Farquhar T, Burton‐Wurster N, Ray E, Jelinski LW. Diffusion and relaxation mapping of cartilage‐bone plugs and excised disks using microscopic magnetic resonance imaging. Magn Reson Med. 1994;31(3):273-282. doi:10.1002/mrm.1910310306
2. Dardzinski J, Slyke A Van, Mosher J, Smith B. Spatial variation of T2 in human articular cartilage. Radiology. 1997;205:546-550.
3. Duvvuri U, Reddy R, Patel SD, Kaufman JH, Kneeland JB, Leigh JS. T1ρ-relaxation in articular cartilage: Effects of enzymatic degradation. Magn Reson Med. 1997;38(6):863-867. doi:10.1002/mrm.1910380602
4. Regatte RR, Akella SVS, Borthakur A, Kneeland JB, Reddy R. In vivo proton MR three-dimensional T1ρ mapping of human articular cartilage: Initial experience. Radiology. 2003;229(1):269-274. doi:10.1148/radiol.2291021041
5. Baum T, Joseph GB, Karampinos DC, Jungmann PM, Link TM, Bauer JS. Cartilage and meniscal T2 relaxation time as non-invasive biomarker for knee osteoarthritis and cartilage repair procedures. Osteoarthr Cartil. 2013;21(10):1474-1484. doi:10.1016/j.joca.2013.07.012
6. Yoneyama M, Sakai T, Zhang S, et al. MIXTURE : A novel sequence for simultaneous morphological and quantitative imaging based on multi-interleaved 3D turbo-spin echo MRI. Proc Intl Soc Mag Res Med. 2021;29:4203.
7. Sakai T, Yoneyama M, Watanabe A, et al. Simultaneous anatomical , pathological and T2 quantitative knee imaging with 3D submillimeter isotropic resolution using MIXTURE. In: Proc Intl Soc Mag Reson Med. Vol 29. ; 2021:0845.
8. Saruya S, Suzuki M, Yoneyama M, Inoue K, Kozawa E, Niitsu M. 3D sub-millimeter isotropic knee cartilage T1ρ mapping using multi-interleaved fluid- attenuated TSE acquisition (MIXTURE). In: Vol 29. ; 2021:2977.
9. Desai AD, Barbieri M, Mazzoli V, et al. DOSMA: A deep-learning, open-source framework for musculoskeletal MRI analysis. Proc Int Soc Magn Reson Med. 2019;27:1106.
10. Lu Q, Hargreaves BA, Chaudhari AS. Application of Compressed Sensing to Quantitative Double Echo steady state (qDESS) for Rapid T2 Relaxometry in Knees. Proc Intl Soc Mag Reson Med. 2020;28:2733.
11. Desai AD, Caliva F, Iriondo C, et al. The International Workshop on Osteoarthritis Imaging Knee MRI Segmentation Challenge: A Multi-Institute Evaluation and Analysis Framework on a Standardized Dataset. Radiol Artif Intell. 2021;3(3):e200078. doi:10.1148/ryai.2021200078
12. DOSMA: Deep Open-Source Medical Image Analysis. https://dosma.readthedocs.io/en/latest/index.html
13. Sveinsson B, Chaudhari AS, Gold GE, Hargreaves BA. A simple analytic method for estimating T2 in the knee from DESS. Magn Reson Imaging. 2017;38:63-70. doi:10.1016/j.mri.2016.12.018
Figures