4630
Associations and mediation effects analysis of cortical porosity index, CKD stages, and bone metabolism markers1Radiology, Tongji Hospital, Tongji Medical College, Huazhong University of Science and Technology, Wuhan, China, 2GE Healthcare, Beijing, China
Synopsis
Chronic kidney disease (CKD) has a significant negative impact on bone health. However, the mechanisms of cortical bone deterioration and cortical porosity enlargement caused by CKD have not been fully described. Double-echo ultrashort echo-time magnetic resonance imaging (UTE MRI) provides the possibility of quantifying cortical porosity in vivo. The increasing CKD stages were associated with a higher PI value (Ptrend < 0.001). The association of CKD stages and PI mediated 34.4% and 30.8% of the total effect by increased PTH and β-CTX, respectively. Our study revealed the internal mechanism of bone deterioration caused by CKD to some extent.
Introduction
CKD has a significant negative impact on bone health[1, 2], which results in a two-fourfold higher risk of fracture in CKD patients compared with general population, and the occurrence of fractures is associated with increased mortality[3, 4]. Cortical porosity is the main factor that determines the strength of cortical bone, and the development of cortical pores leads to an increase in bone fragility, which increases the fracture[5]. A study by Nickolas et al.[6] found that hemodialysis has an independent effect on the increase in cortical porosity, which suggests that cortical porosity may increase as CKD progresses. Ultrashort echo time (UTE) in vivo has proven to be feasible for quantitative assessment of cortical pore information[7]. The researchers found that the PI measured by this method exhibits highly positive correlation with cortical porosity measured by micro-CT (R2 = 0.79). There are almost no relevant studies on applying this method to various metabolic bone diseases, including CKD-MBD. Therefore, the aim of this research is to (1) explore the association between the increasing stages of CKD and the development of cortical PI; (2) judge the mediation effect of several bone metabolism markers (i.e., PTH, b-CTX, T-P1NP, OC, and 25OHD) and dual-energy X-ray absorptiometry (DXA) lumbar spine bone mineral density (BMD) on this association.Materials and methods
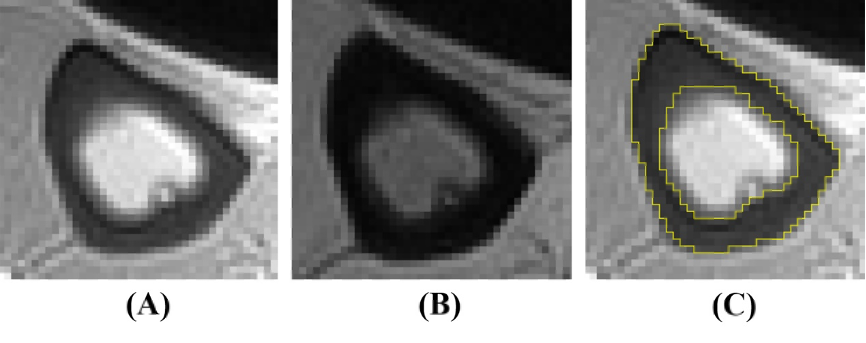
This prospective cross-sectional cohort study was approved by Medical Ethics Committee of our Hospital. Totally 95 patients were included in our study. All participants were over 18 years old and ambulatory. The inclusion criteria were hospitalized patients diagnosed with CKD stage 2-5. Studies were conducted a 3D double-echo UTE-Cones sequence on a 3 Tesla clinical scanner (Signa Pioneer, GE Healthcare, USA) using a medium soft coil, and the dominant leg was scanned. All images were processed with ImageJ (National Institutes of Health). Two experienced musculoskeletal radiologists (one had three years of experience and one had five years of experience), who were blinded to the subjects’ clinical data, independently drew the ROI. The ROI was drawn on tibia images with first and second echo times. PI = TE4.4intensity/TE0.032intensity. Figure 1 shows examples of the ROI. All subjects completed the kidney function examination within one week of the MRI examination. We used serum creatinine level to obtain the estimated glomerular filtration rate (eGFR) through the CKD-EPI formula (28). The stages of CKD were based on the eGFR. Bone metabolism markers, namely, PTH, b-CTX, T-P1NP, OC, and 25OHD, were assessed within one week of the MRI examination. A Prodigy Lunar scanner (GE Healthcare, Waukesha, WI, USA) was used to evaluate the areal BMD and T-score of the lumbar spine (from L1 to L4). The baseline characteristics between the four stages were compared for linear trends using one-way analysis of variance (ANOVA) for continuous variables and Chi-squared statistics for categorical variables. Partial correlation analysis was performed to address associations between PI, eGFR and potential mediators, controlling for age and BMI. Multiple linear regression models were used to assess the association between CKD stages and PI value.Results
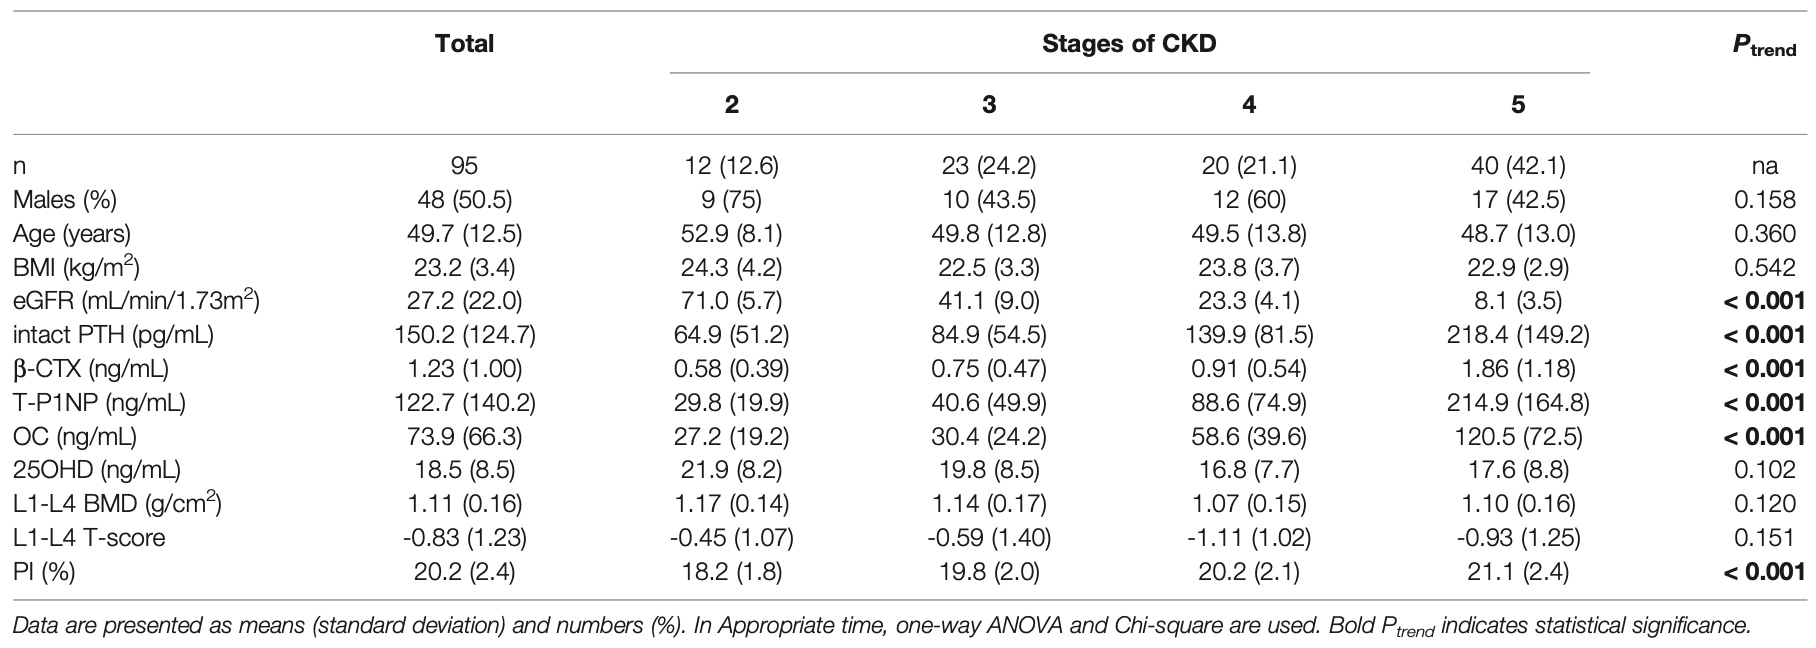
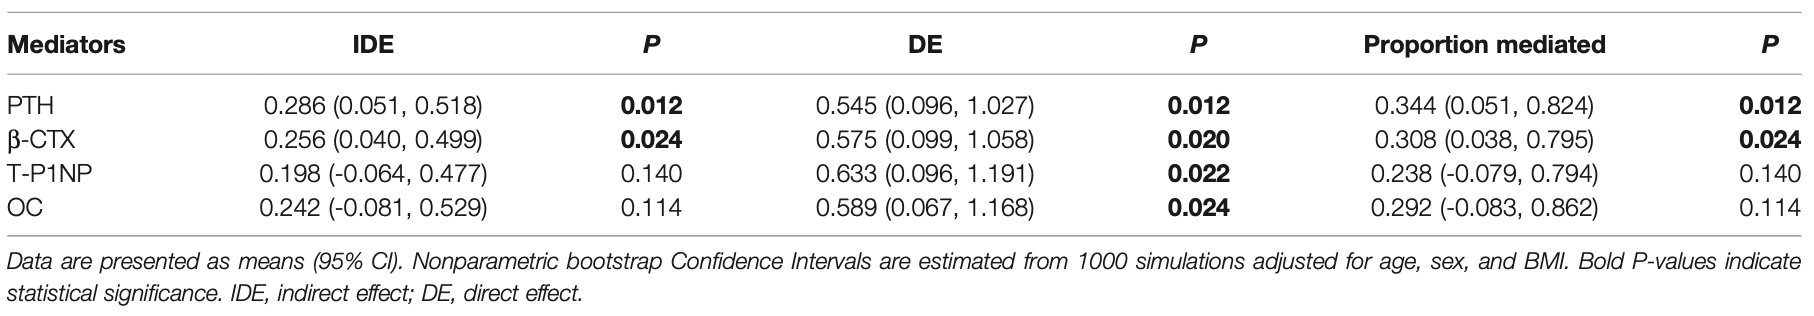
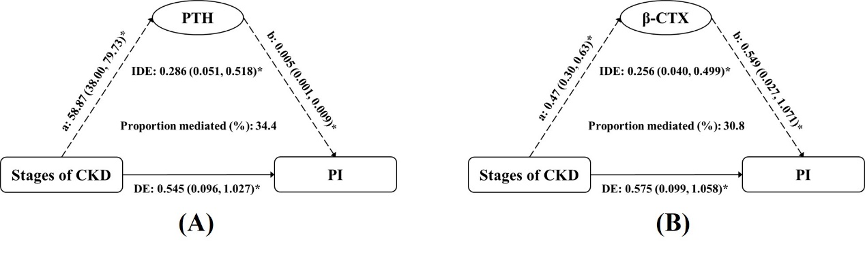
Table 1 reports the baseline characteristics for the four CKD stages (12 people in stage 2, 23 people in stage 3, 20 people in stage 4, and 40 people in stage 5). The mean age, sex and BMI distributions were comparable across all four groups. Patients with more severe CKD had significantly higher intact PTH, b- CTX, T-P1NP, OC and PI values. No difference could be observed in 25OHD or BMD. We tested interactions of the stages of CKD with each potential mediator respectively (adjusted for age, sex and BMI); none of them was significant (P > 0.05). The association of CKD stages and PI mediated 34.4% (P = 0.012) and 30.8% (P = 0.024) of the total effect by increased PTH and b-CTX, respectively. No significant mediation was observed by T-P1NP and OC, 25(OH) vitamin D or BMD (Table 2). The results of mediation analysis of PTH and b-CTX were shown in Figure 2.Discussion
We examined the associations of CKD stages with the PI of the tibial cortex. More severe CKD is associated with higher PI values, independent of age, sex and BMI, while dependent of potential mediators. It was suggested that the association between CKD stages and tibial PI was partly due to PTH and b-CTX through exploratory mediation analysis. Among the indicators included in this study, high PTH was the strongest mediator. PTH can directly stimulate osteocytes to release receptor activator of nuclear factor kB ligand (RANKL), which results in increased osteoclast generation [8]. Our research also found that b-CTX was also a mediator. b-CTX is a marker of bone resorption, which can reflect osteocyte activity [9]. Interestingly, we did not observe a mediation effect of lumbar BMD measured by DXA, and we found that as CKD progressed, BMD did not continue to decrease. It might be that the BMD measured by DXA was a real BMD, which is not distinguishable between trabecular and cortical bone [10, 11], or that BMD itself has a small contribution to porosity.Conclusion
Our study provided a new idea to monitor bone health in patients with CKD, and revealed the internal mechanism of bone deterioration caused by CKD to some extent.Acknowledgements
This study was supported by the National Natural Science Foundation of China (NSFC) (No. 31630025 and 81930045).References
1. Kidney Disease: Improving Global Outcomes (KDIGO) CKD-MBD Update Work Group. KDIGO 2017 Clinical Practice Guideline Update for the Diagnosis, Evaluation, Prevention, and Treatment of Chronic Kidney Disease-Mineral and Bone Disorder (CKD-MBD). Kidney Int Suppl (2011) (2017) 7(1):1–59. doi: 10.1016/j.kisu.2017.04.001
2. Sharma AK, Toussaint ND, Masterson R, Holt SG, Rajapakse CS, Ebeling PR, et al. Deterioration of Cortical Bone Microarchitecture: Critical Component of Renal Osteodystrophy Evaluation. Am J Nephrol (2018) 47(6):376–84. doi: 10.1159/000489671
3. Pimentel A, Ureña-Torres P, Zillikens MC, Bover J, Cohen-Solal M. Fractures in Patients With CKD-Diagnosis, Treatment, and Prevention: A Review by Members of the European Calcified Tissue Society and the European Renal Association of Nephrology Dialysis and Transplantation. Kidney Int (2017) 92(6):1343–55. doi: 10.1016/j.kint.2017.07.021
4. Moorthi RN, Fadel W, Eckert GJ, Ponsler-Sipes K, Moe SM, Lin C, et al. Bone Marrow Fat Is Increased in Chronic Kidney Disease by Magnetic Resonance Spectroscopy. Osteoporos Int (2015) 26(6):1801–7. doi: 10.1007/s00198-015-3064-7
5. Morgan EF, Unnikrisnan GU, Hussein AI. Bone Mechanical Properties in Healthy and Diseased States. Annu Rev BioMed Eng (2018) 20:119–43. doi: 10.1146/annurev-bioeng-062117-121139
6. Nickolas TL, Stein EM, Dworakowski E, Nishiyama KK, Komandah-Kosseh M, Zhang CA, et al. Rapid Cortical Bone Loss in Patients With Chronic Kidney Disease. J Bone Miner Res (2013) 28(8):1811–20. doi: 10.1002/jbmr.1916
7. Manhard MK, Nyman JS, Does MD. Advances in Imaging Approaches to Fracture Risk Evaluation. Transl Res (2017) 181:1–14. doi: 10.1016/ j.trsl.2016.09.006
8. Araujo MJ, Karohl C, Elias RM, Barreto FC, Barreto DV, Canziani ME, et al. The Pitfall of Treating Low Bone Turnover: Effects on Cortical Porosity. Bone (2016) 91:75–80. doi: 10.1016/j.bone.2016.07.009
9. Wheater G, Elshahaly M, Tuck SP, Datta HK, van Laar JM. The Clinical Utility of Bone Marker Measurements in Osteoporosis. J Transl Med (2013) 11:201. doi: 10.1186/1479-5876-11-201
10. Silva BC, Costa AG, Cusano NE, Kousteni S, Bilezikian JP. Catabolic and Anabolic Actions of Parathyroid Hormone on the Skeleton. J Endocrinol Invest (2011) 34(10):801–10. doi: 10.3275/7925
11. Duan Y, De Luca V, Seeman E. Parathyroid Hormone Deficiency and Excess: Similar Effects on Trabecular Bone But Differing Effects on Cortical Bone. J Clin Endocrinol Metab (1999) 84(2):718–22. doi: 10.1210/jcem.84.2.5498
Figures