4626
Reversible Changes in knee articular cartilage after half marathon: an MRI T2* study in heathy amateur runners1Department of Radiology, The Affiliated Hospital of Hangzhou Normal University, Hangzhou, China, 2Institute of Sport Medicine, Hangzhou Normal University, Hangzhou, China, 3Department of Radiology, The Children’s Hospital, Zhejiang University School of Medicine, Hangzhou, China, 4National Clinical Research Center for Child Health, Hangzhou, China, 5School of Clinical Medicine, Hangzhou Normal University, Hangzhou, China, 6Faculty of Medicine, The Chinese University of Hong Kong, HongKong, China, 71 Department of Radiology, The Affiliated Hospital of Hangzhou Normal University, Hangzhou, China, 8MR scientific Marketing, Diagnostic Imaging, Siemens Healthineers Ltd, Shanghai, China
Synopsis
This research investigated the difference in T2* value of knee cartilage between amateur runners and non-exercisers, and examined the trends in the T2* value of knee cartilage in amateur runners before and after a half marathon. The results showed that the T2* value in lateral femorotibial joint of amateur runners was lower than non-exercisers. And the T2* value increased significantly after half-marathon running, and returned to the baseline level after 3 days. This indicates that long-term running may be beneficial to joint health; the effect of a half-marathon exercise on cartilage is reversible.
Introduction
The prevalence of knee cartilage injury among athletes is significantly higher than that of the general population, which can be attributable to the higher joint load of athletes [1]. There were some studies on the acute effect of running on articular cartilage[2], while few report the effect of long-term running on knee articular cartilage. Therefore, the current study was performed to examine the effects of long-distance running on the knee cartilage in healthy amateur marathon runners and their sedentary counterparts by using T2* mapping.Materials and methods
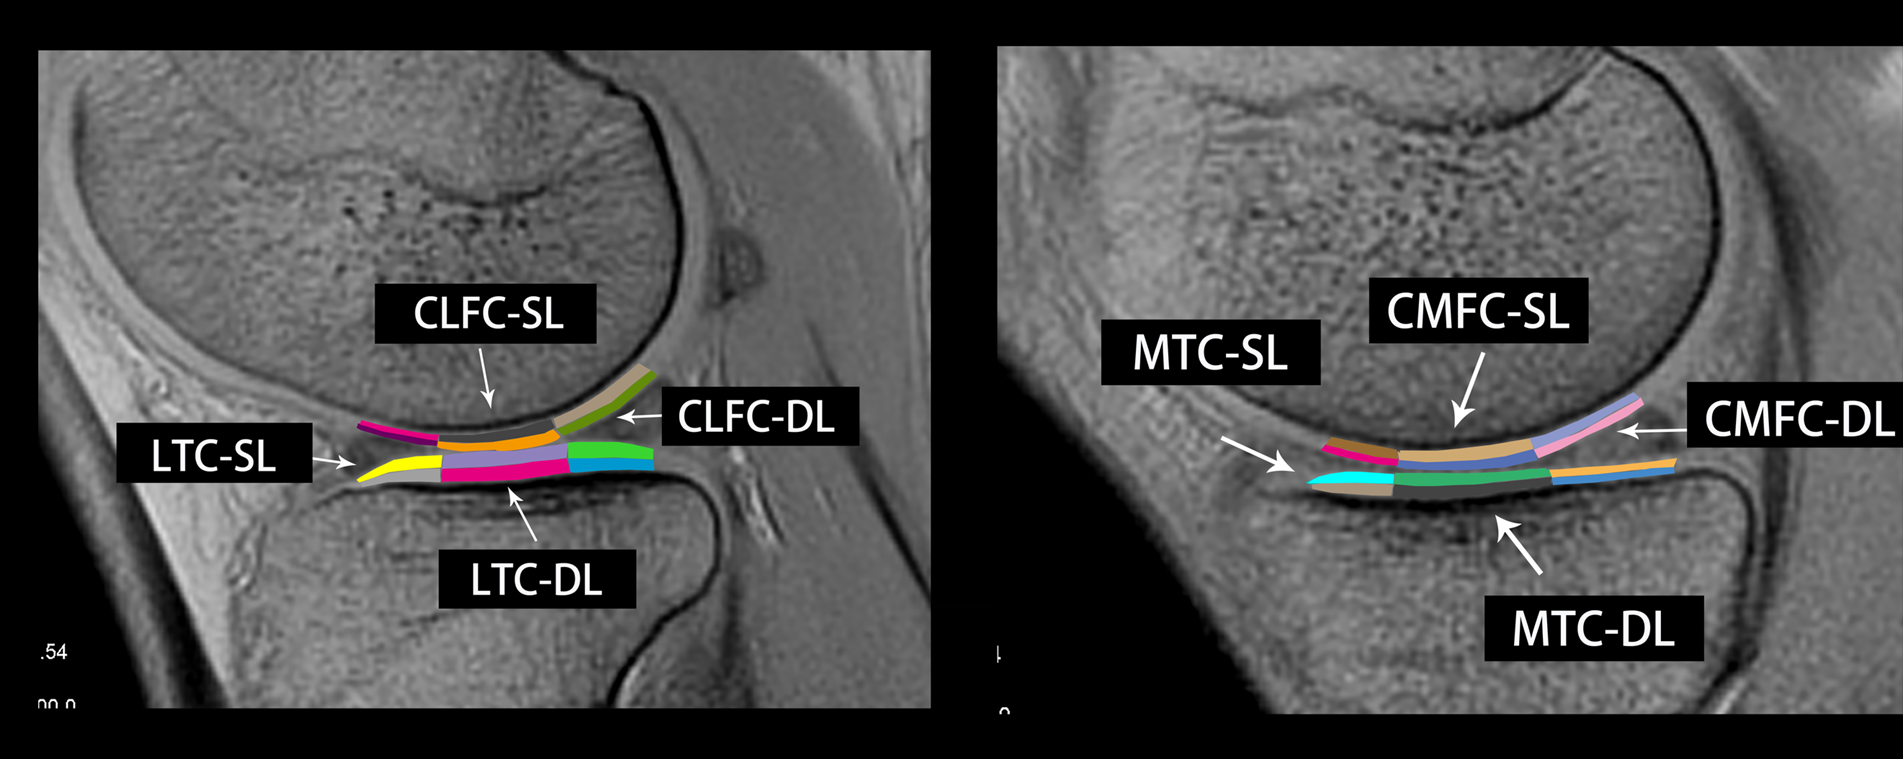
15 amateur runners and 8 matched non-exercisers were recruited from the community. Repeated T2* mapping of MR scans were performed on both right and left knees of amateur runners before (t0), immediately after (t1), 3 days after (t2) and 1 week after (t3) the half-marathon running on a 1.5T MR scanner (MAGNETOM Area, Siemens Healthcare, Erlangen, Germany). The non-exercisers were performed MR scan only at t0. The T2* mapping parameters were: TR=905.00 ms, TE=4.35/11.57/18.89/26.21/33.53ms, FOV=60.00 mm×160.00 mm, slice thickness=3.00mm, gap=0.60mm, bandwidth=260 Hz/Px.The femorotibial joint (FTJ) cartilages were divided into two parts: (1) medial femorotibial joint (MFTJ), (2) lateral femorotibial joint (LFTJ), corresponding to 4 cartilage divisions: central medial femoral cartilage (CMFC), medial tibial cartilage (MTC), central lateral femoral cartilage (CLFC), lateral tibial cartilage (LTC). With the posterior meniscal horn as the boundary, the femoral condyle cartilage is divided into the medial/lateral femoral condyle cartilage central load-bearing area (CMFC/CLFC) [3-5]. Furthermore, the cartilage in each area was divided into superficial layer and deep layer of cartilage with a boundary of 1/2 of its thickness[3, 4]. These areas were split into anterior (cartilage covered by the anterior meniscal horn), central (uncovered cartilage between the anterior and posterior meniscal horn), and posterior zone (cartilage covered by the posterior meniscal horn [3](Figure 1). The thickest layer in each segment cartilage was selected to draw the regions of interest (ROIs) manually to obtain the average T2* value in the corresponding area[12, 18]. In order to reduce the measurement error, special attention was paid to exclude bone, joint fluid, and meniscus from the ROIs. The independent sample t test was used to analyze the difference in the T2* value of the knee cartilage between amateur runners and non-exercisers. One-way repeated ANOVA tests were used to analyze changes in T2* values of cartilage in each sub-area of the runners’ knee joint at the four time-points. Bonferroni correction were performed for multiple comparisons.Results
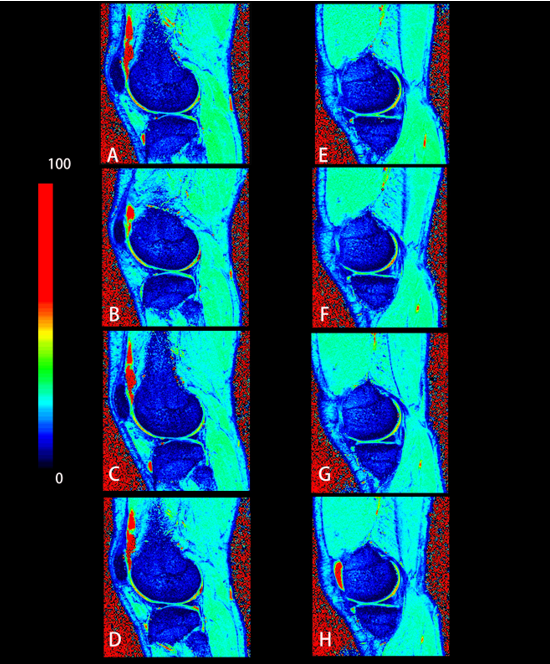
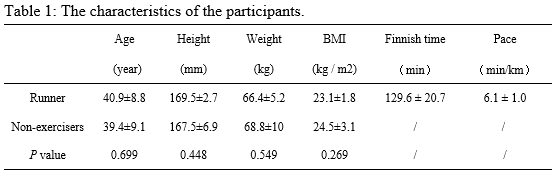
15 amateur marathon runners (14 right knees, 11 left knees) and 8 non-exercisers (8 right knees, 8 left knees) were recruited. All participants were male, in order to exclude possible cartilage data differences caused by gender. The detailed data of the participants are shown in Table 1. Compared with non-exercisers at t0, the average T2* value of the runner's LFTJ was significantly lower (23.17±2.38 ms vs 26.14±3.44 ms, P < 0.05). However, there is no significant difference in the T2* value of the medial FTJ (P > 0.05). The T2* values of superficial layer of the articular cartilage of the LTC/MTC increased immediately after running (23.88±3.09 ms vs 25.47±2.77 ms, P < 0.05; 27.79±2.62 ms vs 29.64±3.34 ms, P < 0.05). Immediately after running a half marathon (t1), the regional cartilage analysis of amateur runners showed that T2* values increased in the posterior superficial layer of LTC/ CLFC (31.29±4.2 ms vs 29.00±4.30 ms, P < 0.001; 38.07±3.03 ms vs 36.04±2.90 ms, P < 0.05) , and the central portion of superficial layer of MTC (31.58±4.20 ms vs 29.68±4.19 ms, P < 0.05). No significant difference was observed in all regions of knee cartilages after three days’ rest compared to the baseline (P>0.05). One week after running, the T2* value of cartilage remained at the baseline level. (Figure 2).Discussion
Compared with those who do not exercise, we found that the T2* value of the cartilage in the lateral compartment of the marathon athlete's knee joint was significantly reduced, and the T2* value of the cartilage in the medial compartment also showed a decreasing trend. We believe that this may be due to long-term running will cause anisotropy of cartilage collagen network and decrease of free water, which has a positive effect on cartilage health[6-8]. The increase in T2* value may reflect the change of cartilage ultrastructural composition after running[9]. Running a half marathon may temporarily cause partial degradation of proteoglycan and partial loss of collagen anisotropy in knee cartilage [10]. Therefore, the increase of T2* value may be due to a increment in water molecules and changes in collagen fiber orientation caused by running[3].We further analyzed the cartilage T2 * value 3 days and one week after the marathon run, and found no significant difference from that before. That shows that the change of cartilage in the half marathon might be reversible. Additional work including a larger sample size is warranted to corroborate our findings.Conclusion
Long distance running may benefit cartilage health, especially the lateral FTJ. Superficial layer at lateral/medial tibial cartilage could be the most susceptible area to pressure. The recovery time of T2* value after a half marathon may within three days.Acknowledgements
We sincerely thank the participants in this study.References
1.Murray IR, Benke MT, Mandelbaum BR. Management of knee articular cartilage injuries in athletes: chondroprotection, chondrofacilitation, and resurfacing. Knee Surg Sports Traumatol Arthrosc. 2016; 24(5):1617-1626.
2.Tiderius CJ, Svensson J, Leander P, Ola T, Dahlberg L. dGEMRIC (delayed gadolinium-enhanced MRI of cartilage) indicates adaptive capacity of human knee cartilage. Magnetic resonance in medicine. 2004; 51(2):286-290.
3.Schütz U, Ehrhardt M, Göd S, Billich C, Beer M, Trattnig S. A mobile MRI field study of the biochemical cartilage reaction of the knee joint during a 4,486 km transcontinental multistage ultra-marathon using T2* mapping. Sci Rep. 2020; 10(1):8157.
4.Hesper T, Miese FR, Hosalkar HS, Behringer M, Zilkens C, Antoch G, et al. Quantitative T2(*) assessment of knee joint cartilage after running a marathon. European Journal of Radiology. 2015; 84(2):284-289.
5.Subburaj K, Kumar D, Souza RB, Alizai H, Li X, Link TM, et al. The acute effect of running on knee articular cartilage and meniscus magnetic resonance relaxation times in young healthy adults. Am J Sports Med. 2012; 40(9):2134-2141.
6.Säämämen AM, Kiviranta I, Jurvelin J, Helminen HJ, Tammi M. Proteoglycan and collagen alterations in canine knee articular cartilage following 20 km daily running exercise for 15 weeks. Connect Tissue Res. 1994; 30(3):191-201.
7.Lapveteläinen T, Hyttinen M, Lindblom
J, Långsjö TK, Sironen R, Li SW, et al. More knee joint osteoarthritis (OA) in
mice after inactivation of one allele of type II procollagen gene but less OA
after lifelong voluntary wheel running exercise. Osteoarthritis and cartilage.
2001; 9(2):152-160.
8.Galois L, Etienne S, Grossin L, Cournil
C, Pinzano A, Netter P, et al. Moderate-impact exercise is associated with
decreased severity of experimental osteoarthritis in rats. Rheumatology
(Oxford). 2003; 42(5).
9.Nebelung S, Sondern B, Oehrl S, Tingart M, Rath B, Pufe T, et al. Functional MR Imaging Mapping of Human Articular Cartilage Response to Loading. Radiology. 2017; 282(2):464-474.
10.Zhang P, Yu B, Zhang R, Chen X, Shao S, Zeng Y, et al. Longitudinal study of the morphological and T2* changes of knee cartilages of marathon runners using prototype software for automatic cartilage segmentation. The British journal of radiology. 2021; 94(1119):20200833.
Figures