4625
Evaluate Articular Cartilage in Early-Stage Knee Osteoarthritis with a Two-Compartment Hybrid Multidimensional MR Imaging Method1Department of Radiology, Yueyang Hospital of Integrated Traditional Chinese and Western Medicine, Shanghai University of Traditional Chinese Medicine, Shanghai, China, 2United Imaging Healthcare, Shanghai, China
Synopsis
Evaluation of early-stage knee osteoarthritis (OA) has long been of wide concern, while MRI has proved its value in this field by the richness of contrasts and non-invasive nature. However, MRI detection for composition change in OA still calls for deeper researches. ADC and T2 measured by conventional MRI are only an average of intra-voxel components and assumed to be independent. However, by performing a hybrid multidimensional MR imaging (HM-MRI) method, an implied correlation between ADC and T2 in articular cartilage has emerged. Moreover, Vnormal might offer extra information in detecting cartilage degeneration at early stage of OA than conventional ADC/T2 parameters.
Introduction
Knee osteoarthritis (OA) has long been the most common joint disease and the leading cause of disability, especially for elder people, thus leading to an extensive cost of public health budget 1-2. Therefore, accurate diagnose of OA at early onset is desired, and MRI plays an important role due to the richness of contrasts and non-invasive property1,3-4. However, compared to the various studies about cartilage morphology, MRI detection for composition change in OA still calls for deeper researches. Early stages of OA are associated with composition changes, e.g., the concentration of proteoglycans and water, which leads to T2 and apparent diffusion coefficient (ADC) changes in articular cartilage5-6. But ADC and T2 measured by conventional MRI are only an average of intra-voxel components and assumed to be independent.Hybrid multidimensional MRI (HM-MRI) takes different but correlated MRI parameters together into consideration, providing component information within an assumed multi-component model7. Specifically, by measuring signals as a function of echo time (TE) and b value simultaneously, HM-MRI could offer volume fraction about ADC-T2 related components or compartments. This work proposed an HM-MRI model with a normal and an abnormal compartment to expand the diagnostic capabilities in OA detection at early stage.
Methods
Sixty-seven patients with clinical OA symptoms (mean age, 62 years, range, 34 ~89 years; 27 males, 36 females) and twenty-three healthy controls (mean age, 58 years, range, 35 ~ 81years, 14 males, 13 females) were recruited for the study between October 2020 and July 2021. Kelgren-Lawrence grade (KLG) were given for each participant by knee X-ray, and semi-quantitative modified Whole-Organ MR Imaging Scores (WORMS) were also evaluated.MRI was performed on a 3T scanner (uMR 780, United Imaging Healthcare, Shanghai, China) with a standard 12-channel knee coil. Routine included fat-suppressed PD-weighted image, fat-suppressed T2-weighted image and sagittal T1-weighted image firstly. Then the multi-TE-multi-b-value DWI sequence acquired 30 data points with five echo time (TE = 90, 105, 120, 135 and 150 ms) and six b-values (b = 01, 2001, 4001, 8001, 10002, 12003 s/mm2, subscripts denote the average number). Other DWI parameters: repetition time TR = 3000 ms, field of view = 160×160 mm, slice number = 10, slice thickness = 3 mm, slice gap = 0.3 mm, matrix = 112×112. Regions of interests (ROIs), including medial patella, lateral femoral condyle, medial femoral condyle, lateral tibial plateau and medial tibial plateau, were manually placed on the high-resolution fat-suppressed PD-weighted images to cover the knee cartilage, then mapped to the DWI images.
A two-compartment model containing a normal and an abnormal compartment was adopted, given by
S = S0 normal *e-b*ADC_normal *e-TE/T2_normal + S0 abnormal *e-b*ADC_abnormal *e-TE/T2_normal (1)
where S is the signal intensity at each and value; S0 is the signal intensity at b=0 and TE=0 ; ADCnormal/abnormal and T2 normal/abnormal are the T2 and ADC values for each compartment. Besides, the volume fractions of the normal and abnormal compartment, Vnormal and Vabnormal, can be defined by,
Vnormal/abnormal = S0 normal/abnormal/(S0 normal+S0 abnormal) (2)
ADCnormal/abnormal, T2normal/abnormal and S0 normal/abnormal were obtained voxel-by-voxel by fitting Equation (1). Several constraints and thresholds were chosen considering the known characters of articular cartilage1,8: 0≤ADCnormal≤1.2≤ ADCabnormal≤3.0 , 0 ms≤T2 normal and T2 abnormal≤100 ms.
Results
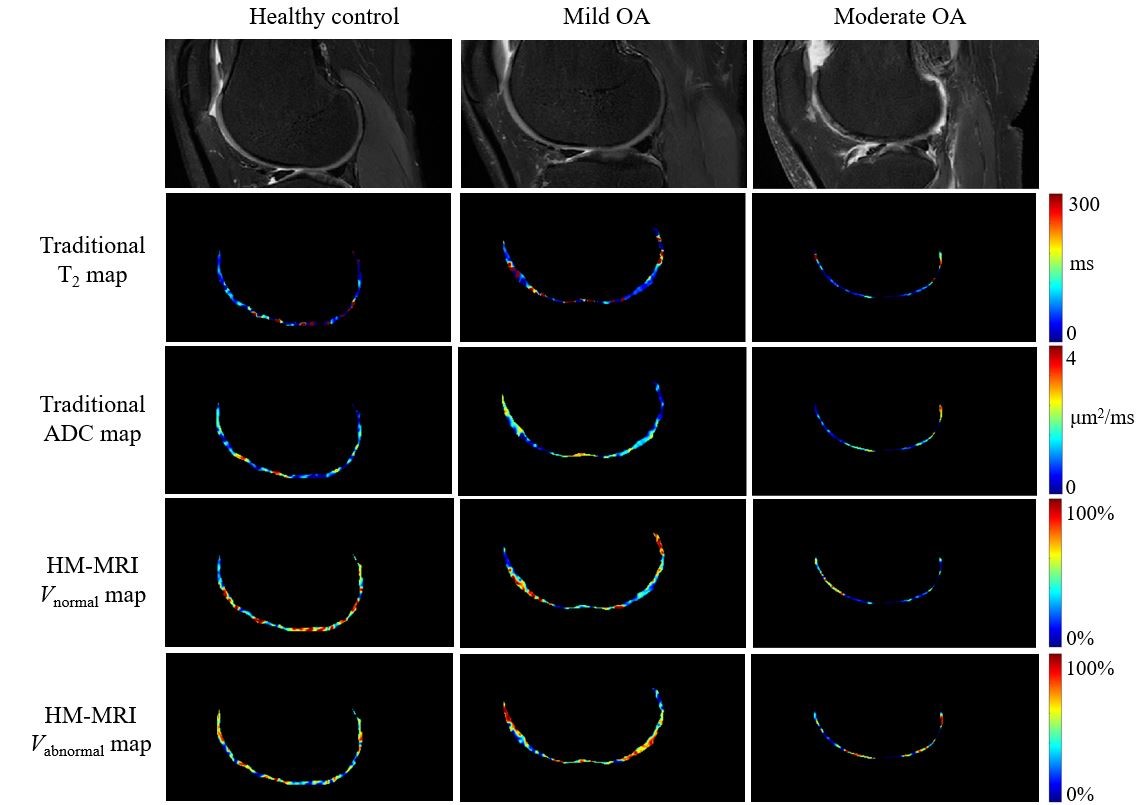
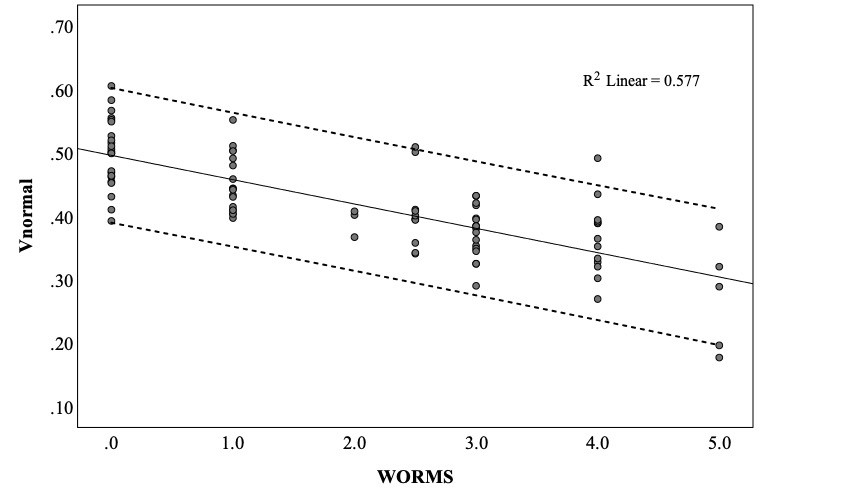
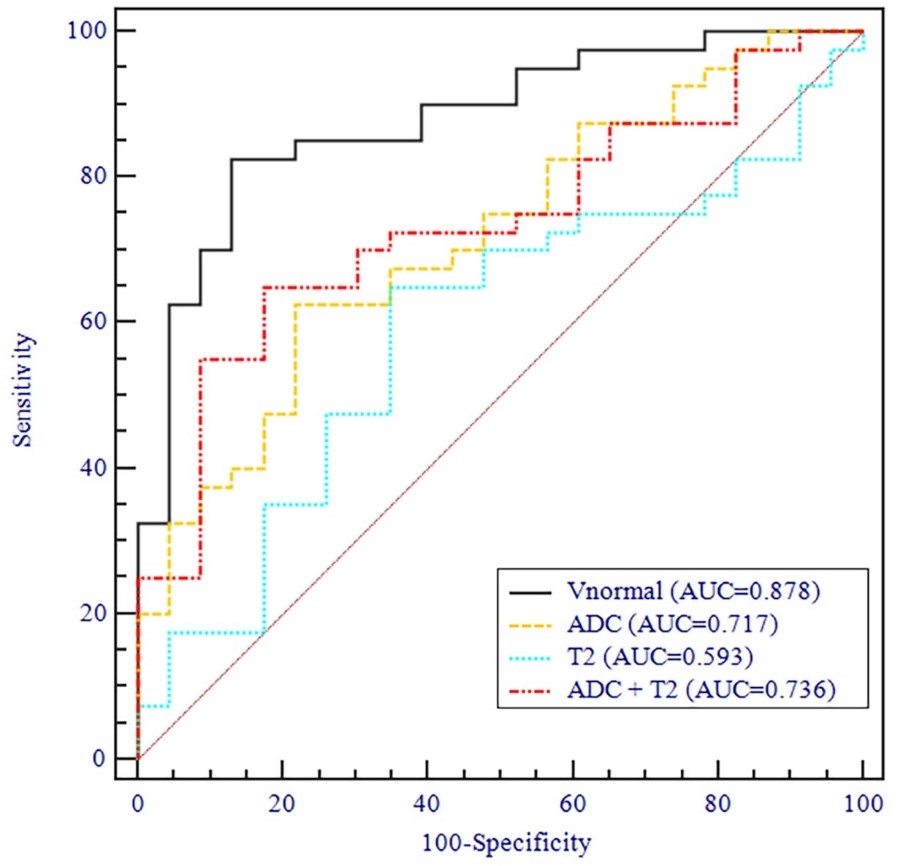
The subjects in the three groups showed no significant differences in the distribution of age or sex. The representative Vnormal maps of the knee joint (lateral cartilage) for healthy control, mild and moderate OA, are provided in Figure 1, in comparison with ADC and T2 maps.A strong negative correlation was found between the overall Vnormal values and the degree of OA progression (rho = -0.778, P<0.001, Figure 2). For comparison, a slight increase in the T2 relaxation time averaged over the entire cartilage surface, yet no statistically significant differences were found between the control, mild OA groups and moderate OA groups. The global average of ADC revealed significant differences among the three groups (all P < 0.05). The mean Vnormal values resulted in a higher AUC value (0.878) than those obtained from ADC (0.717),T2 (0.593) or ADC combined with T2 (0.736) values for distinguish early OA from healthy controls (Figure 3).
Discussion
Early-stage OA is related to loss of proteoglycans, disruption of the collagen architecture, and an increase in water content5-6. Although these biological changes may affect the distribution of both ADC and T2, ours and those previous studies showed T2 was not well-enough to discriminate between mild or moderate OA patients and healthy volunteers. However, our ADC-T2 correlated model showed better effects than those of conventional ADC or ADC+T2, indicating that T2 actually has effective information, which can help improve the diagnostic performance. The possible reason is, while conventional MRI techniques are only sensitive to the voxel-averaged diffusion/relaxation profile and macroscopic information, HM-MRI could provide possibility to distinguish tissue components at sub-voxel level, thus more sensitive to the biological changes in early-stage OA.Conclusion
Significant differences between healthy controls and subjects with mild or moderate OA were found in Vnormal values. In comparison with conventional ADC/T2, HM-MRI which depends on correlation of ADC and T2, may provide additional information of composition changes in articular cartilage in early-stage OA.Acknowledgements
NoneReferences
1. J.G. Raya, A. Horng, O. Dietrich, S. Krasnokutsky, L.S. Beltran, P. Storey, M.F. Reiser, M.P. Recht, D.K. Sodickson, C. Glaser, Articular cartilage: in vivo diffusion-tensor imaging, Radiology 262 (2012) 550-559.
2. R. Stahl, A. Luke, X. Li, J. Carballido-Gamio, C. B. Ma, S. Majumdar, T.M. Link, T1rho, T2 and focal knee cartilage abnormalities in physically active and sedentary healthy subjects versus early OA patients—A 3.0-tesla MRI study, Eur Radiol 19 (2009) 132-143.
3. D. Hayashi, F.W. Roemer, A. Guermazi, Magnetic resonance imaging assessment of knee osteoarthritis: current and developing new concepts and techniques, Clin Exp Rheumatol 37 Suppl 120 (2019) 88-95.
4. H. Nishioka, J. Hirose, N. Okamoto, T. Okada, K. Oka, T. Taniwaki, E. Nakamura, Y. Yamashita, H. Mizuta, Evaluation of the relationship between T1rho and T2 values and patella cartilage degeneration in patients of the same age group, Eur J Radiol 84 (2015) 463-468.
5. V. Mlynarik, I. Sulzbacher, M. Bittsansky, R. Fuiko, S. Trattnig, Investigation of apparent diffusion constant as an indicator of early degenerative disease in articular cartilage, J Magn Reson Imaging 17 (2003) 440-444.
6. A.R. Armiento, M.J. Stoddart, M. Alini, D. Eglin, Biomaterials for articular cartilage tissue engineering: Learning from biology, Acta Biomater 65 (2018) 1-20.
7. A. Chatterjee, R.M. Bourne, S. Wang, A. Devaraj, A.J. Gallan, T. Antic, G.S. Karczmar, A. Oto, Diagnosis of prostate cancer with noninvasive estimation of prostate tissue composition by using hybrid multidimensional MR imaging: A feasibility study, Radiology 287 (2018) 864-873.
8. E. Staroswiecki, K.L. Granlund, M.T. Alley, G.E. Gold, B.A. Hargreaves, Simultaneous estimation of T(2) and apparent diffusion coefficient in human articular cartilage in vivo with a modified three-dimensional double echo steady state (DESS) sequence at 3 T, Magn Reson Med 67 (2012) 1086-1096.
Figures