4624
MIXTURE-DOSMA: Initial clinical research of a comprehensive and multi-parametric quantitative 3D knee MR exam in patients with knee joint pain.1Radiology, Eastern Chiba Medical Center, Chiba, Japan, 2Philips Japan, Tokyo, Japan, 3Philips Healthcare NA, San Francisco, CA, United States, 4Electrical Engineering, Stanford University, Stanford, CA, United States, 5Radiology, Stanford University, Stanford, CA, United States, 6Faculty of Health Sciences, Institute of Medical, Pharmaceutical and Health Sciences, Kanazawa University, Kanazawa, Japan, 7General Medical Services, Chiba University Graduate School of Medicine, Chiba, Japan, 8Orthopaedic Surgery, Eastern Chiba Medical Center, Chiba, Japan
Synopsis
Multi-Interleaved X-prepared TSE with inTUitive RElaxometry (MIXTURE) is a recently developed 3D magnetization-prepared turbo spin-echo sequence. MIXTURE provides 3D high-resolution isotropic knee morphometry and T1ρ relaxometry in a clinically reasonable scan time. In this study, we integrated MIXTURE with the into a Deep-learning, Open-Source Medical Analysis (DOSMA) framework for deep learning-powered musculoskeletal MR image and evaluated its clinical usefulness in patients with knee joint pain. We show that the combination of MIXTURE and DOSMA enables a comprehensive whole knee MR exam including 3D isotropic submillimeter imaging, T2- and T1ρ-mapping, and standardized image analysis. The clinical insight MIXTURE-DOSMA brings is demonstrated.
Introduction
In MR examination of the knee, 3D high-resolution imaging is clinically important to depict subtle pathophysiological changes. In addition, quantitative relaxometry values, such as T2 and T1ρ, have attracted much attention because they can potentially be useful for non-invasive early diagnosis of degenerative disease of the knee joint, including osteoarthritis1–4, and for monitoring rehabilitation following acute joint injuries. However, acquiring high-resolution morphological as well as quantitative images is time-consuming and thus hinders clinical translation.For this reason, a new technique termed MIXTURE (Multi-Interleaved X-prepared TSE with inTUitive RElaxometry) was recently introduced5. MIXTURE is 3D magnetization-prepared turbo spin-echo (TSE) imaging and provides proton density-weighted (PDW) and fat-suppressed T2-weighted (FS-T2W) images with 3D isotropic submillimeter resolution in a clinically reasonable scan time6. In addition, multiple TSE shots with arbitrary echo times in MIXTURE can be used to compute 3D T1ρ relaxometry map7.
To standardize and simplify image analysis workflow, we utilize the Deep Open-Source Medical Analysis (DOSMA) framework that enables deep learning-powered musculoskeletal MR image analysis8. DOSMA provides a variety of analysis methods such as automatic cartilage segmentation, interscan registration, relaxometry parameter quantification, and visualization. Therefore, the combination of MIXTURE and DOSMA has the potential to provide a comprehensive whole knee MR exam, including T2- and T1ρ-mapping, 3D isotropic submillimeter resolution imaging, and standardized image analysis techniques. The purpose of this study was to investigate the clinical usefulness of MIXTURE-DOSMA in the knee MR examination of patients with knee joint pain.
Methods
Three patients with knee joint pain were examined on 3.0T whole-body clinical systems (Ingenia CX, Philips Healthcare, Best, the Netherland) with a 16ch knee coil. The study was approved by the local IRB, and written informed consent was obtained from all subjects.We acquired quantitative Double Echo Steady State (qDESS)9 and MIXTURE to compute T2 and T1ρ relaxometry, respectively. The acquisition scheme of qDESS and MIXTURE is shown in Fig. 1. The qDESS images were acquired with TE = 4.9 and 10.2 ms. MIXTURE has two interleaved TSE shot blocks to acquire two images with different spinlock (SL)-preparation times (SL = 1.0 and 50.0 ms) with amplitude of the SL pulse 500 Hz. The first TSE shot in MIXTURE did not employ spectral-selective IR (SPAIR) pulse and thus provides PDW contrast.
Fig. 2 shows the workflow of DOSMA (v0.1.0) in conjunction with MIXTURE and qDESS. First, the root-sum-of-squares (RSS) of the two echoes in qDESS was computed and then used as an input to a built-in segmentation deep neural network model in DOSMA10,11. Among models available, the model trained on the Stanford Knee MRI with Multi-Task Evaluation (SKM-TEA) datasets (v1)10 was selected and knee cartilages including femoral cartilage, patellar cartilage, tibial cartilage, and meniscus were automatically segmented. Next, MIXTURE images were intra-registered and then registered to the first echo of the qDESS image. 3D T2 and T1ρ relaxometry maps were computed by curve fitting the two echoes of qDESS and two TSE shots of MIXTURE, respectively. Lastly, the 3D quantitative maps corresponding to the femoral cartilage segmentation mask were unrolled and visualized in 2D projection maps. In the image analysis step using DOSMA, both qDESS and MIXTURE were reconstructed to 0.38x0.38x1.5 mm3 to increase the signal to noise ratio.
The scan parameters were optimized for 3.0T with the main imaging parameters for qDESS: sagittal acquisition, acquisition voxel size=0.76 mm3, reconstruction voxel size=0.38 mm3, FOV=150x150 mm, C-SENSE reduction factor=2.5, fat suppression=ProSet (1331), TR/TE1/TE2=15/4.9/10.2ms, and total acquisition time=3:34. For MIXTURE T1ρ: 3D PDW and FS-T2W TSE, sagittal acquisition, acquisition voxel size=0.76 mm3, reconstruction voxel size=0.38 mm3, FOV=150x150mm, C-SENSE reduction factor=4.5, TR/TE=1600/23ms, TSE factor=70, and total acquisition time=7:52.
Results and Discussions
For patients with knee joint pain who had irregular cartilage shape and thickness, the femoral cartilage was automatically segmented and the 2D projection of T2 and T1rho maps were divided into six regions. (Fig. 3-5). In the 2D projection map, T2 and T1rho values were both low (10-20 ms) in the area with thinning cartilage, and were both high (50-60 ms) in the area with irregular cartilage, suggesting cartilage degeneration.Curved cartilage, such as femoral cartilage, is difficult to observe even when superimposed on MR images. However, DOSMA enables the projection of curved cartilage onto a 2D plane, which is suitable for identifying cartilage damage such as degeneration and thinning. Another advantage of DOSMA is that it performs segmentation automatically, thus eliminating subjective measurement errors and reducing the burden on the observer, even with a large amount of data such as 3D. In this study, we acquired conventional morphological 3D images (PDW and FS-T2W) in addition to quantitative 3D images (T2 map and T1rho map) by using MIXTURE and qDESS. By combining these images with DOSMA, which improves the quantification of cartilage, it was possible to visually evaluate the spatial distribution of cartilage damage.
Conclusion
MIXTURE-DOSMA combination enabled a comprehensive whole knee MR exam including 3D PDW and FS-T2W isotropic submillimeter resolution morphometry, 3D T2 and T1ρ relaxometry mapping, and standardized image analysis. It has the potential to improve the MRI diagnosis of knee joint pain with cartilage damage, and is expected to have further clinical usefulness.Acknowledgements
No acknowledgement found.References
1. Xia Y, Farquhar T, Burton‐Wurster N, Ray E, Jelinski LW. Diffusion and relaxation mapping of cartilage‐bone plugs and excised disks using microscopic magnetic resonance imaging. Magn Reson Med. 1994;31(3):273-282. doi:10.1002/mrm.1910310306
2. Dardzinski J, Slyke A Van, Mosher J, Smith B. Spatial variation of T2 in human articular cartilage. Radiology. 1997;205:546-550.
3. Duvvuri U, Reddy R, Patel SD, Kaufman JH, Kneeland JB, Leigh JS. T1ρ-relaxation in articular cartilage: Effects of enzymatic degradation. Magn Reson Med. 1997;38(6):863-867. doi:10.1002/mrm.1910380602
4. Regatte RR, Akella SVS, Borthakur A, Kneeland JB, Reddy R. In vivo proton MR three-dimensional T1ρ mapping of human articular cartilage: Initial experience. Radiology. 2003;229(1):269-274. doi:10.1148/radiol.2291021041
5. Yoneyama M, Sakai T, Zhang S, et al. MIXTURE : A novel sequence for simultaneous morphological and quantitative imaging based on multi-interleaved 3D turbo-spin echo MRI. Proc Intl Soc Mag Res Med. 2021;29:4203.
6. Sakai T, Yoneyama M, Watanabe A, et al. Simultaneous anatomical , pathological and T2 quantitative knee imaging with 3D submillimeter isotropic resolution using MIXTURE. In: Proc Intl Soc Mag Reson Med. Vol 29. ; 2021:0845.
7. Saruya S, Suzuki M, Yoneyama M, Inoue K, Kozawa E, Niitsu M. 3D sub-millimeter isotropic knee cartilage T1ρ mapping using multi-interleaved fluid- attenuated TSE acquisition (MIXTURE). In: Vol 29. ; 2021:2977.
8. Desai AD, Barbieri M, Mazzoli V, et al. DOSMA: A deep-learning, open-source framework for musculoskeletal MRI analysis. Proc Int Soc Magn Reson Med. 2019;27:1106.
9. Lu Q, Hargreaves BA, Chaudhari AS. Application of Compressed Sensing to Quantitative Double Echo steady state ( qDESS ) for Rapid T2 Relaxometry in Knees. Proc Intl Soc Mag Reson Med. 2020;28:2733.
10. Desai AD, Schmidt AM, Rubin EB, et al. SKM-TEA : A Dataset for Accelerated MRI Reconstruction with Dense Image Labels for Quantitative Clinical Evaluation. 2021
11. DOSMA: Deep Open-Source Medical Image Analysis. https://dosma.readthedocs.io/en/latest/index.html
Figures
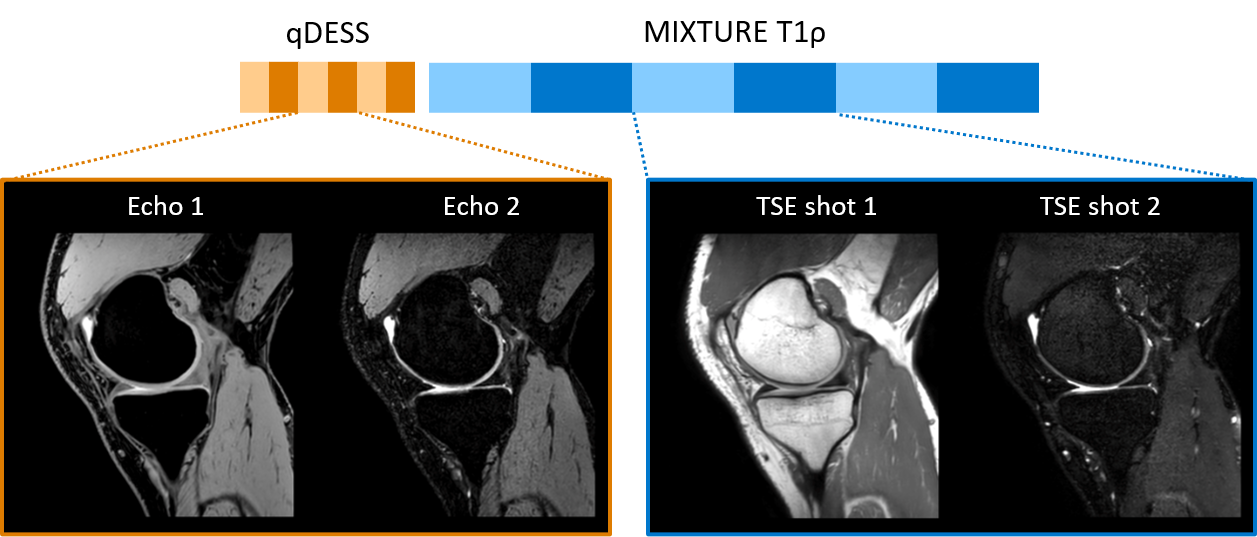
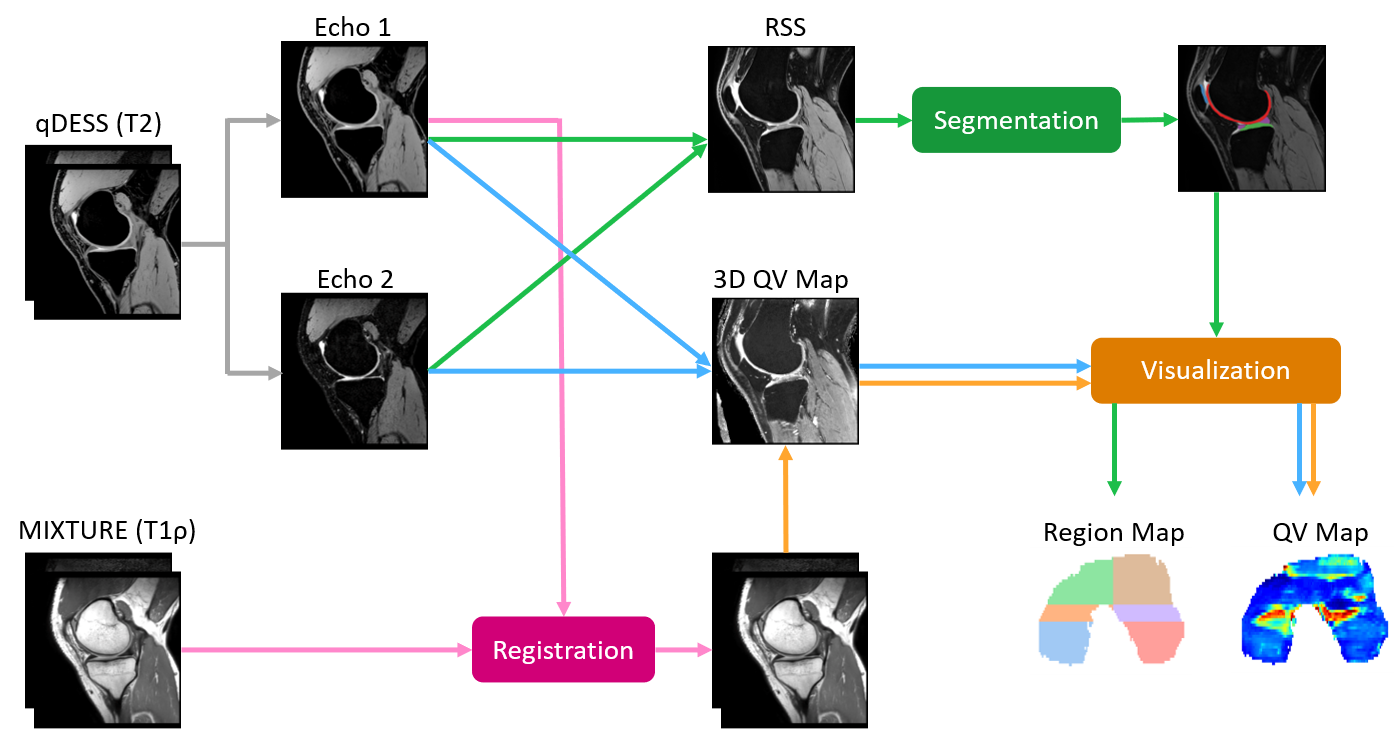
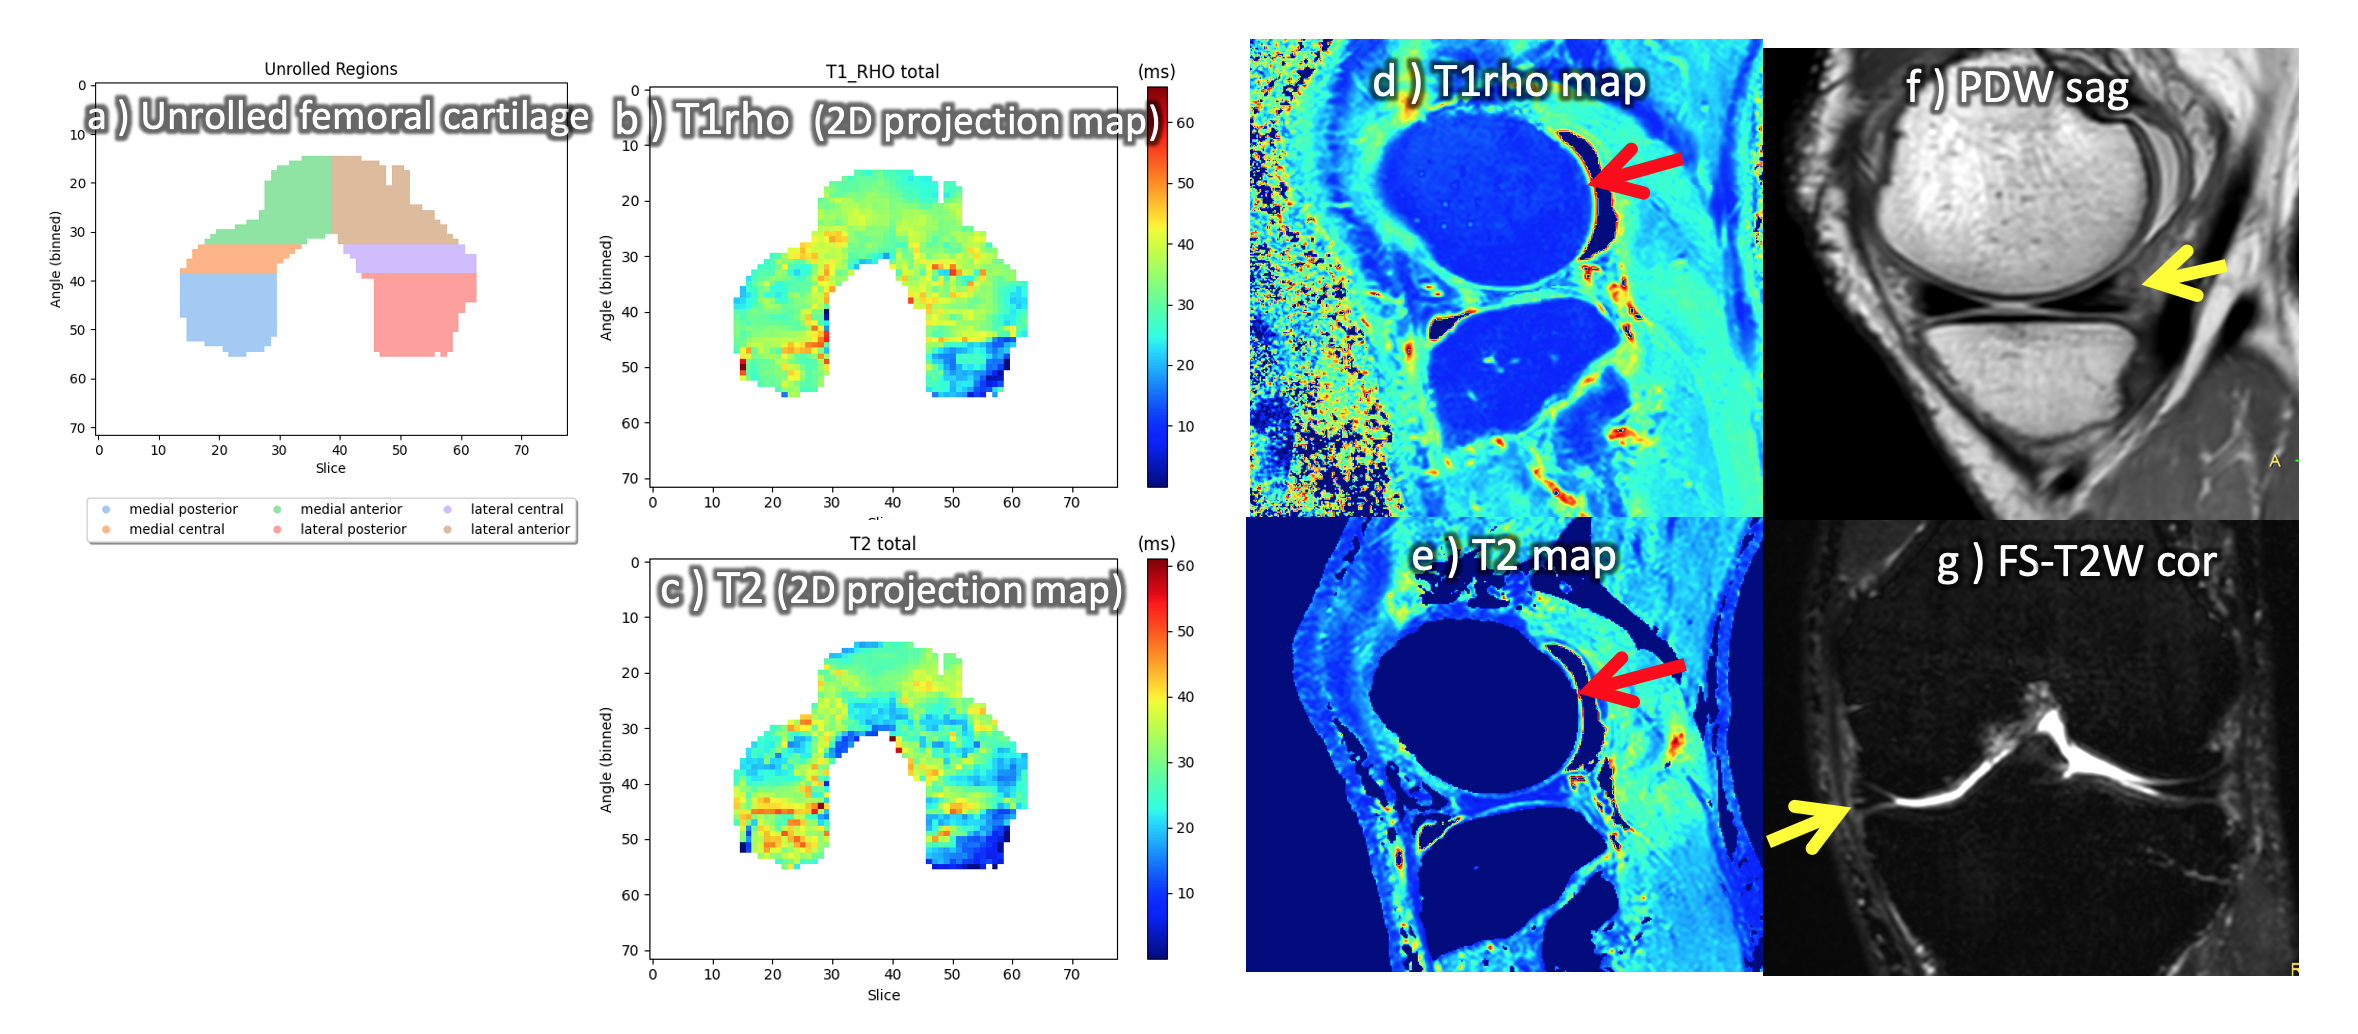
Figure 3. Various images obtained from MIXTURE and qDESS. Left knee joint pain. Age 66, male.a) Unrolled femoral cartilage, b) 2D projection of T1rho map, c) 2D projection T2 map, d) T1rho map, e) T2 map, f) PDW sag, g) FS-T2W cor.
2D projection of T1rho and T2 maps showed low values in the lateral posterior region (b, c). On sagittal maps (d, e) there was thinning of the cartilage, which coincided with the low values on the 2D projection map. On PDW (f) and FS-T2W (g) images, high-signal meniscus tear was observed in the posterior horn of the medial meniscus.
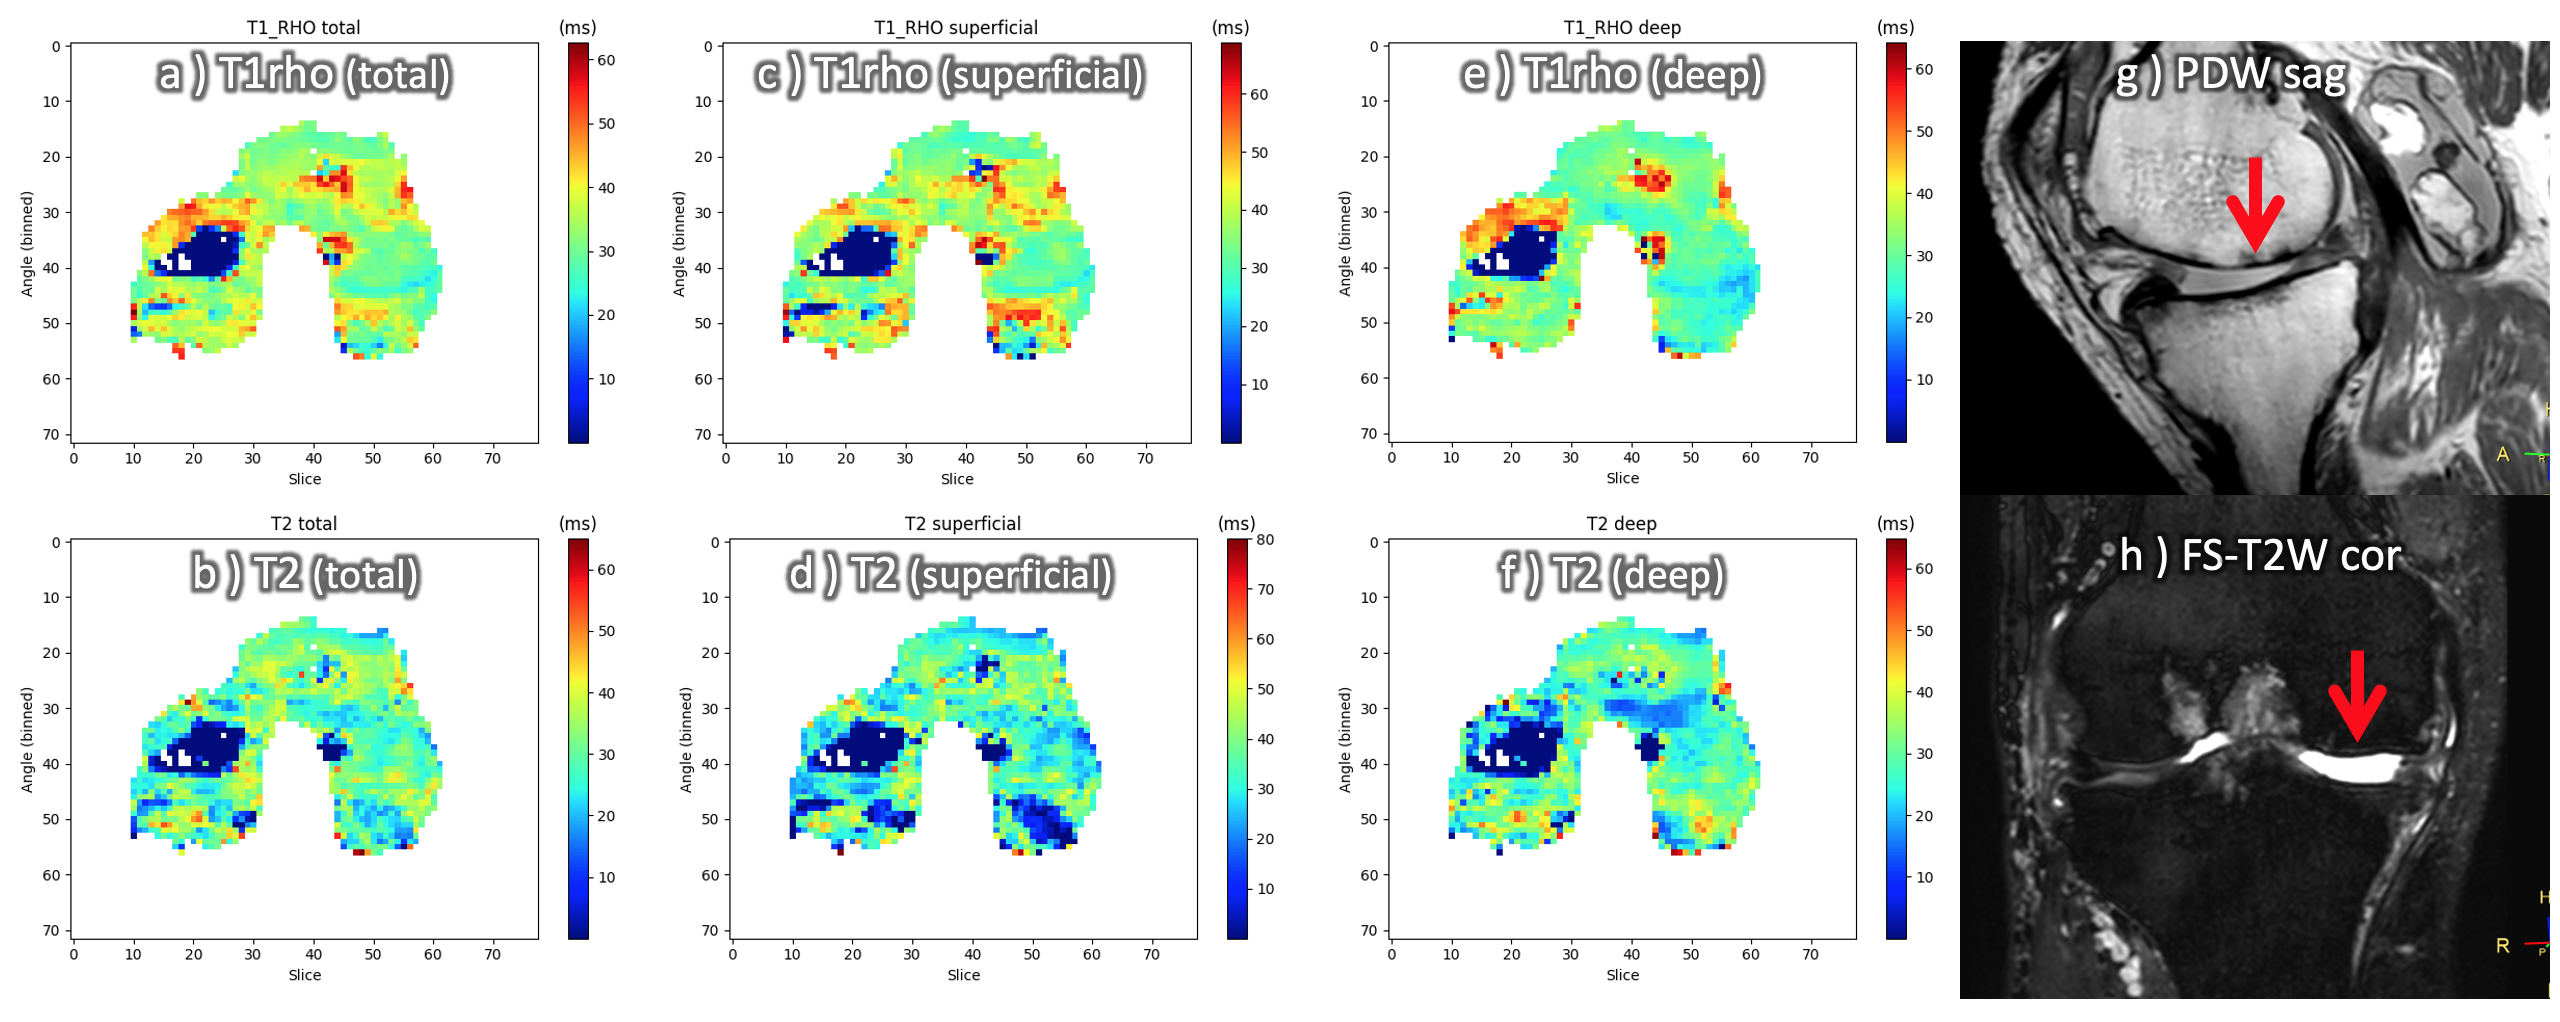
Figure 4. Various images obtained from MIXTURE and qDESS. Right knee joint pain. Age 68, male.
2D projection map of T1rho and T2 (a, b) total, (c, d) superficial, (e, f) deep layers of the femoral cartilage. g) PDW sag, h) FS-T2W cor. 2D projection map of the T1rho and T2 showed low values in the medial central region (a-f). (g, h) On PDW and FS-T2W images, cartilage thinning and findings of osteonecrosis were observed, which was consistent with the trend in the quantitative maps.
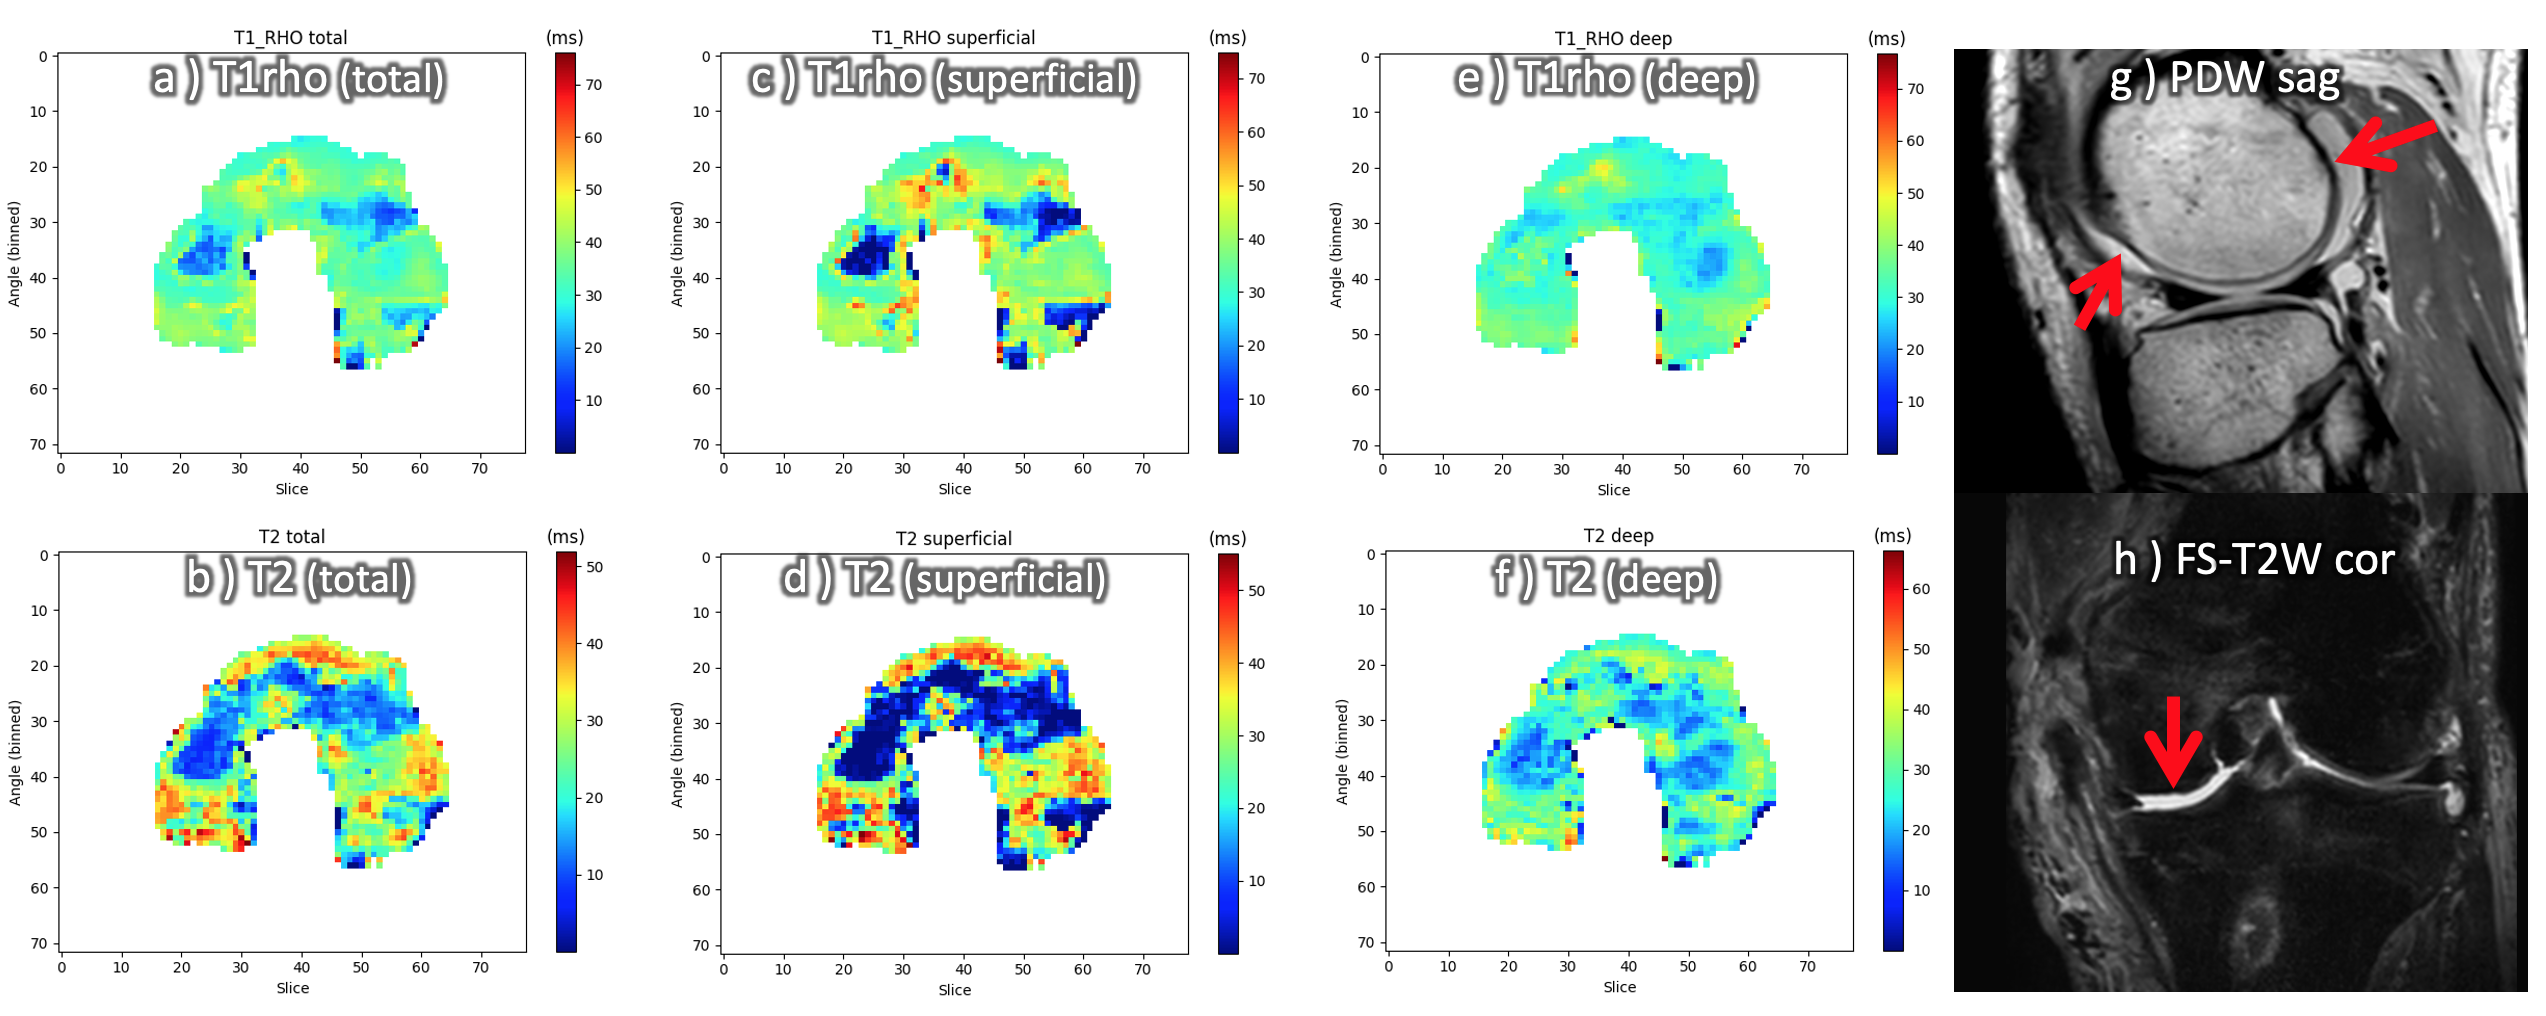
Figure 5. Various images obtained from MIXTURE and qDESS. Left posterior cruciate ligament reconstruction. Age 60, male.
2D projection maps of T1rho and T2 (a, b) total, (c, d) superficial, (e, f) deep layers. g) PDW sag, h) FS-T2W cor. 2D projection of T1rho and T2 maps showed low values in the medial central, and lateral anterior and posterior region (a-f), and there were scattered areas of high values in the superficial layer (c, d). (g, h) On PDW and FS-T2W images, there was thinning of the cartilage coincides with the low values.