4619
T2 map segmentation into the deep, intermediate, and superficial layers when staging of patellar cartilage chondromalacia1Clinical and Research Institute of Emergency Pediatric Surgery and Trauma, Moscow, Russian Federation, 2National Research Nuclear University MEPhI, Moscow, Russian Federation, 3Philips Healthcare, Moscow, Russian Federation, 4Institute of Biochemical Physics, Russian Academy of Sciences, Moscow, Russian Federation
Synopsis
This paper has demonstrated the benefits of segmentation into the deep, intermediate, and superficial layers in analysis of T2 maps of patellar cartilage with chondromalacia. In the deep and intermediate layers, the Т2 values were significantly different in all the patients groups, while the T2 values in the superficial layer did not depend on the disease grade. Compared with the whole cartilage assessment, this approach increased the sensitivity and specificity of chondromalacia staging by 17% and therefore can significantly increase the clinical efficiency of T2 mapping.
Introduction
Chondromalacia is a pathological process characterized by the thinning, softening, and gradual destruction of cartilage tissue. This disease is the leading cause of patellofemoral pain syndrome and could substantially reduce the quality of life1. T2 mapping, which is sensitive to the water content and integrity of the collagen matrix2-4, could be useful for the detection and staging of chondromalacia as well as for the monitoring of the condition of the knee joint cartilage during treatment and recovery periods. Various biochemical and biophysical processes might be involved in cartilage degradation in different zones, which differ in collagen fiber organization as well as in water, chondrocyte, and proteoglycan content. Thus, in the present study, we aimed to investigate T2 relaxation times separately in the deep, intermediate, and superficial layers based on the severity of chondromalacia as well as the practical and clinical efficiency of this approach.Methods
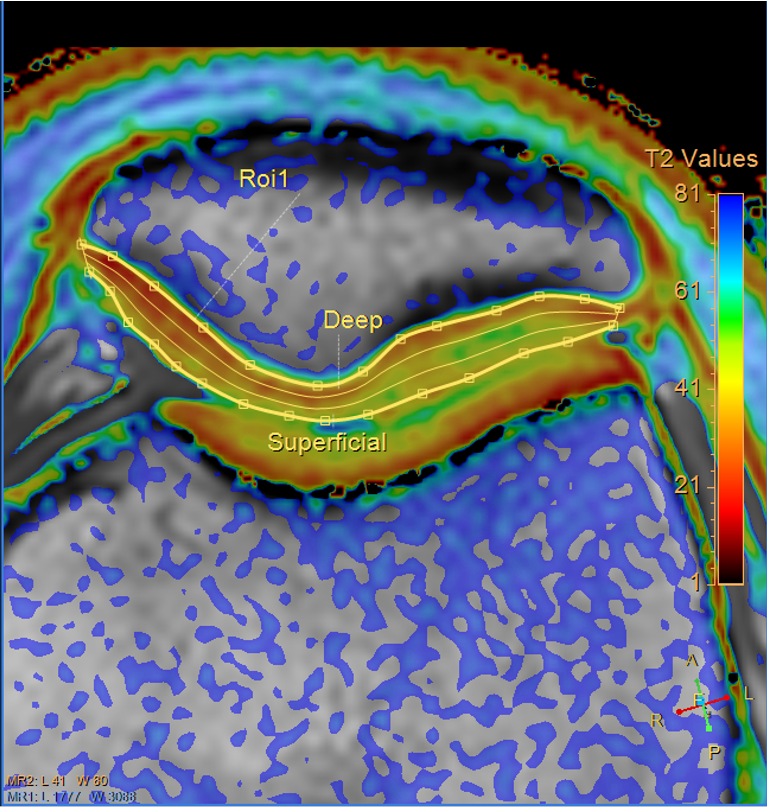
We included 171 (15.1 ± 1.8 years) patients with different stages of chondromalacia, who have been hospitalized in Clinical and Research Institute of Emergency Pediatric Surgery and Trauma, and 51 healthy controls (14.7 ± 2.2 years). All study participants underwent MRI examination, which was performed at Philips Achieva dStream 3.0T scanner (Philips Healthcare) using 16-chanel dStream knee coil. The grade of chondromalacia was assessed by radiologists from routine MRI images according to the modified Outerbridge scale. Patients with the 1st and 2nd degrees of chondromalacia were grouped into the mild trauma group (133 patients) and patients with the 3rd and 4th degrees - into the severe trauma group (32 patients). The scientific protocol included T2 mapping, performed using turbo spin echo (6 echo times, ranging from 13 to 78 ms [ΔTE = 13 ms]; repetition time, 2000 ms; voxel size, 0.4 × 0.4 × 3 mm in the axial plain). Analysis of T2 maps was carried out using the Cartilage Assessment utility in the Philips IntelliSpace Portal software. T2 values were quantified in the whole cartilage and in the deep, intermediate, and superficial layers separately (Fig. 1). A one-way repeated measures analysis of variance (ANOVA) was used to identify the intergroup differences between the T2 values within each layer in the control, mild, and severe groups. The threshold of significance was set at p < 0.05. Based on the T2 relaxation times, a one-vs-rest logistic regression algorithm was used to create a classification model for chondromalacia severity determination.Results
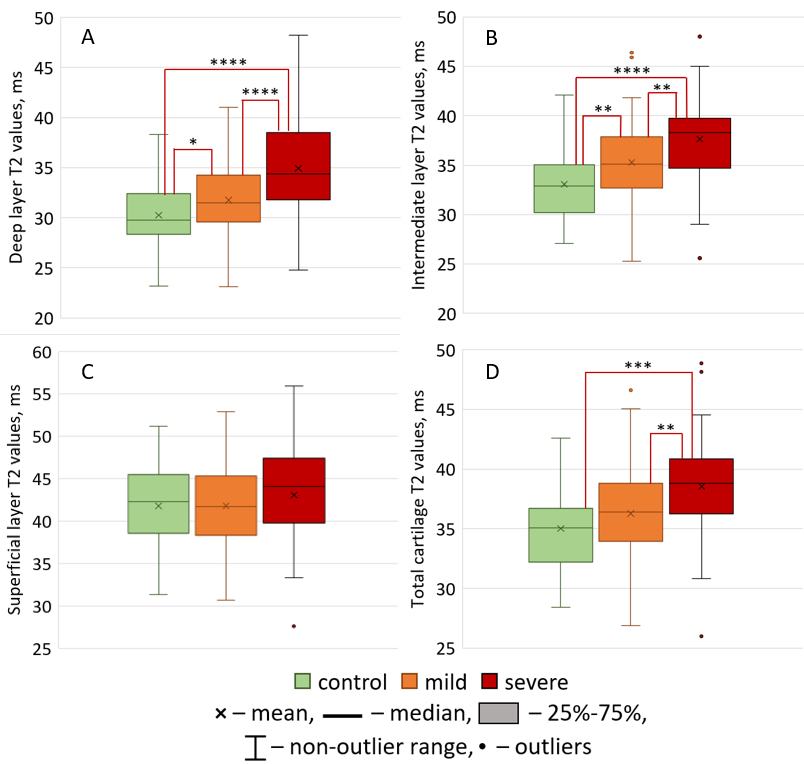
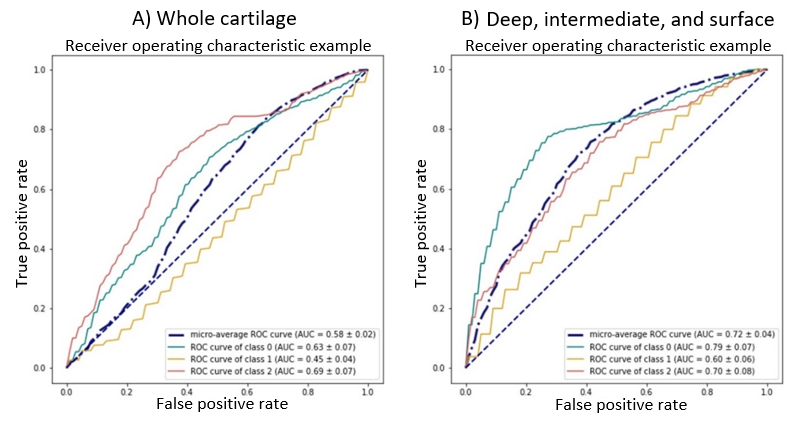
No statistically significant differences were found in the superficial layer T2 values between the patient groups (Fig. 2C). In the deep and intermediate layers, the Т2 values were significantly different in all the patients groups, while the T2 relaxation time increased with the degree of chondromalacia (deep layer, 30.3 ± 3.3 ms vs. 31.8 ± 3.5 ms vs. 34.9 ± 4.8 ms; intermediate, 33.0 ± 3.7 ms vs. 35.3 ± 3.8 ms vs. 37.7 ± 5.0 ms) (Fig. 2A,B). By contrast, on analyzing the T2 values of the whole cartilage, a significant increase was seen in the severe chondromalacia group compared with in the control and mild chondromalacia groups (Fig.2D). As the number of features increased, the created classification model’s sensitivity and specificity increased from 58% and 52%, respectively, in the whole cartilage assessment to 69% and 61%, respectively, in the model with all three layers (Fig. 3).Discussion
For the first time T2 values were determined in the deep, intermediate, and superficial patellar cartilage layers in patients with different stages of chondromalacia as compared with control group. The newest finding of this study is that the transverse relaxation time constant, T2, of the patellar articular cartilage increases in the deep and intermediate cartilage layers with the increase in the severity of chondromalacia. The increase in T2 may be associated with damage of the collagen matrix, which causes an increase in the content and mobility of water, and as a result, increases the T2 values.According to previous studies5,6, cartilage damage begins from the surface layer, spreading further into deeper layers. However, our study did not reveal changes in the T2 values in the surface layer with an increase in the degree of chondromalacia. It could be explained by inaccuracy of the correspondence of the analyzed layers to the histological ones, and nonuniformity of water distribution in between cartilage layers. Our superficial layer included the histological superficial zone and largest part of the transitional zone, while the intermediate and deep layers included predominantly the radial zone. Since collagen fibers in the transitional zone have an random orientation, the “magic angle” effect takes place here, which is one of the major sources of errors in T2 mapping.
In our study, compared with the whole cartilage assessment, this approach increased the sensitivity and specificity of chondromalacia staging by 17%. We believe that the performance of the model can be improved further by both increasing the accuracy of the T2 measurements and including T1ρ mapping in MRI examinations.
Conclusions
T2 mapping appears to be highly useful for staging chondromalacia severity. Considering the differences in water concentration, collagen matrix organization, and anisotropy in the different cartilaginous zones, the segmentation into layers can significantly increase the clinical efficiency of T2 mapping.Acknowledgements
This work is supported by RSF 21-75-00068 grant.References
1. Glaviano NR, Kew M, Hart JM, et al. DEMOGRAPHIC AND EPIDEMIOLOGICAL TRENDS IN PATELLOFEMORAL PAIN. Int. J. Sports Phys. Ther. 2015;10(3):281–290.
2. van Eck CF, Kingston RS, Crues J V, et al. Magnetic Resonance Imaging for Patellofemoral Chondromalacia: Is There a Role for T2 Mapping? Orthop. J. Sport. Med. 2017;5(11).
3. Soellner ST, Goldmann A, Muelheims D, et al. Intraoperative validation of quantitative T2 mapping in patients with articular cartilage lesions of the knee. Osteoarthr. Cartil. 2017;25(11):1841–1849.
4. Waldenmeier L, Evers C, Uder M, et al. Using Cartilage MRI T2-Mapping to Analyze Early Cartilage Degeneration in the Knee Joint of Young Professional Soccer Players. Cartilage. 2019;10(3):288–298.
5. Väätäinen U, Kiviranta I, Jaroma H, et al. Collagen crosslinks in chondromalacia of the patella. Int. J. Sports Med. 1998;19(2):144–148.
6. Mori Y, Kubo M, Okumo H, et al. Histological comparison of patellar cartilage degeneration between chondromalacia in youth and osteoarthritis in aging. Knee Surg. Sports Traumatol. Arthrosc. 1995;3(3):167–172.
Figures