4617
Knee Osteoarthritis: Automatic Grading with Deep Learning1Department of Imaging and Interventional Radiology, The Chinese University of Hong Kong, Sha Tin, NT, Hong Kong, 2School of Professional Education & Executive Development, The Hong Kong Polytechnic University, Kowloon, Hong Kong
Synopsis
We present a deep learning-based knee osteoarthritis grading system that automatically provides a binary classification for cartilage degeneration. The system was trained on MRI data sets applying MOAKS grading from the Osteoarthritis Initiative (OAI). The proposed method achieved an accuracy of 0.75 to 0.83, despite being conducted on highly imbalanced data sets. Significant improvement in accuracy is expected with more balanced data sets.
Introduction
Knee osteoarthritis (OA) is one of the most common degenerative musculoskeletal diseases globally1. Magnetic Resonance Imaging (MRI) has enabled knee OA to be viewed as a whole-organ disease leading to the development of multiple MRI-based OA assessment systems2. Semi-quantitative MRI OA assessment systems including Whole-Organ Magnetic Resonance Imaging Score (WORMS)3 and MRI Osteoarthritis Knee Scores (MOAKS)4 were developed in recent years. These systems grade OA features such as cartilage thickness, bone marrow oedema, osteophytosis, and meniscal pathology. Such grading assessments enable researchers and clinicians to investigate the association between structural change and OA progression2, improving the evaluation and treatment of OA. However, grading knee OA on MRI is too time-consuming for daily clinical use. Recent advances in artificial intelligence (AI) technology and the availability of large MRI datasets of knee OA have facilitated the development of automatic OA grading systems. Astuto et al. developed a classification pipeline based on hierarchical 3D Convolutional Neural Networks (CNN) to categorise OA severity5 based on WORMS grading on 3D Fast Spin Echo MRI. In this work, we report our work on the automatic classification of OA severity on MRI using the MOAKS grading system and a deep learning neural network.Methods
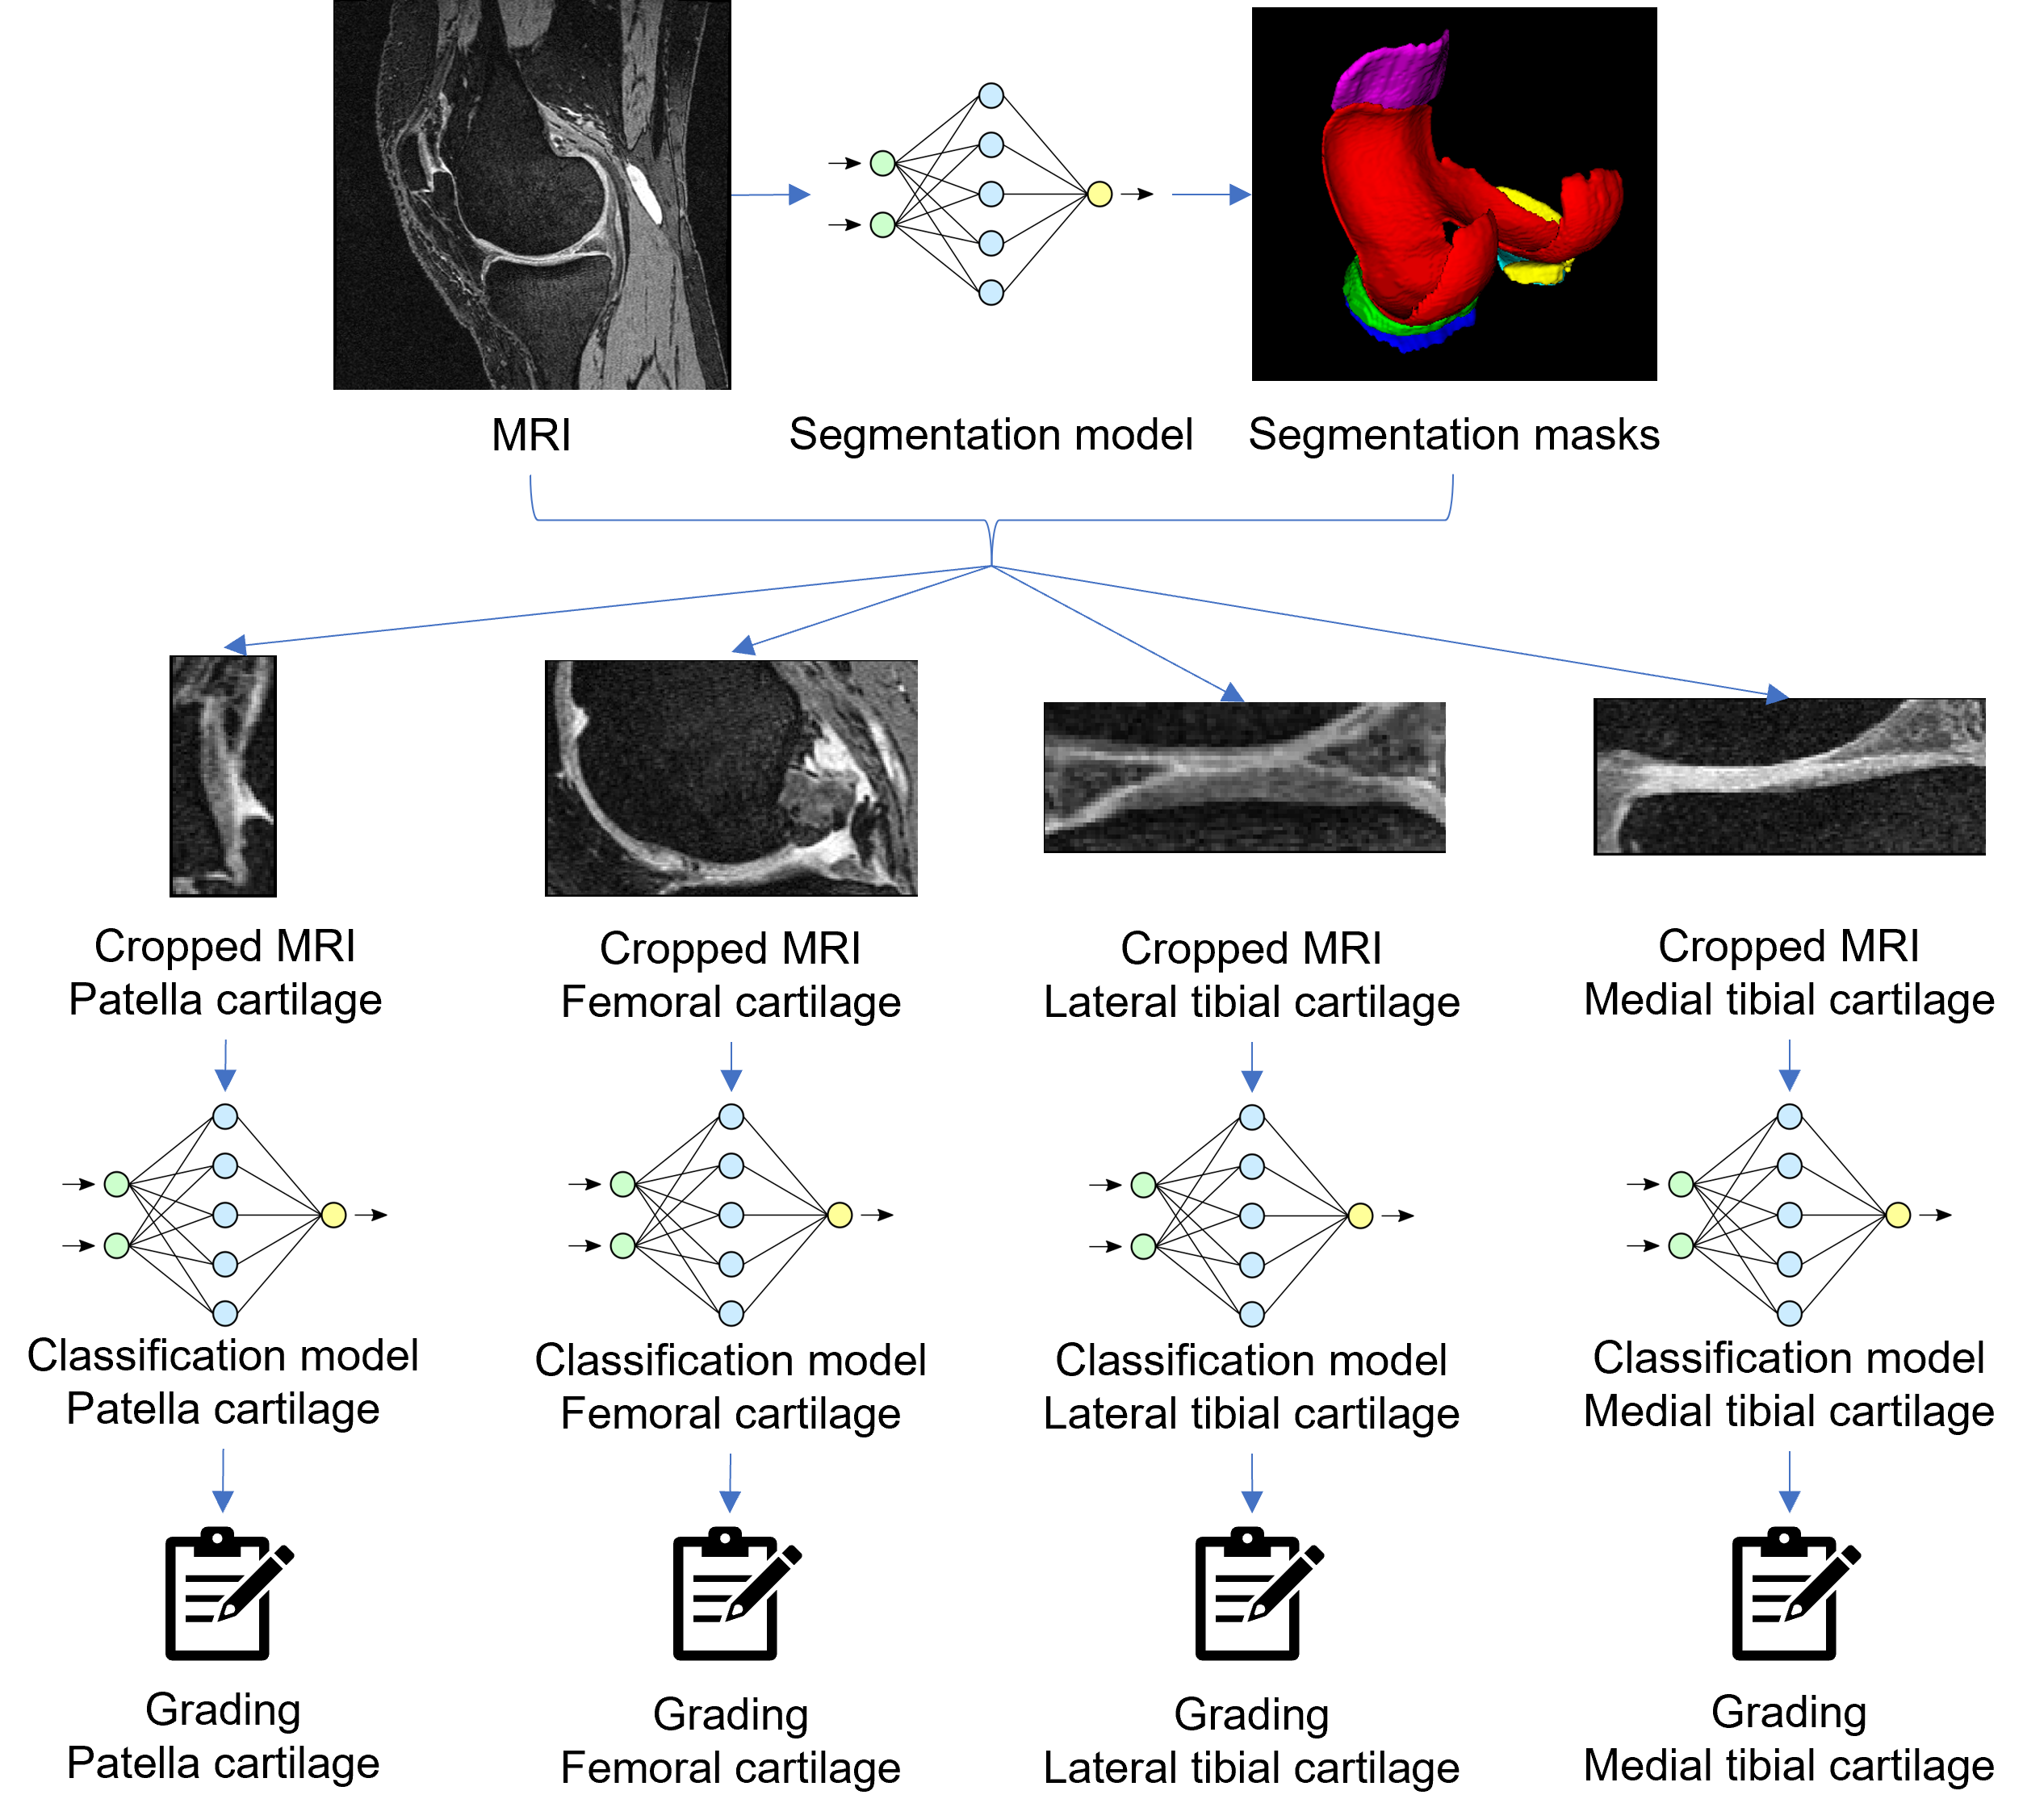
MRI datasets and MOAKS grade scores from the Osteoarthritis Initiative (OAI) were used. MRI data was acquired in the sagittal plane using 3D DESS at 3.0T. MOAKS cartilage scoring was undertaken by experienced MRI readers. MOAKS grading of patella cartilage (PC), femoral cartilage (FC), medial tibial cartilage (MTC), and lateral tibial cartilage (LTC) were independently used to prepare labels for deep learning classification. After cleaning invalid samples and removing duplicates, there were 2396 PC and FC, 2398 LTC, and 2399 MTC samples from 2020 patients, most of whom had both knees examined. For each cartilage area, datasets were randomly sampled to training, test, and validation sets in a ratio of 70%, 20% and 10% while keeping the original class-sample distribution unchanged. Figure 1 illustrates the pipeline of the proposed method. The deep learning pipeline consisted of two parts, segmentation and classification. A U-Net6 trained on 167 3D DESS data sets from the OAI (109, 38, and 28 samples for training, test, and validation respectively) was used to segment articular cartilage areas and the menisci. Segmentation masks were used to locate PC, FC, MTC and LTC and crop the 3D MRI images respectively (Figure 1). Classification tasks were conducted using four 3D DenseNet7 CNN models that performed binary classification on each cartilage area. The binary classification task classifies whether the subject is healthy (all MOAKS subgrades = 0) or not (any MOAKS subgrade > 0). Classification was done by two variants of DenseNets, i.e., DenseNet 121 and DenseNet 169, which have an identical structure except that DenseNet 169 has a larger model size. Results from these models were used to demonstrate the impact on performance of various model sizes.Results
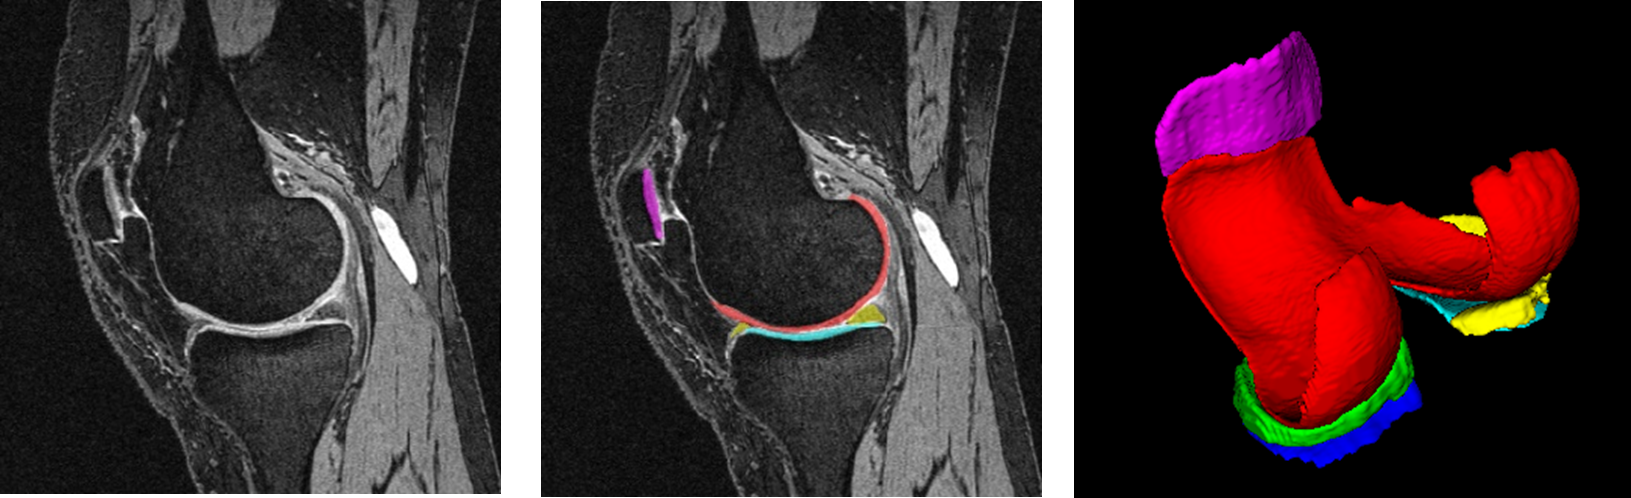
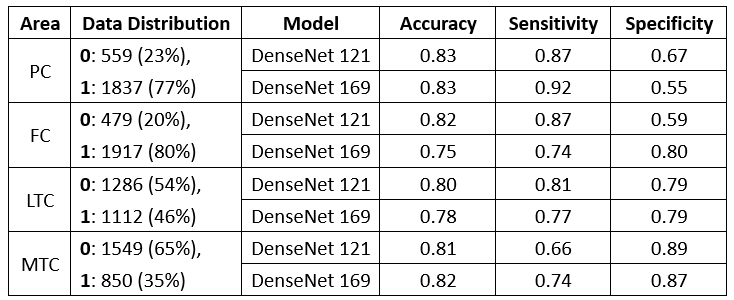
Figure 2 shows a typical segmentation result using our approach. The segmentation model achieved a state-of-the-art performance with an average Dice Similarity Coefficient (DSC) of 0.86 among all six classes on the test set. Classification models achieved accuracy, sensitivity, and specificity ranging from 0.75 to 0.83, 0.66 to 0.92, and 0.55 to 0.89, respectively. Figure 3 shows the performance metrics of the two classification models and the distribution of articular cartilage degeneration.Discussion
We present an automation solution to grade OA severity of knee joint articular cartilage with promising preliminary results. It was noteworthy that the advanced variant DenseNet 169 did not show a consistent improvement compared to DenseNet 121 in our experiments.The performance of the LTC was better than PC, FC, and MTC. This is most likely due to the data distribution of PC, FC, and MTC being highly unbalanced whereas LTC has a more balanced data distribution. Further work is needed to address these data imbalance issues.
We used a simplified binary classification approach in this work. It is more clinically relevant to grade cartilage degeneration using the severity of cartilage thickness loss4. Coupled with the issue of unbalanced data distribution, multi-class grading based on deep learning methods is a challenging task. It may be helpful to apply machine-friendly grading systems such as phenotyping8 or divide one multi-class problem into multiple binary problems5 to address this problem.
We only included articular cartilage in this study. MRI provides a more whole-organ assessment of OA. Other OA features will be introduced to this automated OA grading in the future.
Conclusion
We proposed an automatic MRI knee OA grading solution based on advanced AI technologies with promising preliminary results. This system has the potential to reduce workload in OA diagnosis and assessment particularly with regarding to large scale research studies. Further work is needed to validate this.Acknowledgements
This study was supported by a grant from the Innovation and Technology Commission of the Hong Kong SAR (Project MRP/001/18X), and a grant from the Research Grants Council of the Hong Kong SAR (Project SEG CUHK02).
References
1. James SL, Abate D, Abate KH, et al. Global, regional, and national incidence, prevalence, and years lived with disability for 354 diseases and injuries for 195 countries and territories, 1990–2017: a systematic analysis for the Global Burden of Disease Study 2017. The Lancet. 2018;392(10159):1789-1858. doi:10.1016/S0140-6736(18)32279-7
2. Roemer FW, Guermazi A, Demehri S, Wirth W, Kijowski R. Imaging in Osteoarthritis. Osteoarthritis Cartilage. Published online September 22, 2021. doi:10.1016/j.joca.2021.04.018
3. Peterfy CG, Guermazi A, Zaim S, et al. Whole-Organ Magnetic Resonance Imaging Score (WORMS) of the knee in osteoarthritis. Osteoarthritis Cartilage. 2004;12(3):177-190. doi:10.1016/j.joca.2003.11.003
4. Hunter DJ, Guermazi A, Lo GH, et al. Evolution of semi-quantitative whole joint assessment of knee OA: MOAKS (MRI Osteoarthritis Knee Score). Osteoarthritis Cartilage. 2011;19(8):990-1002. doi:10.1016/j.joca.2011.05.004
5. Astuto B, Flament I, Nikan K. N, et al. Automatic Deep Learning-assisted Detection and Grading of Abnormalities in Knee MRI Studies. Radiol Artif Intell. 2021;3(3):e200165. doi:10.1148/ryai.2021200165
6. Ronneberger O, Fischer P, Brox T. U-Net: Convolutional Networks for Biomedical Image Segmentation. Med Image Comput Comput-Assist Interv Pt Iii. 2015;9351:234-241. doi:10.1007/978-3-319-24574-4_28
7. Huang G, Liu Z, Van Der Maaten L, Weinberger KQ. Densely Connected Convolutional Networks. In: 2017 IEEE Conference on Computer Vision and Pattern Recognition (CVPR). IEEE; 2017:2261-2269. doi:10.1109/CVPR.2017.243
8. Namiri NK, Lee J, Astuto B, et al. Deep learning for large scale MRI-based morphological phenotyping of osteoarthritis. Sci Rep. 2021;11(1):10915. doi:10.1038/s41598-021-90292-6
Figures