4615
Feasibility of synthetic PD-weighted images on degenerative OA in comparison to structural ZTE-MRI1Department of Radiology, Taihe Hospital, Jinzhou Medical University Union Training Base, Shiyan,Hubei, China, 2GE Healthcare, Beijing, China, 3Biomedical Engneering College,Hubei University of Medicine, Shiyan,Hubei, China, 4Department of Radiology, Taihe Hospital, Hubei University of Medicine, Shiyan,Hubei, China
Synopsis
Image follow-up for intervention effectiveness of osteoarthritis is necessary to avoid or slow down the development of joint space stenosis, bone sclerosis and osteophyte formation. Compared to ZTE-MRI with the feature of nominal zero echo time, MAGIC, synthetic MRI, offers not only anatomical structure images but also T1, T2, and PD maps. We found a significant correlation between joint space value and meniscus volume in reflection of antagonism effect of joint space and surrounding tissues. Proton density weighted synthetic MR images (PD-MAGIC) offered as good as ZTE-MR structure images and might supplement quantitative information clinically to improve follow-up diagnostic performance.
Introduction
Osteoarthritis (OA) is one of the most common forms of arthritis[1] and most often occurs in knee, leading to disability in middle-aged and elderly people. In the middle and late stages, joint space stenosis, bone sclerosis, osteophyte formation and cystic changes gradually develop[2]. It is essential to have clinical examination methods that can diagnose and evaluate the severity of lesions early and accurately. Moreover, an image follow-up for intervention effectiveness of osteoarthritis is necessary to avoid or slow down the development of lesions. A novel ZTE-MRI is characterized by nominal zero echo time so as to capture short T2* signals in better display of bone membrane and cortical bone as CT-like images[3] whereas MAGiC, synthetic MRI, offers not only anatomical structure images but also T1 relaxation time (T1 map), T2 relaxation time (T2 map) and proton density (PD map). Therefore, our study aimed to explore feasibility of MAGiC on OA particularly in comparison with structural ZTE-MR images.Materials and methods
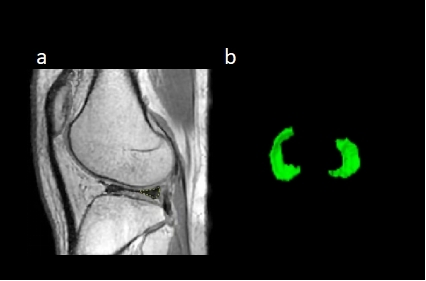
A total of 13 patients with diagnosed osteoarthritis (7/6 males/females) at the average of 44 years were included in this study. All participants underwent MAGiC ((TR=4000, TE=13.2, NEX = 1, voxel size = 0.8 ×0.8×0.8 mm2) and ZTE imaging (TR= 4000, FA= 3, NEX = 2, spokes per segment = 288, voxel resolution = 1 ×1×1 mm2) on 1.5T MR scanner (Signa Voyager, GE Healthcare). PD, T1, T2 values were drawn on meniscus as a ROI was drawn on proton density weighted images from (PD-MAGiC) shown in Figure 1. Meniscus volume and maximum joint space length were measured on PD-MAGIC and ZTE-MRI. Repeated measurements were performed by one radiologist two weeks later. Intra-modality, inter-modality and intra-observer agreements were tested by Intraclass correlation coefficient (ICC). Pearson correlation or Spearman’s rho correlation was used to explore the correlation between alterations of meniscus structure and function, depending on use of non-continuous variables. The classification standard for meniscus injury is formulated by Stoller et al.[4] as follows: Grade 0, regular meniscus shape and uniform signal; Grade 1, focal round or speckled high signal of the meniscus does not reach the articular surface of itself; Grade 2, linear and horizontal high signals of the meniscus extend to the joint capsule margin; Grade 3: high signals of the meniscus reach the joint edge.Results
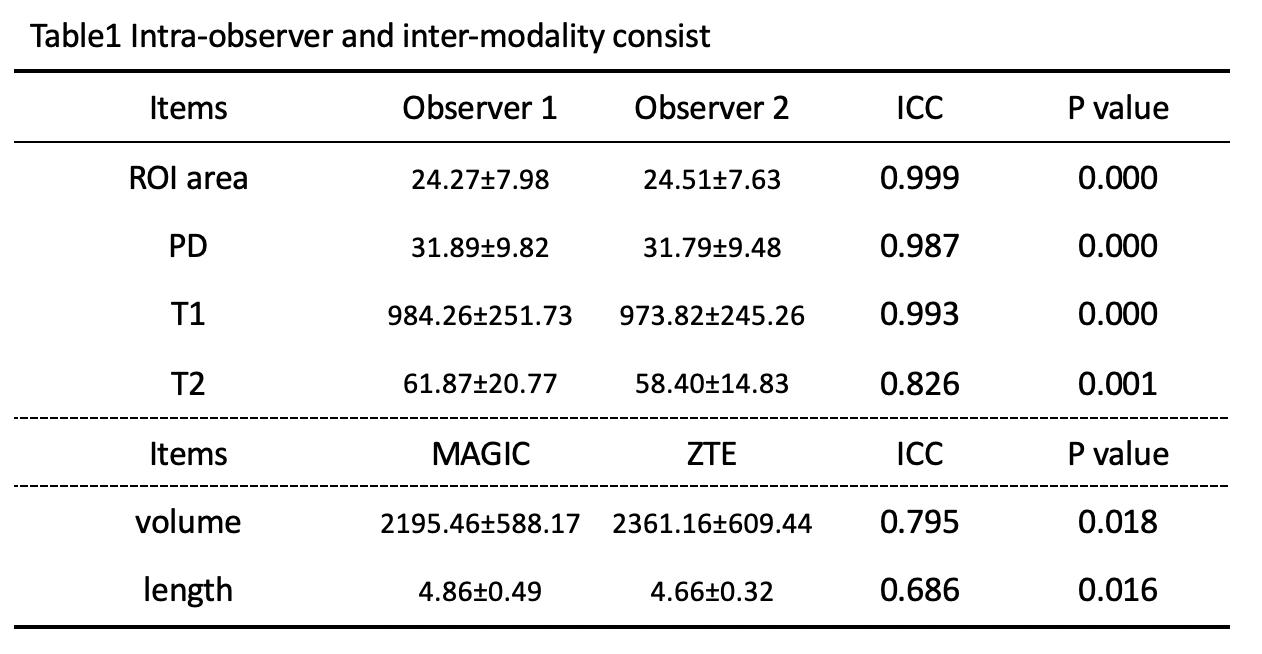
Intra-observer consistency of measurements, including ROI area, PD, T1, and T2 values were highly correlated shown in Table 1. Good intra-modality consistency of meniscus volume and maximum joint space length drawn on PD-MAGIC and ZTE images was found (ICC = 0.795, P = 0.018; ICC = 0.462, P = 0.06) shown in Table 1. The maximum meniscus area was significantly correlated with the volume measured on MAGIC and ZTE sequences (r = 0.879, P = 0.004; r = 0.733, p= 0.039), respectively. Both meniscus volume and joint space length measured on MAGIC sequence was not correlated with the degree of meniscus injury (p>0.95). The maximum joint space length was negatively correlated with meniscus volume measured on ZTE sequence and PD-MAGiC (-0.706, P = 0.05; -0.787, P = 0.04), but not correlated with age and degree of meniscus injury (p>0.05). There was also no correlation between degree of meniscus injury and age, T1, T2 and PD values (p>0.05).Discussion
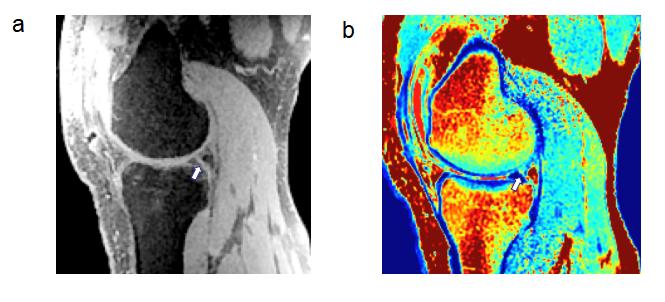
MAGiC provides not only structure abnormality as good as ZTE-MRI but also tissue alterations in early OA[5] even no significant difference of T1, T2, and PD values in our study.Representative ZTE-MRI and MAGIC PD map showed a 46-year-old male patient with meniscus injury (Figure 2).We found a significant correlation between joint space value and meniscus volume in reflection of antagonism effect of joint space and surrounding tissues. Three-dimensional volume acquisition and less partial volume effect might contribute to good correlation between length and volume for ZTE but not for MAGiC. This may also cause only moderate intra-modality for length and volume. There was no correlation between degree of meniscus injury and joint space value/ meniscus volume/T1/T2/PD values. This might attribute to small sample size and patients with mild OA in our study in spite that many studies suggested T2 values changes as edema and tissue swollen and T1 values changes as fibrosis formation[6].Conclusions
MAGiC is a time-saving imaging sequence for knee MR examination, providing routine weighted images with and without fat saturation, etc. PD-MAGiC offered as good as structure ZTE-MR images and might supplement quantitative information such as T1, T2, PD values clinically as well as improve follow-up diagnostic performance and screening for arthroscopic surgery indications.Acknowledgements
I would like to express my gratitude to all those who have helped me during the writing of this abstract. I gratefully acknowledge the help of my supervisor Professor Wen Chen. I do appreciate his patience, encouragement,and professional instructions during my abstract writing.Also,I would like to thank Weiyin Vivian Liu, for her instructive advice and useful suggestions on my abstract.I am deeply grateful of her help in the completionof this abstract.I am also deeply indebted to all the other tutors and teachers in this study for their direcct or indirect help to me.Last but not the least,my gratitude also extends to my parents for their continuous support and encouragement all of my life.References
[1]. Mobasheri, A. and M. Batt, An update on the pathophysiology of osteoarthritis. Annals of Physical and Rehabilitation Medicine, 2016. 59(5-6): p. 333-339.
[2]. Yunus, M.H.M., A. Nordin and H. Kamal, Pathophysiological Perspective of Osteoarthritis. Medicina, 2020. 56(11): p. 614.
[3]. Lee, C., et al., CT-like MRI using the zero-TE technique for osseous changes of the TMJ. Dentomaxillofacial Radiology, 2020. 49(3): p. 20190272.
[4]. De Smet, A.A., How I diagnose meniscal tears on knee MRI. American journal of roentgenology (1976), 2012. 199(3): p. 481.
[5]. Lahm, A., et al., Changes in content and synthesis of collagen types and proteoglycans in osteoarthritis of the knee joint and comparison of quantitative analysis with Photoshop-based image analysis. Arch Orthop Trauma Surg, 2010. 130(4): p. 557-64.
[6]. Zhu, J., et al., T2 mapping of cartilage and menisci at 3T in healthy subjects with knee malalignment: initial experience. Skeletal Radiology, 2019. 48(5): p. 753-763.
Figures