4614
Comparison of time-encoded and sequential variable-TR scheme for multi-delay pseudo-continuous arterial spin labeling1Philips Japan, Tokyo, Japan, 2Department of Molecular Imaging and Diagnosis, Graduate School of Medical Sciences,, Kyushu University, Fukuoka, Japan, 3C.J. Gorter center for high field MRI, department of Radiology,, Leiden University Medical Center, Leiden, Netherlands, 4Division of Radiology, Department of Medical Technology,, Kyushu University Hospital, Fukuoka, Japan, 5Philips Healthcare, Best, Netherlands, 6Philips Healthcare, Tokyo, Japan
Synopsis
There are two approaches proposed to calculate cerebral blood flow (CBF) and arterial transit time (ATT) accurately, while ensuring sufficient SNR. One is time-encoded (TE) and the other is sequential variable-TR (vTR) pseudo-continuous arterial spin labeling (PCASL). In this study, we measured SNR, CBF, and ATT from these two methods and compared and verified their validity in 5 healthy subjects. The higher SNR was secured in TE-PCASL compared to vTR-PCASL. On the other hand, ATT calculated from vTR-PCASL showed higher correlation coefficient with reference compared with TE-PCASL. The CBF calculated from both schemes showed high correlation coefficient with reference.
INTRODUCTION
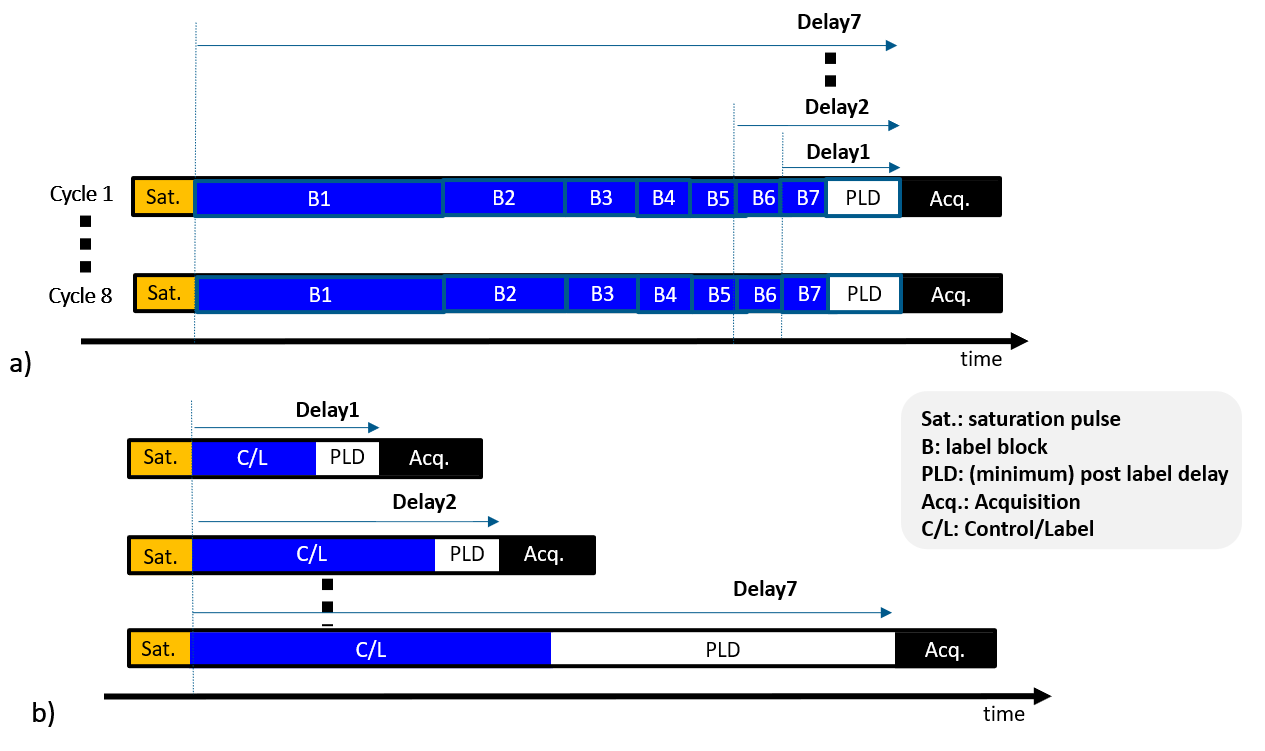
The arterial transit time (ATT) calculated from a multi-delay scheme can be clinically useful in addition to cerebral blood flow (CBF) in neuro vascular disease.1-6 There are two approaches proposed for time-efficient multi-delay PCASL acquisitions.One method is time-encoded (TE) ASL,7-9 which divides PCASL labeling into a series of blocks encoded as either labels or controls in different combinations across acquisition series, based on e.g., a Hadamard encoding matrix. This is a time-efficient approach, as it requires only N+1 acquisition series for calculation of N timepoints, instead of the 2N minimum required in a standard ASL scheme. In addition, the combination of signal addition or subtraction over a series of images provides noise-averaging effects, leading to √((N+1)/2) times improved SNR compared to traditional multi-delay PCASL with same label-durations (LD), post label delays (PLD), and repetition time (TR). However, since the LD is split into blocks, there are stringent constraints on the possible combinations of LD and PLD.
The second time-efficient approach is sequential multi-delay combined with a variable-TR (vTR) scheme.10,11 Multi-delay acquisition involves changing LD and PLD dynamically, with TR always minimized, so that scanning efficiency is optimal. This scheme allows the setting of any LD or PLD, without limitations, however SNR gains can only be obtained by increasing the number of averages. The purpose of this study was to compare two schemes and verify their validity.
METHODS
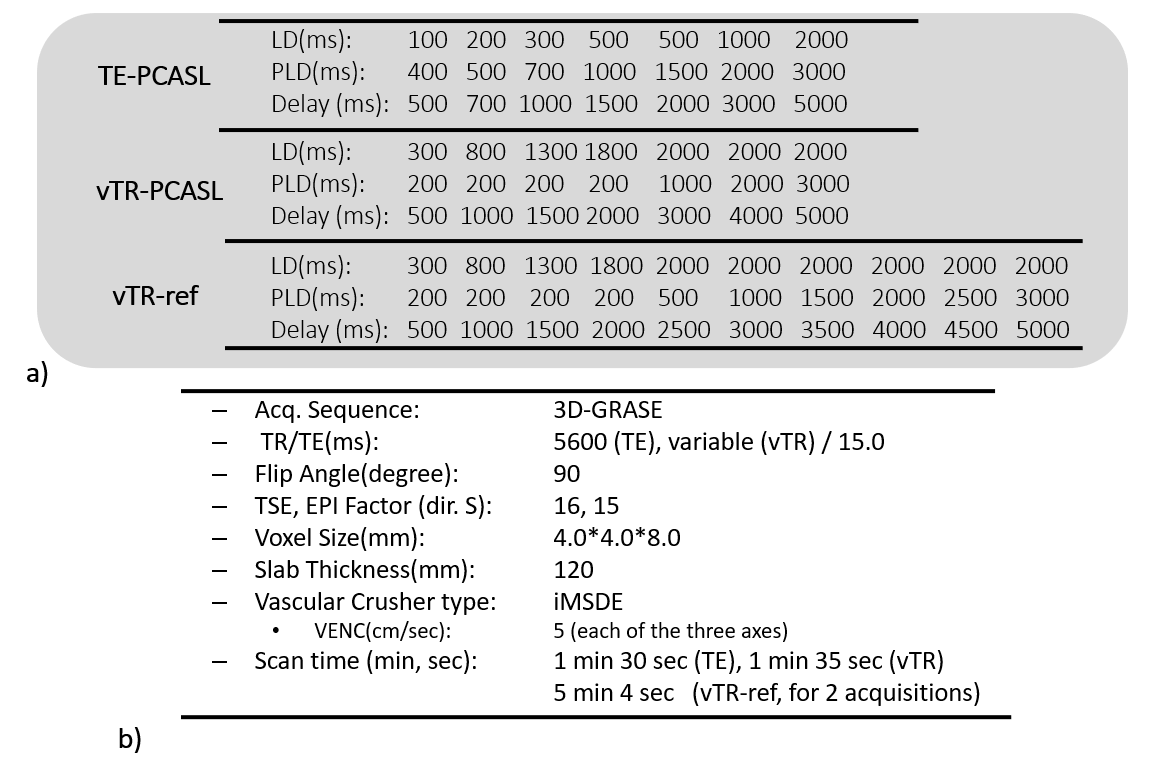
TE- and vTR- multi-delay PCASL schemeThe multi-delay TE-PCASL and vTR-PCASL are illustrated in Figure 1a and b, both with seven multi-delay schemes. In the TE-PCASL, acquisitions were cycled eight times, setting block lengths accordingly to obtain the desired PLDs. In the vTR-PCASL, the dynamic ASL data were acquired by changing LD and PLD. Seven pairs of control and label acquisitions, in total fourteen acquisitions are necessary. For both schemes, four inversion pulses were inserted for background suppression (BGS). For vTR-PCASL, the BGS timing was optimized dynamically according to the variable delay time.10
Magnetic Resonance (MR) Experiments
The TE-PCASL and vTR-PCASL were implemented on a 3.0T Ingenia Elition scanner (Philips, Best, The Netherlands). The actual LDs and PLDs used in this study are illustrated in Figure 2a. The M0 was acquired separately. For reference data, a ten multi-delay vTR-PCASL scheme, called vTR-ref, was also acquired with two signal averages. Detailed sequence parameters are summarized in Figure 2b. Five healthy subjects (mean age 37.2±8.7 years) were examined. Informed consent, as required by the Institutional Review Board, was obtained from all volunteers.
ATT and CBF quantification and region mask
From the multi-delay ASL data, CBF and ATT maps were created. The general kinetic model of Buxton12 was used for the calculation by applying a nonlinear fitting. For the data evaluation, brain and gray matter masks were created using SPM12 (Wellcome Trust Center for Neuroimaging, London, UK).13
SNR evaluation
To be able to calculate the temporal SNR, multi-delay acquisition was repeated two times for tested schemes. In the first multi-delay series, ASL subtraction was conducted and the three highest signals over the multi-delays were selected and averaged. For the noise calculation, control images of the first and second acquisition were subtracted and standard deviation (SD) of residual signals over the multi-delays was calculated. The SNR was calculated by dividing the averaged ASL signal by the SD. The SNR over the GM mask was calculated and compared between two schemes.
ATT and CBF validations
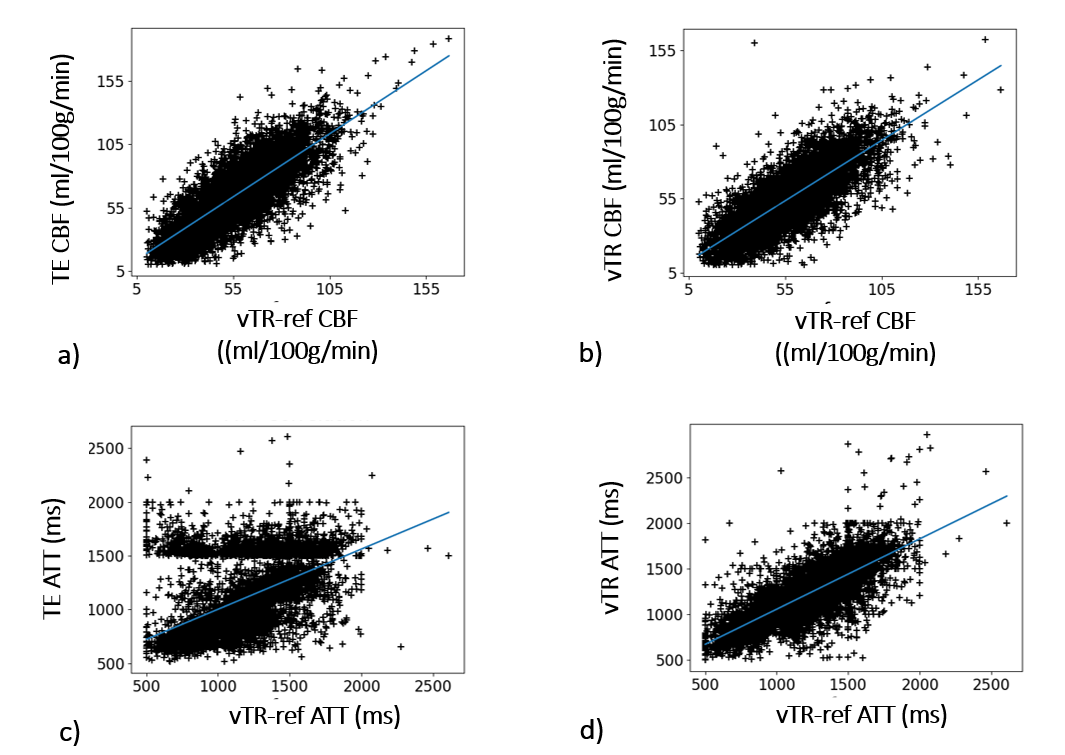
The ATT and CBF calculated by each scheme were compared with that calculated from vTR-ref scheme by measuring correlation coefficient (CC) of scatter plot of all voxels at brain mask. This CC was measured subject by subject and compared between TE-PCASL and vTR-PCASL.
RESULTS and DISCUSSION
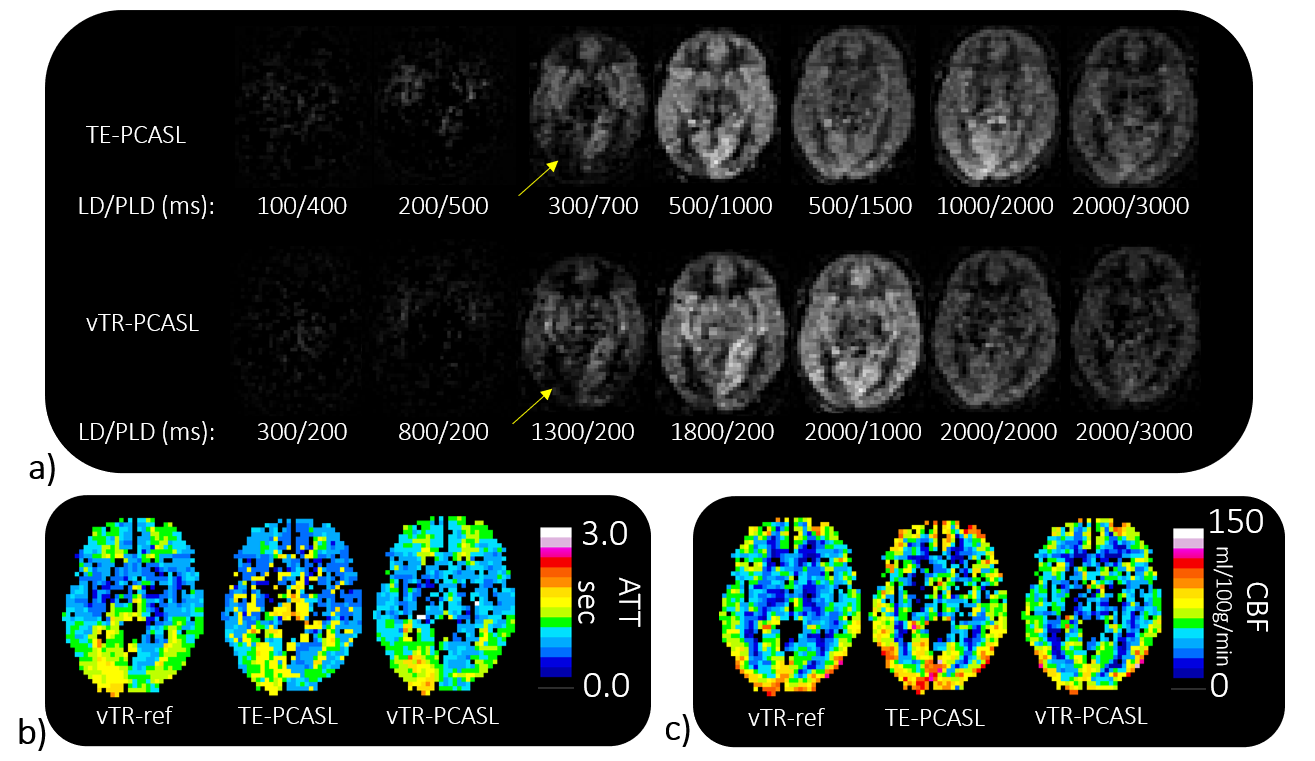
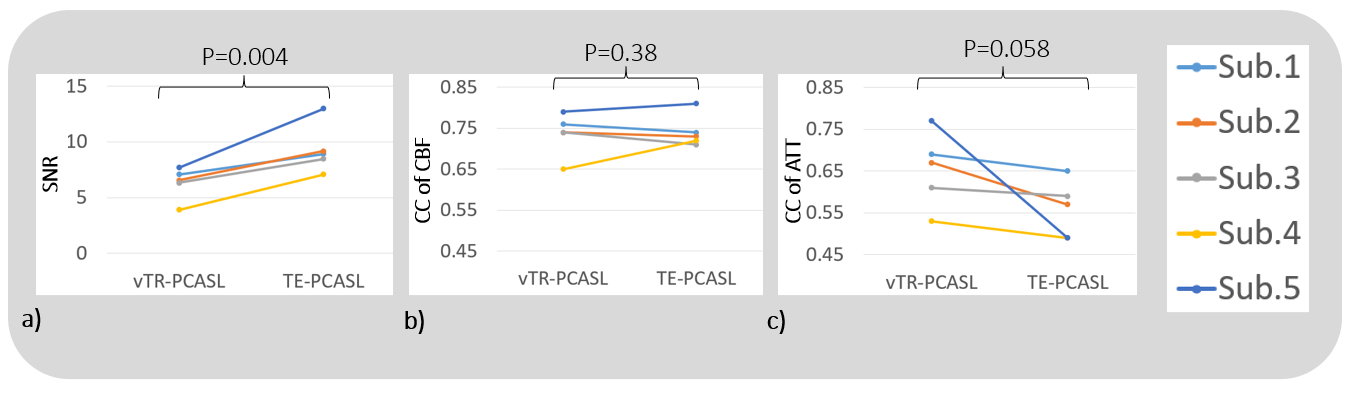
Representative ASL multi-delay images for TE- and vTR-PCASL are shown in Figure 3a and the corresponding ATT and CBF maps are shown in b and c, comparing with vTR-ref.The SNR, CC of CBF and CC of ATT comparisons were shown in Figure 4. In TE-PCAL, although LDs were shorter than that of vTR-PCASL (except for the last delay point), expecting an impact on SNR, actually the SNR in TE-PCASL was significantly higher than that in vTR-PCASL (P=0.004). Both schemes showed high CC for CBF, higher than 0.7 in average, suggesting reliability of both schemes in CBF quantification. In CC for ATT, vTR-PCASL is higher than that of TE-PCASL in all subjects (p=0.058).
Figure 5 shows a representative scatter plot of CBF and ATT in subject 5. For CBF, high correlation was shown in both schemes. On the other hand, low correlation was shown in ATT of TE-PCASL. It suggests vTR-PCASL with evenly distributed multi-delay timepoints is advantageous for reliable ATT measurement. In clinical applications however, especially for neurovascular disease, it is expected that ATT is significantly longer than normal subjects, so further clinical investigation of the two schemes is necessary.
CONCLUSION
TE-PCASL exhibits higher SNR than vTR-PCASL, whereas vTR-PCASL outperforms TE-PCASL for ATT measurements. However, as this is the result for healthy volunteers, further clinical evaluation is required.Acknowledgements
No acknowledgement found.References
1. Shota Ishida, Hirohiko Kimura, Makoto Isozaki et al. Robust arterial transit time and cerebral blood flow estimation using combined acquisition of Hadamard-encoded multi-delay and long-labeled long-delay pseudo-continuous arterial spin labeling: a simulation and in vivo study. NMR Biomed. 2020;33(8):e4319.
2. Joseph G Woods, Michael A Chappell, Thomas W Okell. A general framework for optimizing arterial spin labeling MRI experiments. Magn Reson Med 2019;81(4):2474.
3. H J Choi, C-H Sohn, S-H You et al. Can Arterial Spin-Labeling with Multiple Postlabeling Delays Predict Cerebrovascular Reserve?. AJNR Am J Neuroradiol. 2018;39(1):84.
4. Peter Jezzard, Michael A Chappell, Thomas W Okell. Arterial spin labeling for the measurement of cerebral perfusion and angiography. J Cereb Blood Flow Metab 2018;38(4):603.
5. Jia Guo, Samantha J Holdsworth et al. Comparing accuracy and reproducibility of sequential and hadamard-encoded multidelay pseudocontinuous arterial spin labeling for measuring cerebral blood flow and arterial transit time in healthy subjects: A simulation and in vivo study. J Magn Reson Imaging. 2018;47(4):1119.
6. Sven Haller, Greg Zaharchuk, David L Thomas et al. Arterial Spin Labeling Perfusion of the Brain: Emerging Clinical Applications. Radiology. 2016;281(2):337.
7. Weiying Dai, Ajit Shankaranarayanan, David C Alsop. Volumetric measurement of perfusion and arterial transit delay using hadamard encoded continuous arterial spin labeling. Magn Reson Med 2013;69(4):1014.
8. Jack A Wells, Mark F Lythgoe, David G Gadian et al. In vivo Hadamard encoded continuous arterial spin labeling (H-CASL). Magn Reson Med 2010;63(4):1111.
9. Gunther M. Highly efficient accelerated acquisition of perfusion inflow series by cycled arterial spin labeling. In Proceedings of the 15th Annual Meeting of ISMRM, Berlin, Germany 2007;:380.
10. Makoto Obara, Osamu Togao, Tatsuhiro Wada et al. Pseudo-continuous arterial spin labeling using multiple label- and post-label duration with dynamically optimized background suppression. In Proceedings of the Annual Meeting of ISMRM 2021;870.
11. Megan E Johnston, Kun Lu, Joseph A Maldjian et al. Multi-TI Arterial Spin Labeling MRI with Variable TR and Bolus Duration for Cerebral Blood Flow and Arterial Transit Time Mapping. IEEE Trans Med Imaging 2015;34(6):1392.
12. R B Buxton, L R Frank, E C Wong et al. A general kinetic model for quantitative perfusion imaging with arterial spin labeling. Magn Reson Med. 1998;40(3):383.
13. J Ashburner KJF. Voxel-based morphometry—the methods. Neuroimage 2000;11(6 Pt 1):805.
Figures