4609
Towards clinical perfusion imaging at 5T using 3D ASL1Shenzhen United Imaging Research Institute of Innovative Medical Equipment Innovation Research, Shenzhen, China, 2United Imaging Healthcare, Shanghai, China
Synopsis
Arterial spin labeling (ASL) benefits from both increased intrinsic SNR and reduced T1 relaxation time at higher field strength. However, the implementation of ASL at 7T is challenging, primarily due to increased SAR, and B1+/B0 inhomogeneity. Recently, United Imaging Healthcare introduced a 5T whole-body scanner. 5T might be a superior field strength for ASL due to the improved SNR compared to 3T, and less severe B1+/B0 inhomogeneity and reduced SAR compared to 7T. This study demonstrated the feasibility of high-resolution ASL at 5T, and the results showed superior SNR compared to 3T.
Introduction
Arterial spin labeling (ASL) benefits from both increased intrinsic SNR and reduced T1 relaxation time at higher field strength. However, the implementation of ASL at 7T is challenging, primarily due to increased specific absorption rate (SAR), and B1+/B0 inhomogeneity at higher field strength [1]. More pronounced B1+/B0 inhomogeneity decreases the labeling efficiency, and higher SAR reduces the permitted labeling amplitude and/or duration. Early 7T ASL studies overcame these challenges either by using electric pads to increase the B1+ efficiency [2], or by placing the labeling plane in the brain (and therefore limiting the imaging volume) [3]. Parallel transmission (pTx) has been used to improve the labeling efficiency of the pseudo-continuous ASL (PCASL) [4-6] by playing out different waveforms in different transmit channels. However, despite these advances, ASL is not routinely used at ultra-high field. Recently, United Imaging Healthcare introduced a 5T whole-body scanner. 5T might be a superior field strength for ASL due to the improved SNR compared to 3T, and less severe B1+/B0 inhomogeneity and reduced SAR compared to 7T. This study presents preliminary ASL results at 5T and aims to demonstrate the feasibility of high-resolution ASL at this field strength.Methods
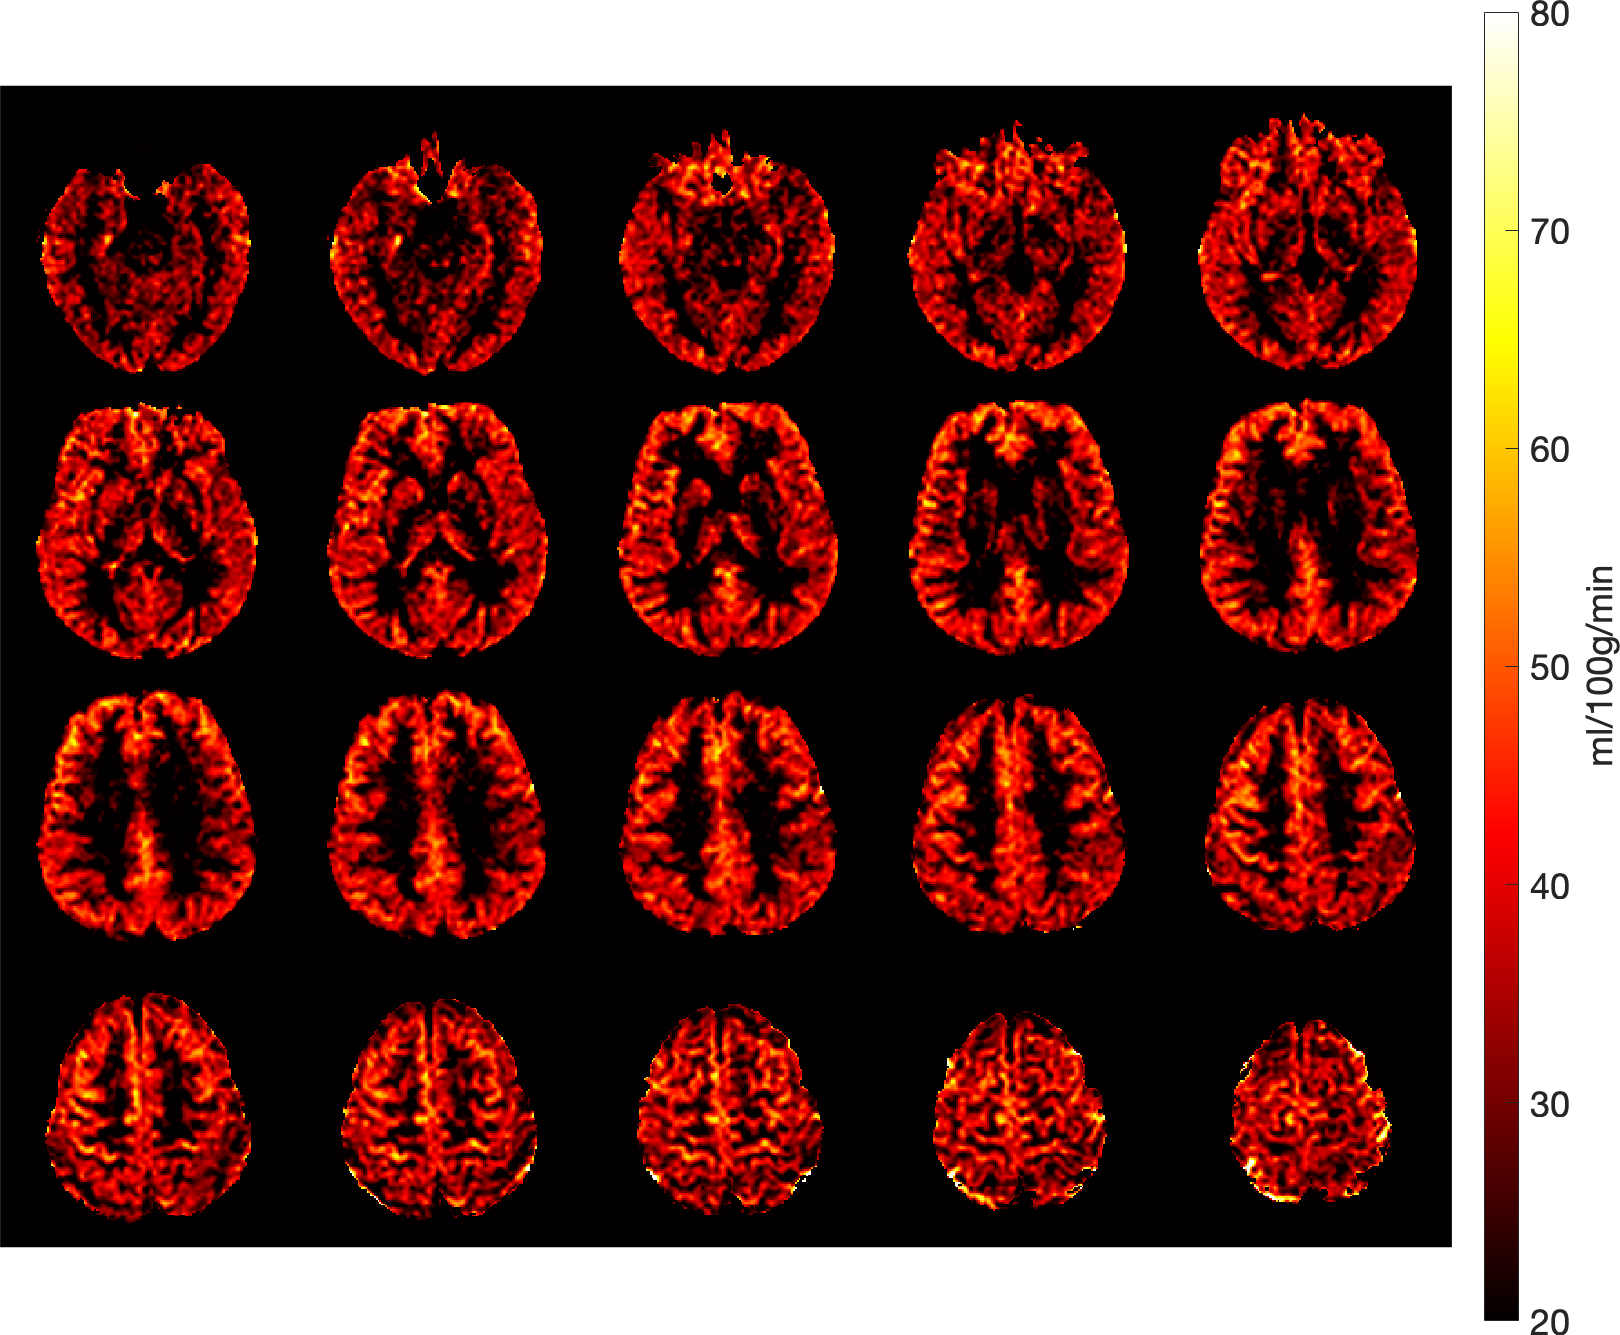
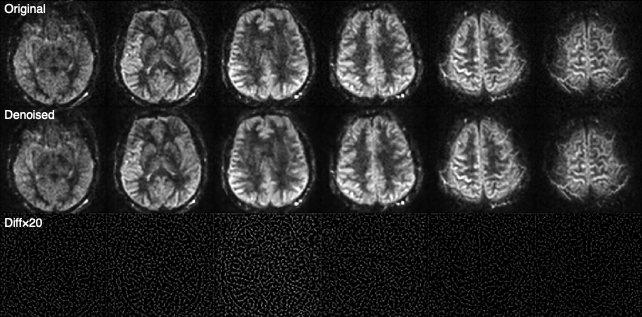
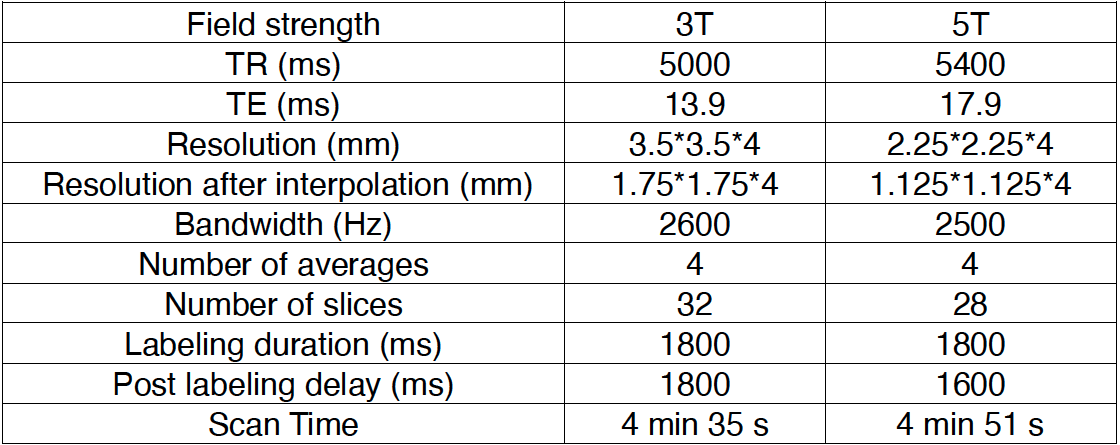
Images were acquired on one healthy volunteer (male, 37 years old) on a United Imaging Healthcare (Shanghai, China) Jupiter 5.0 T scanner using 2-channel transmit 48-channel receive head coil was used. The same subject was scanned on a United Imaging Healthcare uMR770 3.0T scanner for comparison. All experiments were performed under the written consent of the volunteer. A time-of-flight angiography was used to select the labeling plane. The acquisition parameters of the PCASL sequenced used in this study was shown in Table 1. The total scan time and brain coverage of 3D ASL were adapted to clinical settings. Cerebral blood volume (CBF) was calculated based on the method by Buxton et al. [7]. The blood T1 at 5T was assumed to be 1850 ms for CBF calculations, based on Equation 4 from the work by Zhang et al., derived from linear fitting of measured blood T1 values at 1.5T, 3T and 7T [8]. A total generalized variation (TGV) based denoising algorithm, similar to the approach by Spann et al. [9], was applied on the 5T data to improve the image quality.Results
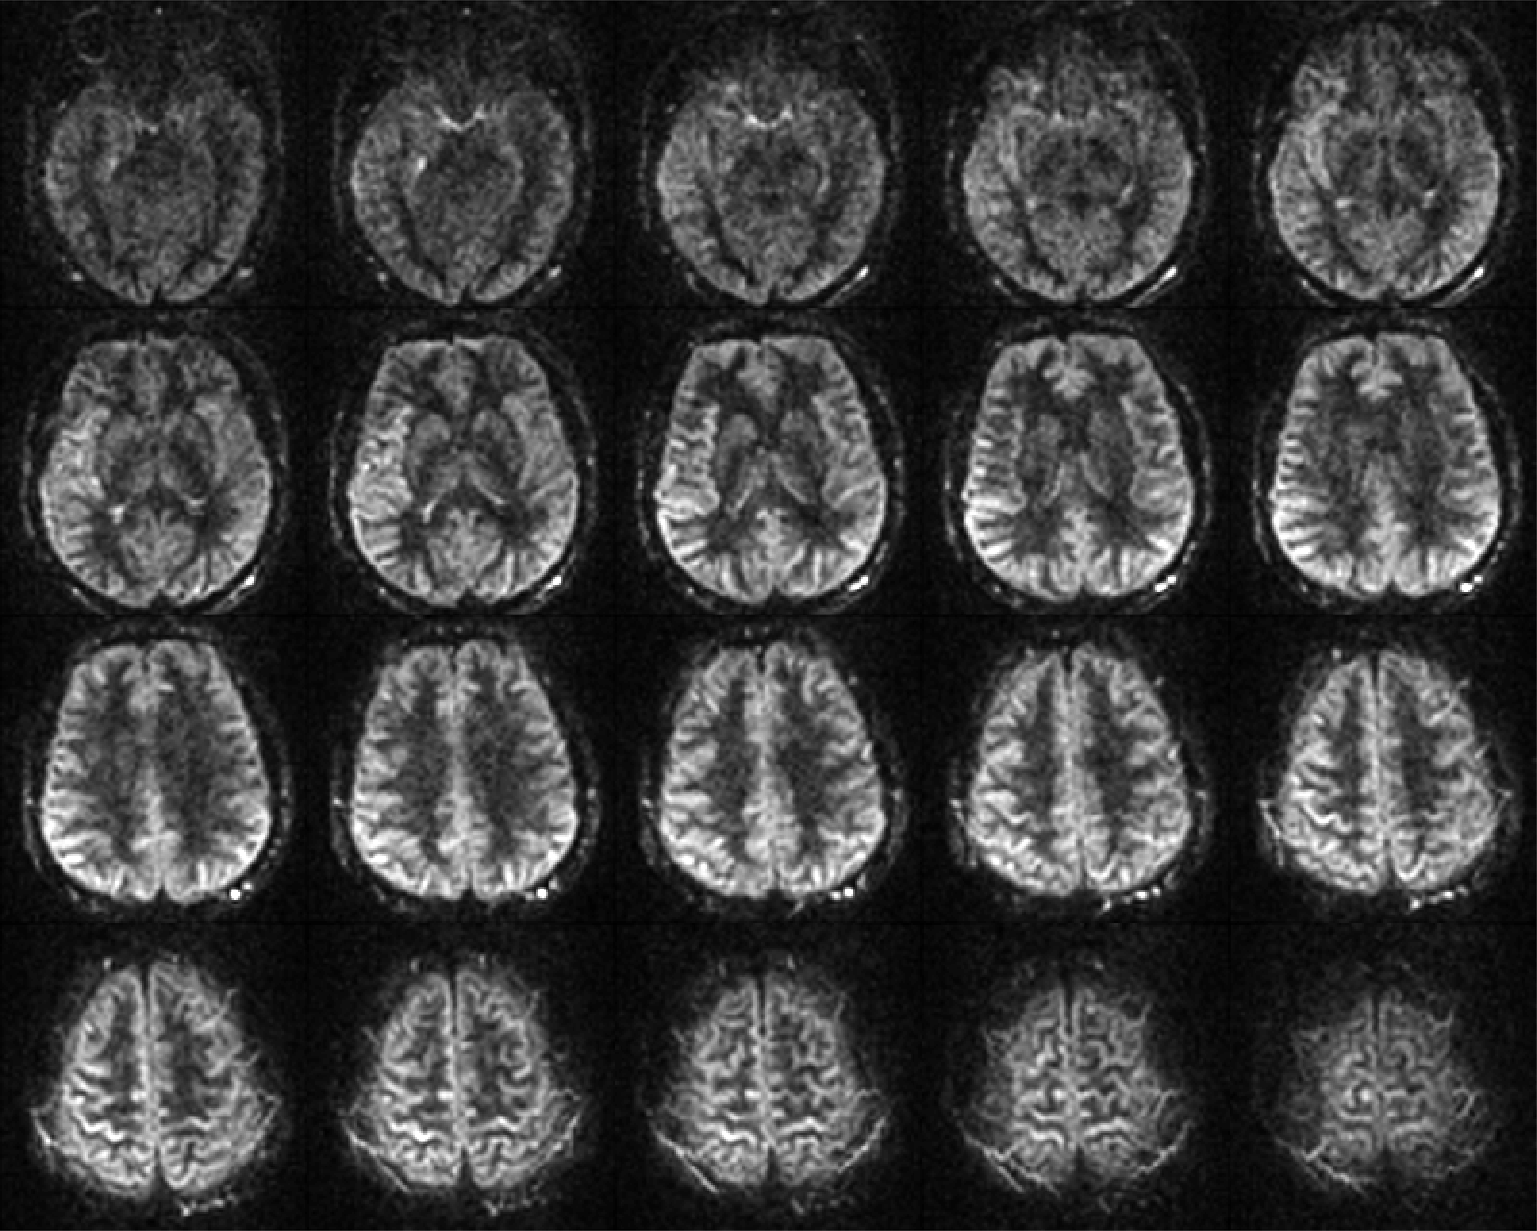
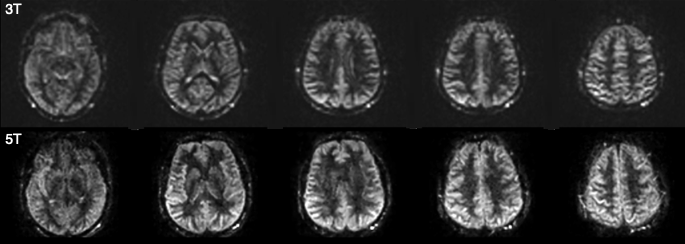
Perfusion-weighted images with whole brain coverage at 5T were shown in Figure 1. CBF maps were shown in Figure 2, and measured values were comparable to those reported in the literature [10]. A head-to-head comparison between 3T and 5T perfusion-weighted images was shown in Figure 3, which also showed improved image quality at 5T with a higher resolution. Additionally, TGV denoising (shown in Figure 4) further improved image SNR of the 5T data.Discussions
The high-resolution perfusion-weighted images acquired at 5T showed superior image quality compared to those acquired at 3T with a resolution commonly used in a clinical setting. In a study on fMRI time series, Triantafyllou et al. showed that the benefits of higher field strength are more pronounced with a small voxel volume [11]. Therefore, similarly for ASL, a higher resolution could better exploit the intrinsic SNR gain at 5T. In addition, partial volume effects could also be reduced at a higher resolution. Despite the shown improvements over 3T, a more thorough comparison study using the same acquisition parameters is needed to establish the advantage of 5T ASL. The UIH 5T scanner is equipped with an 8-channel transmit system. Therefore, applying RF shimming might improve the labeling efficiency and therefore the perfusion signal. A dedicate labeling coil [12] may further improve the labeling efficiency, but additional hardware development is required. CBF measurements at 5T in this study performed based on the relationship between blood T1 and field strength reported in the literature, but measuring blood T1 at 5T using the method by Lu and Ge [13] may be needed for more accurate CBF quantification. TGV denoising was shown to improve the quality of perfusion-weighted images, but such an improvement needs to be better evaluated using metrics such as structural similarity index (SSIM) and peak signal-to-noise ratio (PSNR).Conclusion
This study demonstrated the feasibility of high-resolution ASL at 5T for clinical use.Acknowledgements
This work is supported by National Key R&D Program of China N0.2017YFC0108800.References
1. Teeuwisse, W.M., A.G. Webb, and M.J.P. van Osch, Arterial spin labeling at ultra-high field: All that glitters is not gold. International Journal of Imaging Systems and Technology, 2010. 20(1): p. 62-70.
2. Wang, Y., et al., Simultaneous multi-slice Turbo-FLASH imaging with CAIPIRINHA for whole brain distortion-free pseudo-continuous arterial spin labeling at 3 and 7 T. Neuroimage, 2015. 113: p. 279-88.
3. Zuo, Z., et al., Turbo-FLASH based arterial spin labeled perfusion MRI at 7 T. PLoS One, 2013. 8(6): p. e66612.
4. Tong, Y., et al., Improving PCASL at ultra-high field using a VERSE-guided parallel transmission strategy. Magn Reson Med, 2020. 84(2): p. 777-786.
5. Meixner, C.R., et al., Hybrid B 1 + -shimming and gradient adaptions for improved pseudo-continuous arterial spin labeling at 7 Tesla. Magn Reson Med, 2021.
6. Wang, K., et al., Optimization of pseudo-continuous arterial spin labeling at 7T with parallel transmission B1 shimming. Magn Reson Med, 2021.
7. Buxton, R.B., et al., A general kinetic model for quantitative perfusion imaging with arterial spin labeling. Magn Reson Med, 1998. 40(3): p. 383-96.
8. Zhang, X., et al., In vivo blood T(1) measurements at 1.5 T, 3 T, and 7 T. Magn Reson Med, 2013. 70(4): p. 1082-6.
9. Spann, S.M., et al., Spatio-temporal TGV denoising for ASL perfusion imaging. Neuroimage, 2017. 157: p. 81-96.
10. Petersen, E.T., et al., The QUASAR reproducibility study, Part II: Results from a multi-center Arterial Spin Labeling test-retest study. Neuroimage, 2010. 49(1): p. 104-13.
11. Triantafyllou, C., et al., Comparison of physiological noise at 1.5 T, 3 T and 7 T and optimization of fMRI acquisition parameters. Neuroimage, 2005. 26(1): p. 243-50.
12. Mora Alvarez, M.G., R.W. Stobbe, and C. Beaulieu, High resolution continuous arterial spin labeling of human cerebral perfusion using a separate neck tagging RF coil. PLoS One, 2019. 14(4): p. e0215998.
13. Lu, H., et al., Determining the longitudinal relaxation time (T1) of blood at 3.0 Tesla. Magn Reson Med, 2004. 52(3): p. 679-82.
Figures