4608
Auto-calibrated Mutiband First-pass Perfusion Imaging with CS reconstruction in patients with suspect CAD at 3T MRI1Paul C. Lauterbur Research Centre for Biomedical Imaging, Shenzhen Institutes of Advanced Technology, Chinese Academy of Science, Shenzhen, China, 2Shenzhen College of Advanced Technology, University of Chinese Academy of Sciences, Shenzhen, China, 3Medical Imaging Center, Shenzhen Hospital, Southern Medical University, Shenzhen, China, 4UIH America Inc., Houston, TX, United States
Synopsis
A whole heart perfusion imaging with auto-calibrated multiband CAIPIRINHA with through-time encoding and iterative reconstruction (tMB+CS-FPP) has been proposed to acquire multiple slices simultaneously without extra reference scans. The technique can achieve perfusion images with doubled anatomic coverage with identical spatial resolution. In this study, we compared the performance of the tMB+CS-FPP using different k-t undersampling patterns in a phantom study. And the proposed method was performed to the patients with suspect CAD and was compared to the conventional FPP.
Introduction
Myocardial first-pass perfusion (FPP) is a well-established tool for ischemia testing in patients with intermediate-risk of coronary artery disease (CAD)[1]. To date, an auto-calibrated simultaneous multi-slice imaging has been implemented in a standard spoiled GRE sequence with a combination of a k-t acceleration (tMB+CS-FPP) to increase left ventricular coverage without sacrificing in-plane spatial resolution in perfusion imaging[2,3]. The tMB+CS-FPP technique allows reconstruction of multiple slices without the need for extra reference data acquisition and the non-aliased reference data is estimated from the consecutive cardiac cycles. The feasibility of the application has been validated explored through a healthy volunteer with contrast administration[3]. However, no conventional FPP was compared in the previous study. In this study, we compare the performance of the tMB+CS-FPP using different k-t undersampling patterns in a phantom study. Then, in-vivo experiments were performed to compare the performance of conventional FPP and tMB+CS-FPP in patients with suspect CAD.Methods
An ECG SR GRE sequence was performed on a 3.0 Tesla (T) system (uMR790, United Imaging Healthcare, Shanghai, China). A 12-channel abdomen phased array coil in conjunction with a 16-element posterior spine coil was used for data acquisition in both phantom and in-vivo studies.Phantom Study
Data acquisition: A full sampled MB dataset was scanned using a T1MES phantom[4]. Imaging parameters were: repetition time / echo time / flip angle (TR/TE/FA) = 3.46 ms/1.62 ms/10°, saturation time (SRT) = 320 ms, field of view (FOV) = 260 × 260 mm2, spatial resolution = 1.35 × 1.35 mm2, slice thickness = 10 mm, bandwidth = 900 Hz/ Px, number of dynamics = 50, MB factor = 2, number of slice group (NSG) = 1 and simulated RR interval=1000ms.
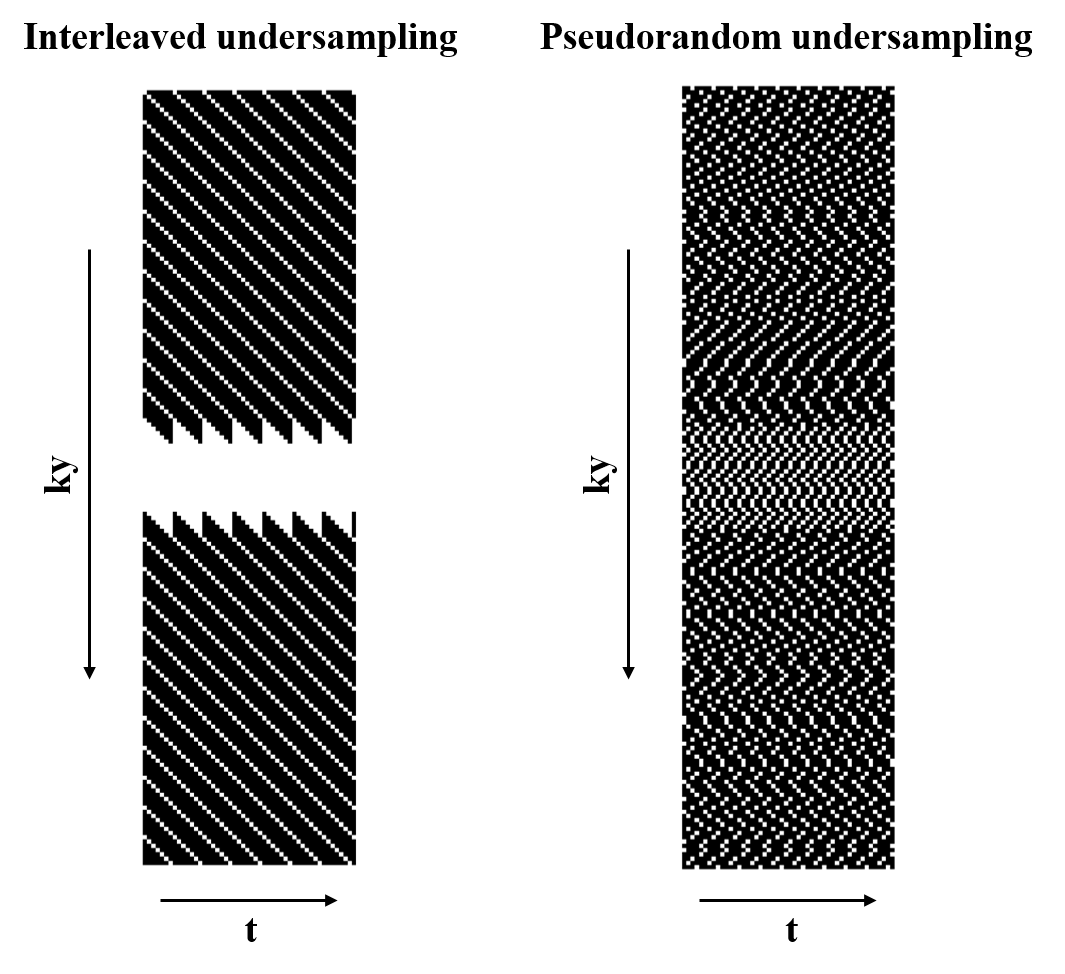
Sampling patterns: Two k-t space undersampling patterns, with acquired phase encoding lines complementary for adjacent cardiac cycles, were developed and retrospectively compared in this work. Figure 1 shows the two undersampling schemes. For the regular k-t space undersampling scheme, the acquisition was regularly performed as linear sampling through time (cardiac cycle). While acquisition using pseudorandom k-t space undersampling was performed as the Latin Hypercube method[5].
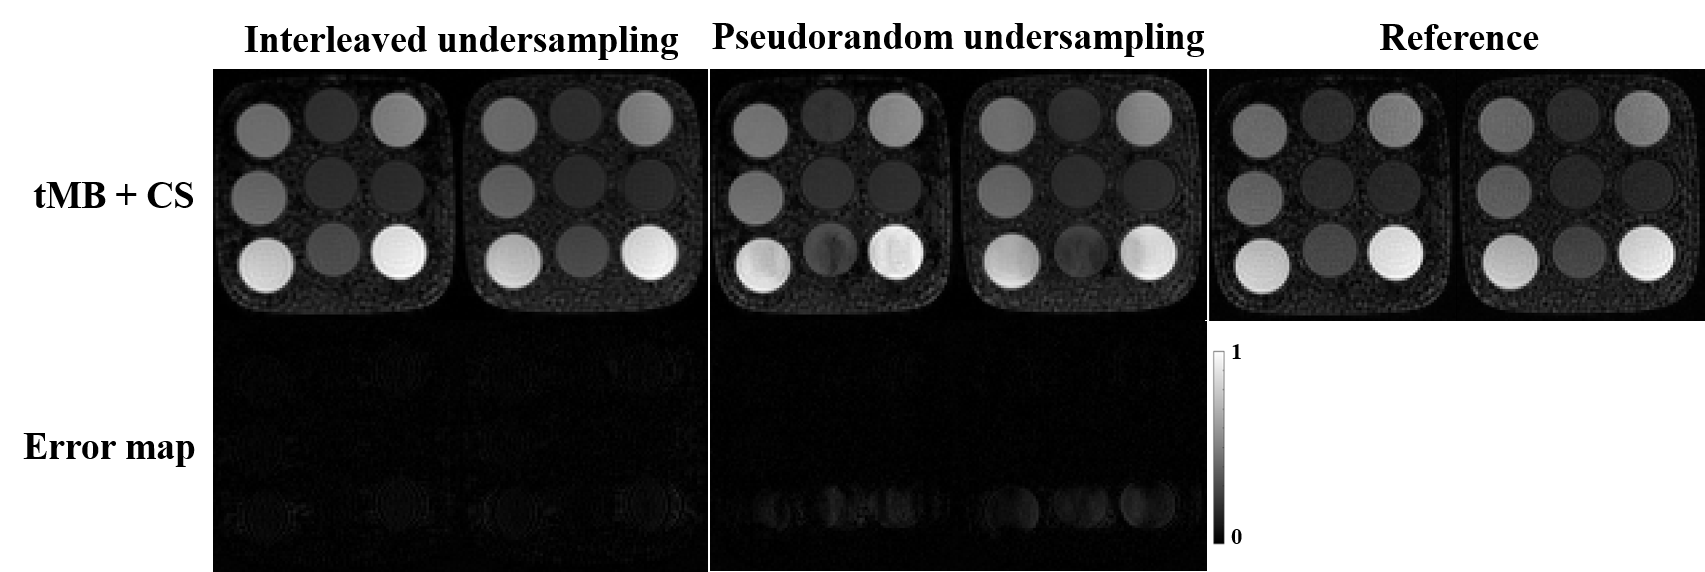
Reconstruction and Comparison: tMB+CS reconstruction[2,3] was used and error maps were estimated to evaluate residual artefacts. Ground truth images were reconstructed from the fully sampled MB data by using the auto-calibrated MB combined with slice-GRAPPA (tMB+slice-GRAPPA) method.
In-vivo Study
Data acquisition: The study was approved by our Institutional Reviews Board. 2 subjects with suspected cardiac disease were recruited following informed consent. Conventional FFP and tMB+CS-FPP images were acquired for every subject. A dose of 0.05 mmol/kg of gadopentetate dimeglumine (MultiHance; Bracco. SpA, Milano, Italy) was administered for each perfusion protocol. The acquisitions were performed separately with a minimum time interval of 10 minutes to allow the contrast agent wash-out. 3 short-axis and a 4-chamber were acquired in conventional FPP, while 4 slice groups were acquired in tMB+CS-FPP with an MB factor of 2. Scanning parameters of both sequences were: FA=10°, SRT= 100ms, FOV= 360×340×10mm3, reconstructed spatial resolution=1.88×1.88×10mm3, and bandwidth= 900Hz/pixel.
Reconstruction: All in-vivo images were reconstructed inline on the 3T scanner, using GRAPPA for conventional FPP and using the tMB+CS reconstruction for tMB+CS-FPP.
Results
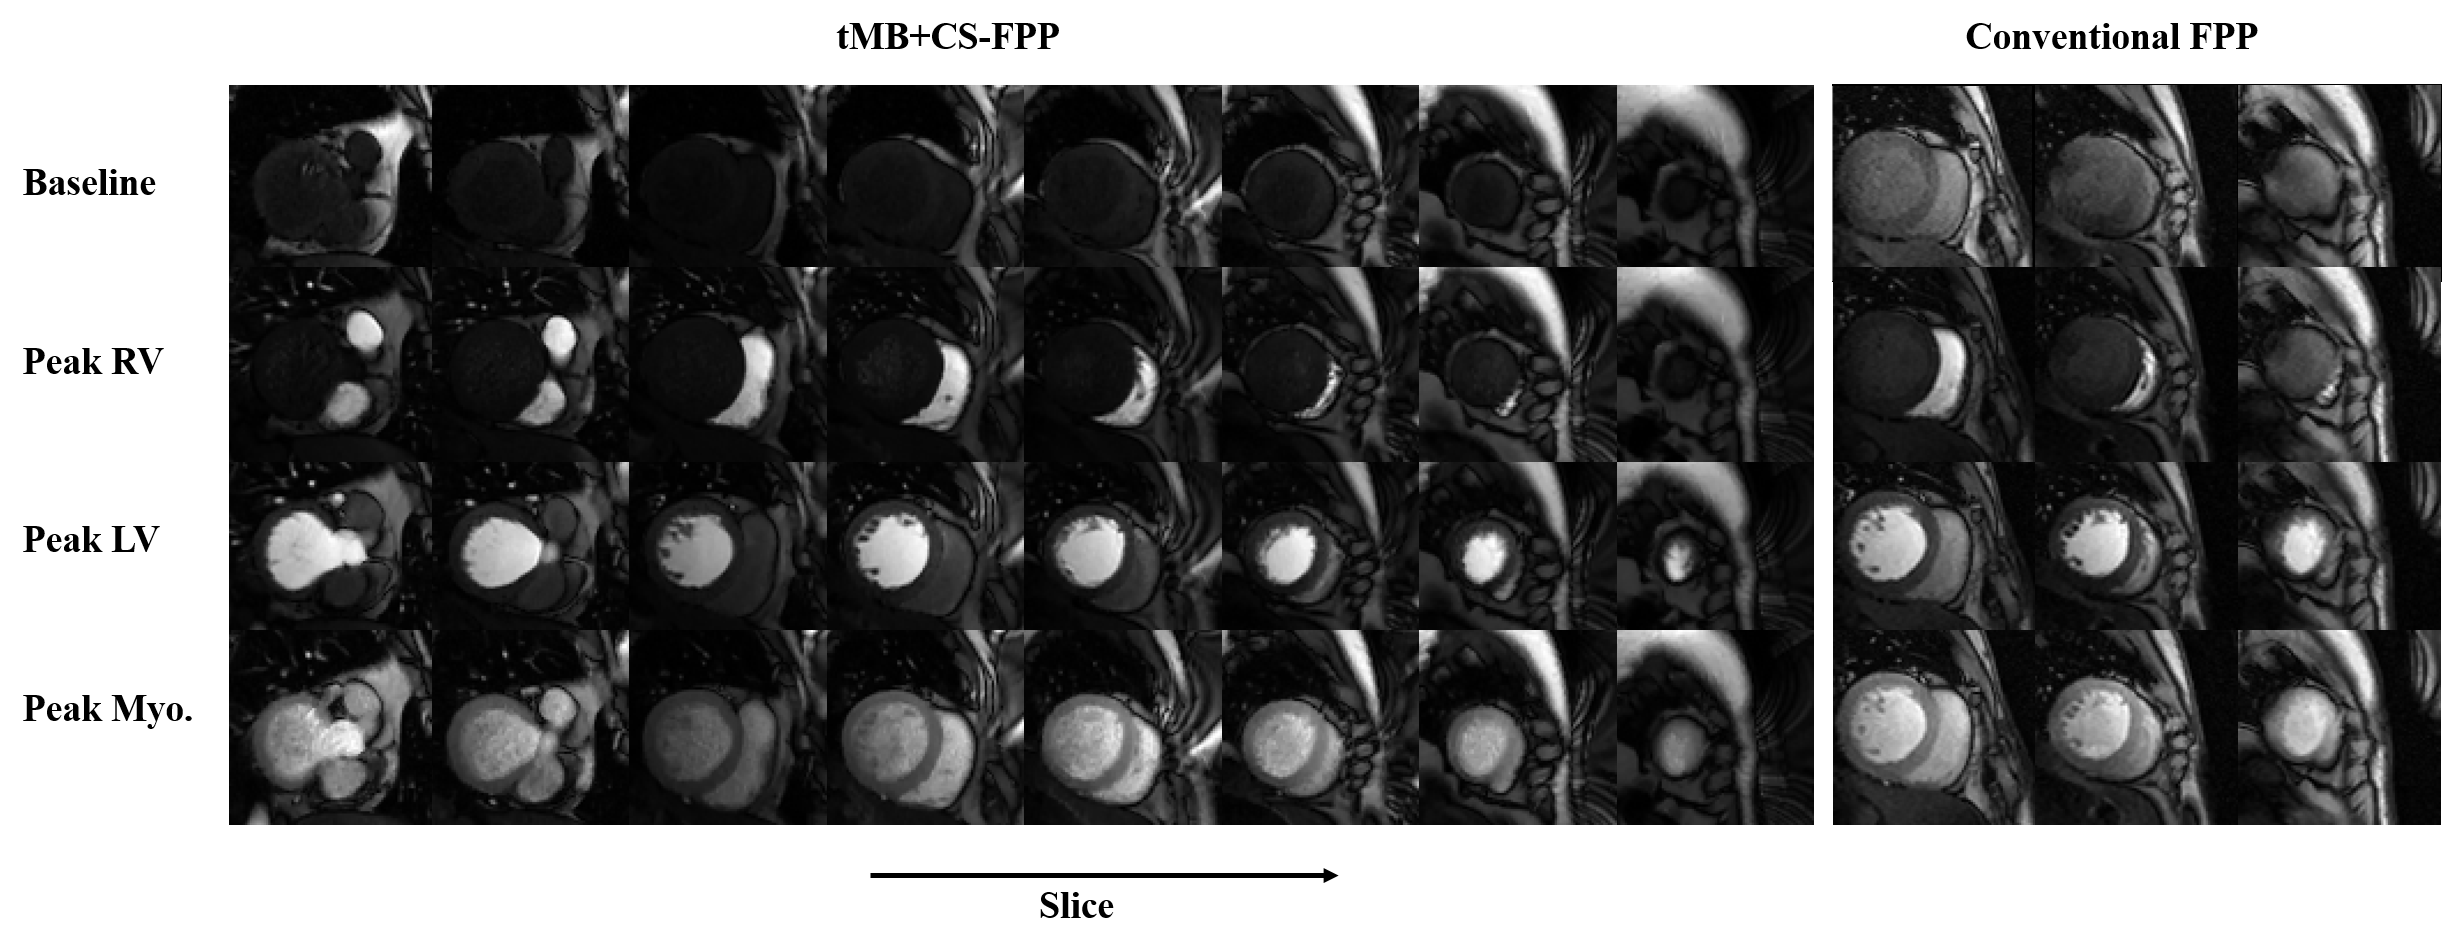
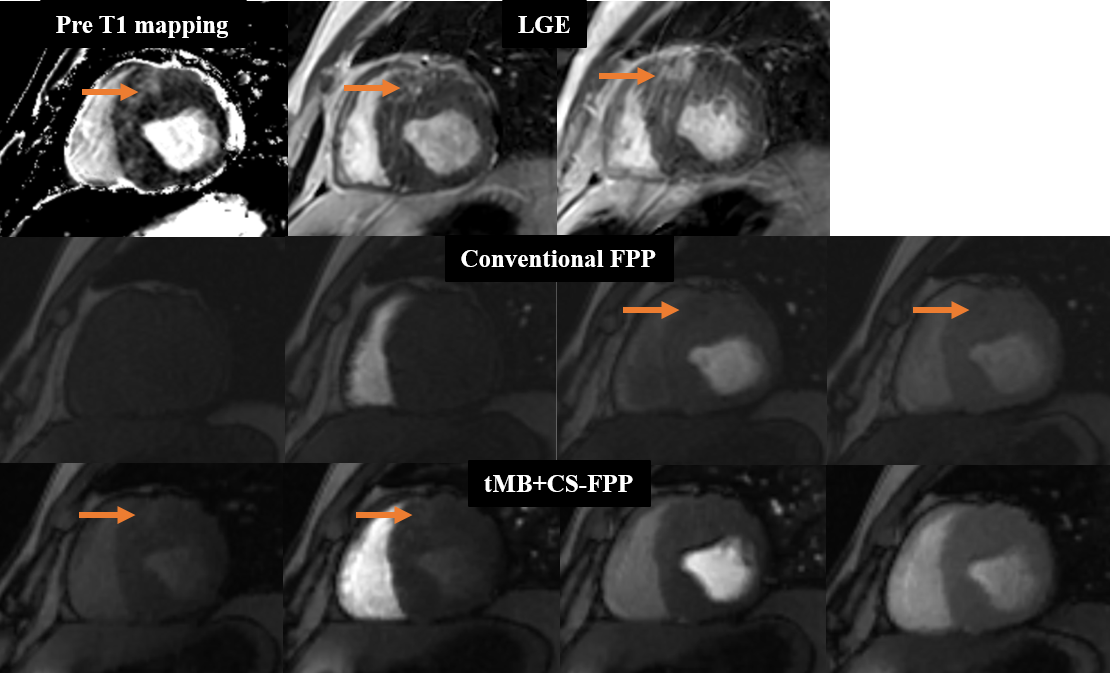
The T1MES phantom images from the phantom study to compare interleaved and pseudorandom k-t undersampling acquisition with t MB+CS reconstruction are demonstrated in Figure 2. Figure 3 shows an example of dynamic perfusion series after contrast administration in a patient with the conventional FPP sequence and the tMB+CS-FPP sequence. Figure 4 shows the myocardial infarction (MI) case from a patient with hypertrophic cardiomyopathy and chip MI. In this case, the increased signal intensity of the infarction area was shown on the pre-contrast T1 mapping as well as LGE images. For the FFP sequence, the area of perfusion defect was shown with lower signal intensity on the peak LV blood pool image as well as the peak myocardial image with the conventional protocol, whereas the area showed as high signal intensity on the baseline image as well as the peak RV image with the proposed protocol because of the residual contrast agent in the infarction area after the first administration.Discussion and Conclusion
With conventional FPP, 8 slices can be achieved by separately acquiring 8 slices using 2 heartbeats per repetition. Therefore each frame takes 2 heartbeats, which causes prolonged scan time and adds to the breath-holding burden of patients. In this work, 8 slices were achieved in all 2 subjects by using the tMB+CS-FPP with an MB factor of 2. Although the auto-calibrated MB technique[6] assumes the signal of every single band slice does not change over the time dimension, we found this technique still performs reasonably well in some dynamic imaging applications such as cardiac perfusion imaging. The regular k-t space acceleration with a fully sampled central region performed well to improve the robustness against abrupt variation of signal amplitudes along with the acquired cardiac cycles due to contrast injection. Experiments showed that comparable diagnostic image quality of the proposed sequence can be achieved with doubled anatomic coverage and identical spatial resolution compared to the conventional FPP approach. And a higher MB factor is planned in conjunction with a 24-channel abdomen phased-array coil to achieve more LV coverage.Acknowledgements
Some of the work was partially supported by the National Natural Science Foundation of China (No. 81801691), the State Key Program of National Natural Science Foundation of China (Grant No. 81830056), the Shenzhen Key Laboratory of Ultrasound Imaging and Therapy (ZDSYS20180206180631473 ), the Key Laboratory for Magnetic Resonance and Multimodality Imaging of Guangdong Province (2020B1212060051), and the Science and Technology Project of Shenzhen (Grant Number: JCYJ20210324125403011).References
1. Coelhofilho, O. R., et al., Radiology, 2013, 266(3): 701-715.
2. Zou, L., et al., Proc. Intl. Soc. Mag. Reson. Med. 28, 2883.
3. Zou, L., et al., Proc. Intl. Soc. Mag. Reson. Med. 29, 0896.
4. Captur, G., et al., J Cardiovasc Magn Reson, 2016. 18(1): p. 58.
5. Lyu, JY, et al., Proc. Intl. Soc. Mag. Reson. Med. 27, 4752.
6. Ferrazzi, G., et al., Magn. Reson. in Med., 2019, 81(2): 1016-1030.
Figures