4607
Histogram-based analysis of perfusion features in oligodendrogliomas using multi-delay arterial spin labeling MR imaging: a preliminary study1State Key Laboratory of Brain and Cognitive Science, Beijing MRI Center for Brain Research, Institute of Biophysics, Chinese Academy of Sciences, Beijing, China, 2University of Chinese Academy of Sciences, Beijing, China, 3Beijing Neurosurgical Institute, Beijing, China, 4Department of Neurosurgery, Beijing Tiantan Hospital, Beijing, China, 5AnImage Tech. Beijing Co., Ltd., Beijing, China, 6Siemens Shenzhen Magnetic Resonance Ltd, Shenzhen, China, 7CAS Center for Excellence in Brain Science and Intelligence Technology, Chinese Academy of Sciences, Beijing, China, 8Shenzhen Institutes of Advanced Technology, Chinese Academy of Sciences, Shenzhen, China, 9Laboratory of FMRI Technology (LOFT), Mark & Mary Stevens Neuroimaging and Informatics Institute, Keck School of Medicine, University of Southern California, Los Angeles, CA, United States, 10Beijing Institute for Brain Disorders, Beijing, China
Synopsis
The clinical treatment and prognosis of oligodendrogliomas are closely related to the histopathological grade. As a non-invasive and non-contrast perfusion imaging technique, arterial spin labeling (ASL) has been widely used in studies of glioma grading. The estimation of cerebral blood flow (CBF) in conventional single-delay ASL can be affected by the arterial transit time (ATT) effect. Here, multi-delay 3D ASL providing multiple hemodynamic parameters including ATT and ATT-corrected CBF was used to analyze the histogram-based perfusion features in oligodendrogliomas. Our results showed no difference in rCBF between WHO grade 2 and 3 oligodendrogliomas, but prolonged rATT in higher grade oligodendrogliomas.
Introduction
As one of the most common subtypes of diffuse gliomas in adults,1 IDH-mutant and 1p/19q-codeleted oligodendrogliomas are classified into grade 2 and 3 according to the WHO classification system.1,2 The clinical treatment and prognosis of oligodendrogliomas are closely related to the histopathological grade3,4 determined through invasive neurosurgery. Dynamic susceptibility contrast perfusion-weighted imaging (DSC-PWI) has been used in previous studies for non-invasive presurgical grading of oligodendroglial tumors, but with inconsistent results.5,6 Recently, non-contrast arterial spin labeling (ASL) perfusion imaging has also been applied in glioma grading,7,8 with a strong correlation between ASL cerebral blood flow (CBF), DSC CBF and cerebral blood volume (CBV).9,10 The estimated CBF in conventional single-delay ASL can be affected by the arterial transit time (ATT) effect.9,10 Therefore, this study aims to compare the histogram-based perfusion features in grade 2 and 3 oligodendrogliomas using multi-delay 3D ASL10 that provides multiple hemodynamic parameters including ATT and ATT-corrected CBF.Methods
Patients: After IRB-approved written informed consent was obtained, 70 preoperative patients with suspected glioma were recruited from Beijing Tiantan Hospital, and scanned on a 3T MRI system (MAGNETOM Prisma, Siemens Healthcare, Erlangen, Germany) at Beijing MRI Center for Brain Research. Among them, 25 treatment-naïve patients (see demographic data in Table 1) with histologically and genetically confirmed oligodendrogliomas based on the 2016 WHO classification criteria2 were included in this retrospective study.Imaging parameters: The imaging protocol included T1-MPRAGE (0.9×0.9×0.9mm3), T2-FLAIR (0.9×0.9×0.9mm3), multi-delay ASL (2.5×2.5×3mm3) sequences. ASL scan was performed using a 5-delay pseudo-continuous ASL (pCASL) protocol with background suppressed 3D GRASE readout10,11 (40 slices, PLDs = 0.5/1/1.5/2/2.5s, labeling pulse duration = 1.5s, total scan time 7min11s).
Data processing: Post-processing of multi-delay pCASL data was performed offline using CereFlow (AnImage Tech. Beijing Co., Ltd.) to calculate the ATT and CBF maps. These perfusion maps and T2-FLAIR images were co-registered to T1 images using SPM12 (www.fil.ion.ucl.ac.uk/spm). A 3D regions of interest (ROI) of the whole tumor (ROItumor) was manually delineated on T2-FLAIR images to include all T2-FLAIR-hyperintense regions (Figure 1 and 2) using ITK-SNAP.12 The ROI of the brain (ROIbrain) was also generated through T1 segmentation in SPM12. The relative CBF (rCBF) and ATT (rATT) maps were computed by dividing the co-registered CBF and ATT maps with the averaged CBF and ATT values of voxels within ROIbrain
Statistical analysis: Statistical analysis of the data was performed using GraphPad Prism (GraphPad Software, San Diego, CA). Patients were divided into CNS WHO grade 2 and 3 groups according to histopathological results through surgical resection. The differences of histogram features and patients’ age between grade 2 and 3 oligodendrogliomas were tested by the unpaired t test with Welch’s correction or Mann-Whitney U test after the Kolmogorov-Smirnov test of normality. Fisher's exact test was used to compare the gender composition.
Results
As shown in Figures 1 and 2, either elevated or reduced CBF values within the tumor can be observed in both WHO grade 2 and 3 oligodendrogliomas. There is no significant difference in any histogram-based features of rCBF between grade 2 and 3 oligodendrogliomas (Figure 3). The rATTmedian of grade 3 oligodendrogliomas is significantly longer than that of grade 2 oligodendrogliomas (p = 0.0033). The rATTskewness of grade 2 oligodendrogliomas is significantly larger than that of grade 3 oligodendrogliomas (mean SD: 0.3232 0.4942 vs. -0.3223 0.2343, p = 0.0003), indicating a trend of prolonged rATT values in grade 3 oligodendrogliomas. Although the age of grade 3 oligodendroglioma patients is significantly larger than that of the grade 2 patients (p = 0.0273), rATTmedian doesn’t show significant correlation with age in either grade of oligodendrogliomas (Figure 4).Discussion
As a non-invasive and non-contrast perfusion imaging technique, ASL has been widely used in studies of glioma grading.7,8 To reduce biases caused by subjective factors during ROIs selection, we delineated a 3D whole-tumor ROI on T2-FLAIR images and used the whole-brain ROI excluding tumor ROI as the reference region, from which histogram-based perfusion features were extracted. The averaged rCBF value of the top 5% voxels here is similar to rCBFmax with the best performance in glioma grading in previous studies.7,8 However, none of the histogram-based features of rCBF is significantly different between grade 2 and 3 oligodendrogliomas, consistent with a histogram-based analysis using DSC CBV.6 Interestingly, rATTmedian and rATTskewness are both significantly different between grade 2 and 3 patients, implying prolonged ATT (the time for the labeled arterial blood to flow into brain tissue10) in grade 3 oligodendrogliomas. This may be because the vasculatures in higher grade oligodendrogliomas are more complex and heterogeneous. However, considering the relatively small sample size here, more oligodendroglioma patients should be enrolled in further studies to increase the statistic power.Conclusion
Through the histogram-based analysis, no difference in rCBF was found between WHO grade 2 and 3 oligodendrogliomas, while prolonged rATT values were noted in higher grade oligodendrogliomas. Multi-delay ASL perfusion imaging may provide added values in non-invasively preoperative diagnosis and grading of oligodendrogliomas.Acknowledgements
This work was supported in part by the Beijing Natural Science Foundation (L182055), the National Natural Science Foundation of China grants (81961128030, 81871350, and 81627901), the Ministry of Science and Technology of China grants (2019YFC0120901, 2019YFA0707103), and the Strategic Priority Research Program of Chinese Academy of Science (XDB32010300).
References
1. Louis DN, Perry A, Wesseling P, et al. The 2021 WHO classification of tumors of the central nervous system: a summary. Neuro-oncology. 2021;23(8):1231-1251.
2. Louis DN, Perry A, Reifenberger G, et al. The 2016 World Health Organization classification of tumors of the central nervous system: a summary. Acta neuropathologica. 2016;131(6):803-820.
3. Weller M, Van Den Bent M, Tonn JC, et al. European Association for Neuro-Oncology (EANO) guideline on the diagnosis and treatment of adult astrocytic and oligodendroglial gliomas. The lancet oncology. 2017;18(6):e315-e329.
4. Ostrom QT, Patil N, Cioffi G, Waite K, Kruchko C, Barnholtz-Sloan JS. CBTRUS statistical report: primary brain and other central nervous system tumors diagnosed in the United States in 2013–2017. Neuro-oncology. 2020;22(Supplement_1):iv1-iv96.
5. Lin Y, Xing Z, She D, et al. IDH mutant and 1p/19q co-deleted oligodendrogliomas: tumor grade stratification using diffusion-, susceptibility-, and perfusion-weighted MRI. Neuroradiology. 2017;59(6):555-562.
6. Lee JY, Ahn KJ, Lee YS, Jang JH, Jung SL, Kim BS. Differentiation of grade II and III oligodendrogliomas from grade II and III astrocytomas: a histogram analysis of perfusion parameters derived from dynamic contrast-enhanced (DCE) and dynamic susceptibility contrast (DSC) MRI. Acta Radiologica. 2018;59(6):723-731.
7. Alsaedi A, Doniselli F, Jäger HR, et al. The value of arterial spin labelling in adults glioma grading: systematic review and meta-analysis. Oncotarget. 2019;10(16):1589.
8. Falk Delgado A, De Luca F, Van Westen D, Falk Delgado A. Arterial spin labeling MR imaging for differentiation between high-and low-grade glioma—a meta-analysis. Neuro-oncology. 2018;20(11):1450-1461.
9. Khashbat D, Abe T, Ganbold M, et al. Correlation of 3D arterial spin labeling and multi-parametric dynamic susceptibility contrast perfusion MRI in brain tumors. The Journal of Medical Investigation. 2016;63(3.4):175-181.
10. Wang DJ, Alger JR, Qiao JX, et al. Multi-delay multi-parametric arterial spin-labeled perfusion MRI in acute ischemic stroke—comparison with dynamic susceptibility contrast enhanced perfusion imaging. NeuroImage: Clinical. 2013;3:1-7.
11. Hu HH, Rusin JA, Peng R, et al. Multi-phase 3D arterial spin labeling brain MRI in assessing cerebral blood perfusion and arterial transit times in children at 3T. Clinical Imaging. 2019;53:210-220.
12. Yushkevich PA, Piven J, Hazlett HC, et al. User-guided 3D active contour segmentation of anatomical structures: significantly improved efficiency and reliability. Neuroimage. 2006;31(3):1116-1128.
Figures
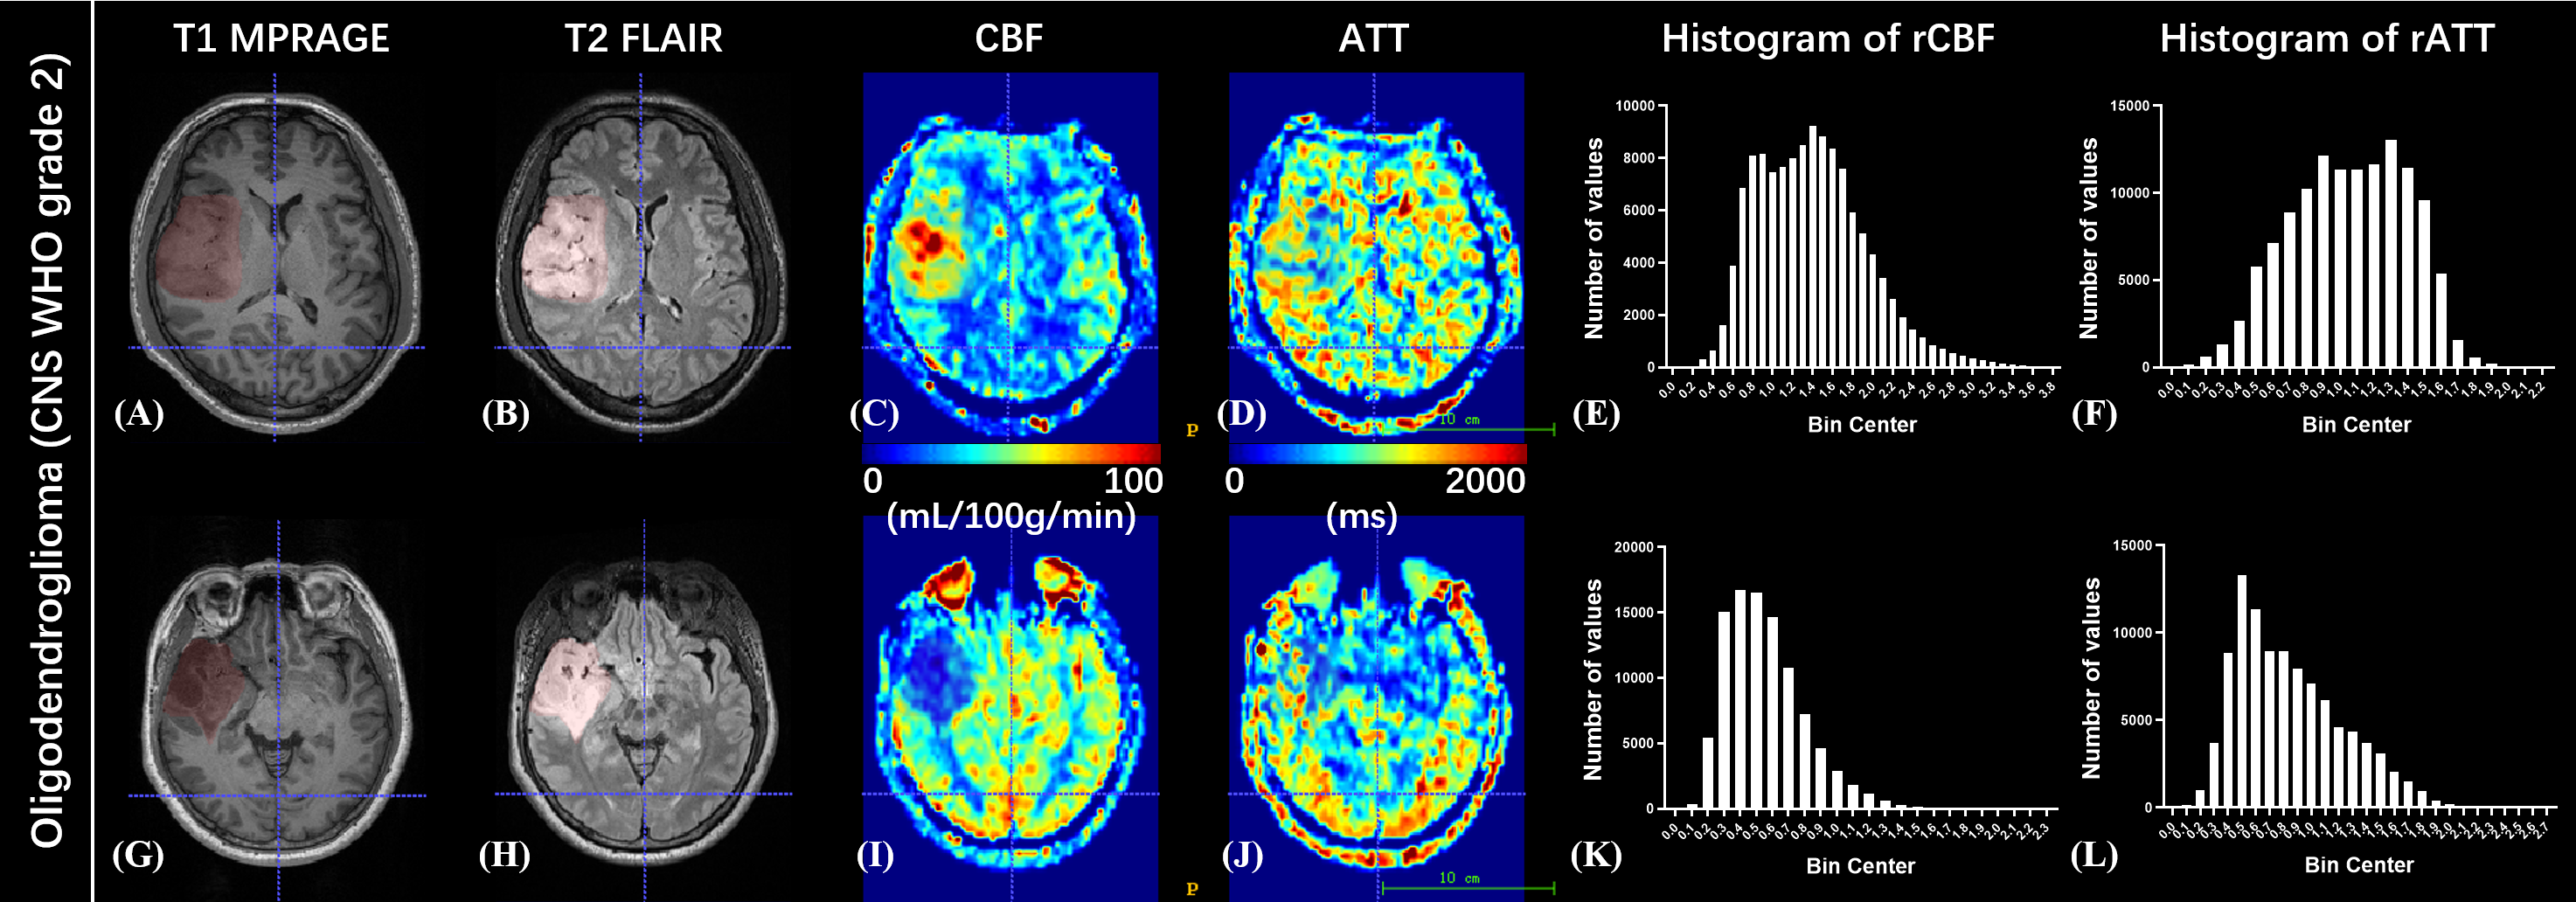
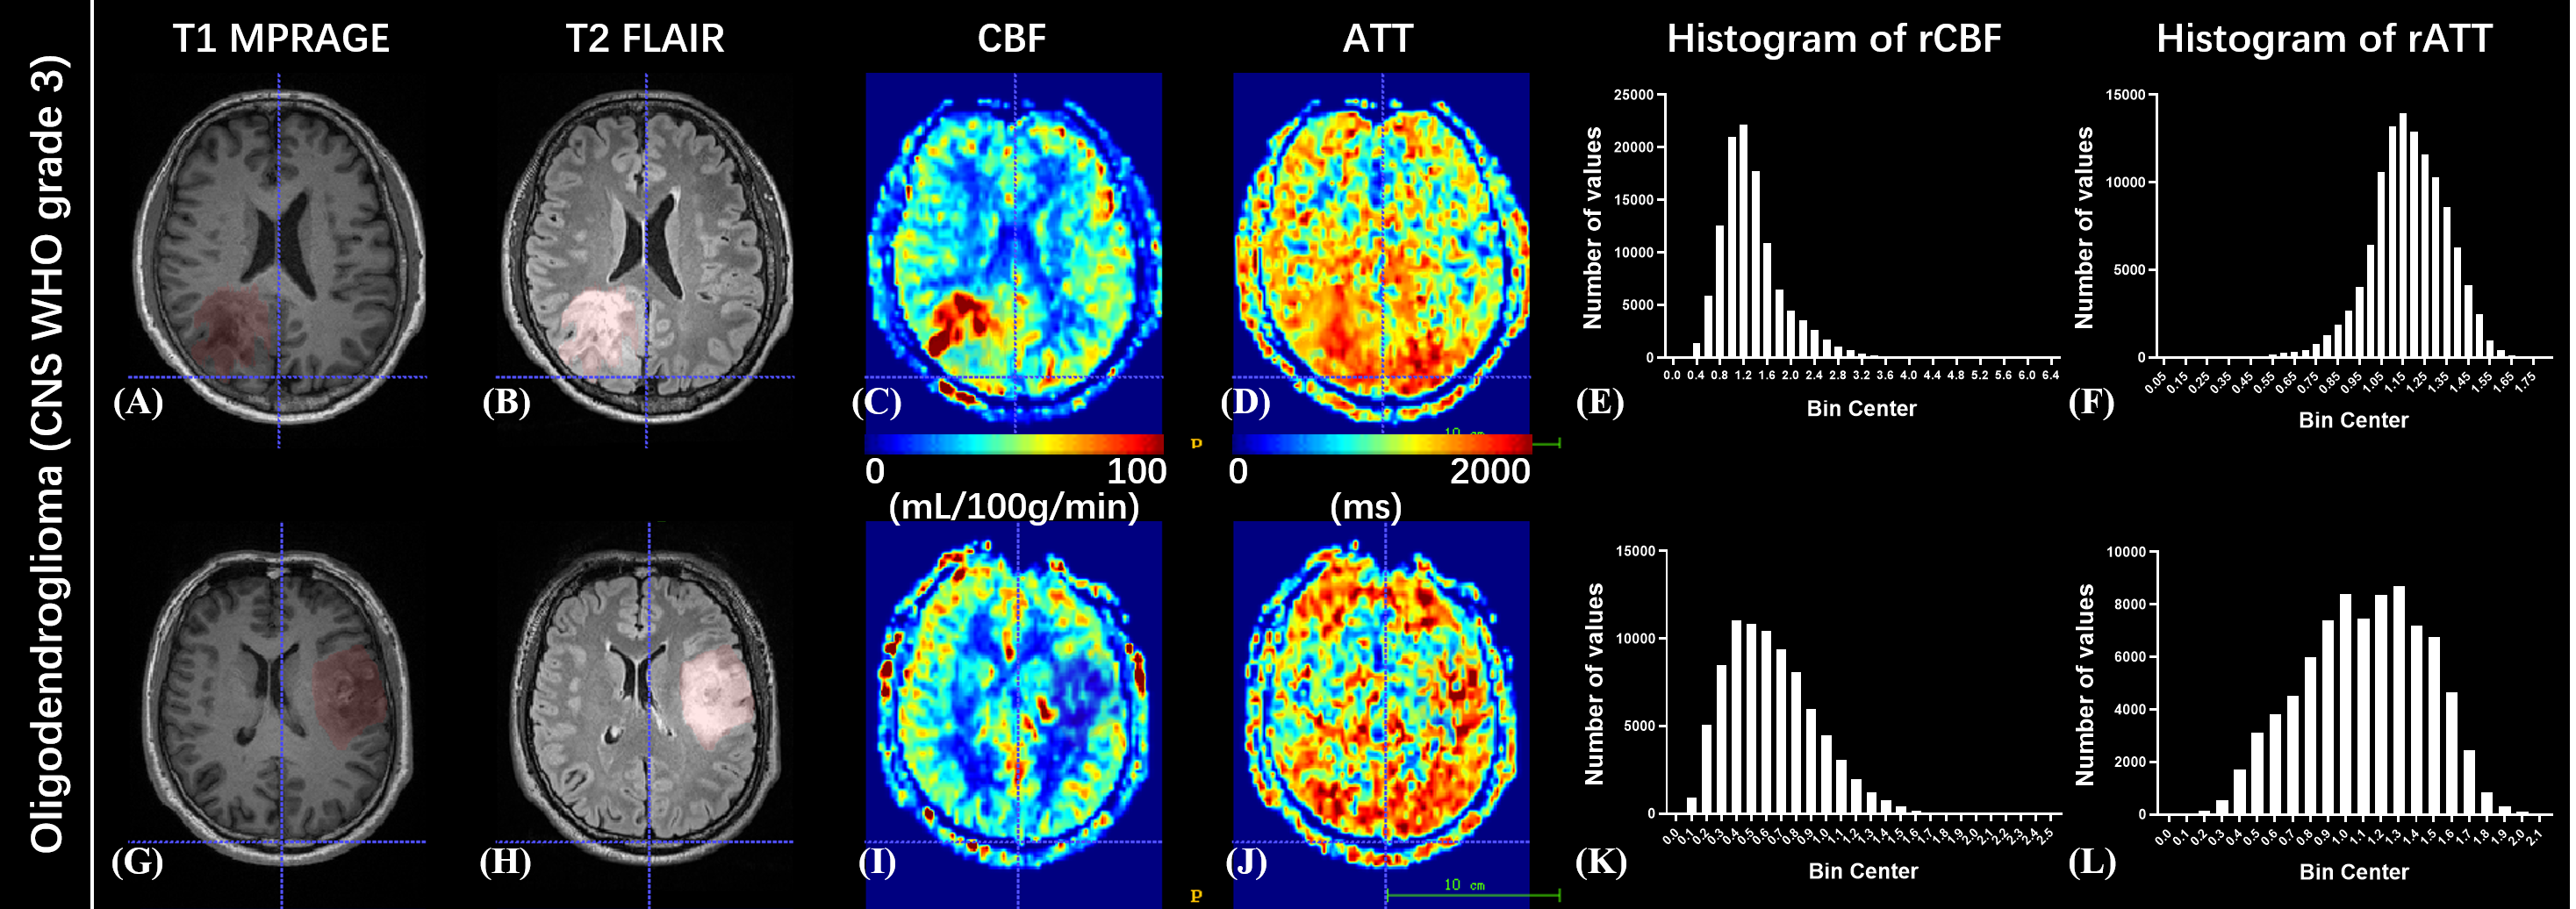
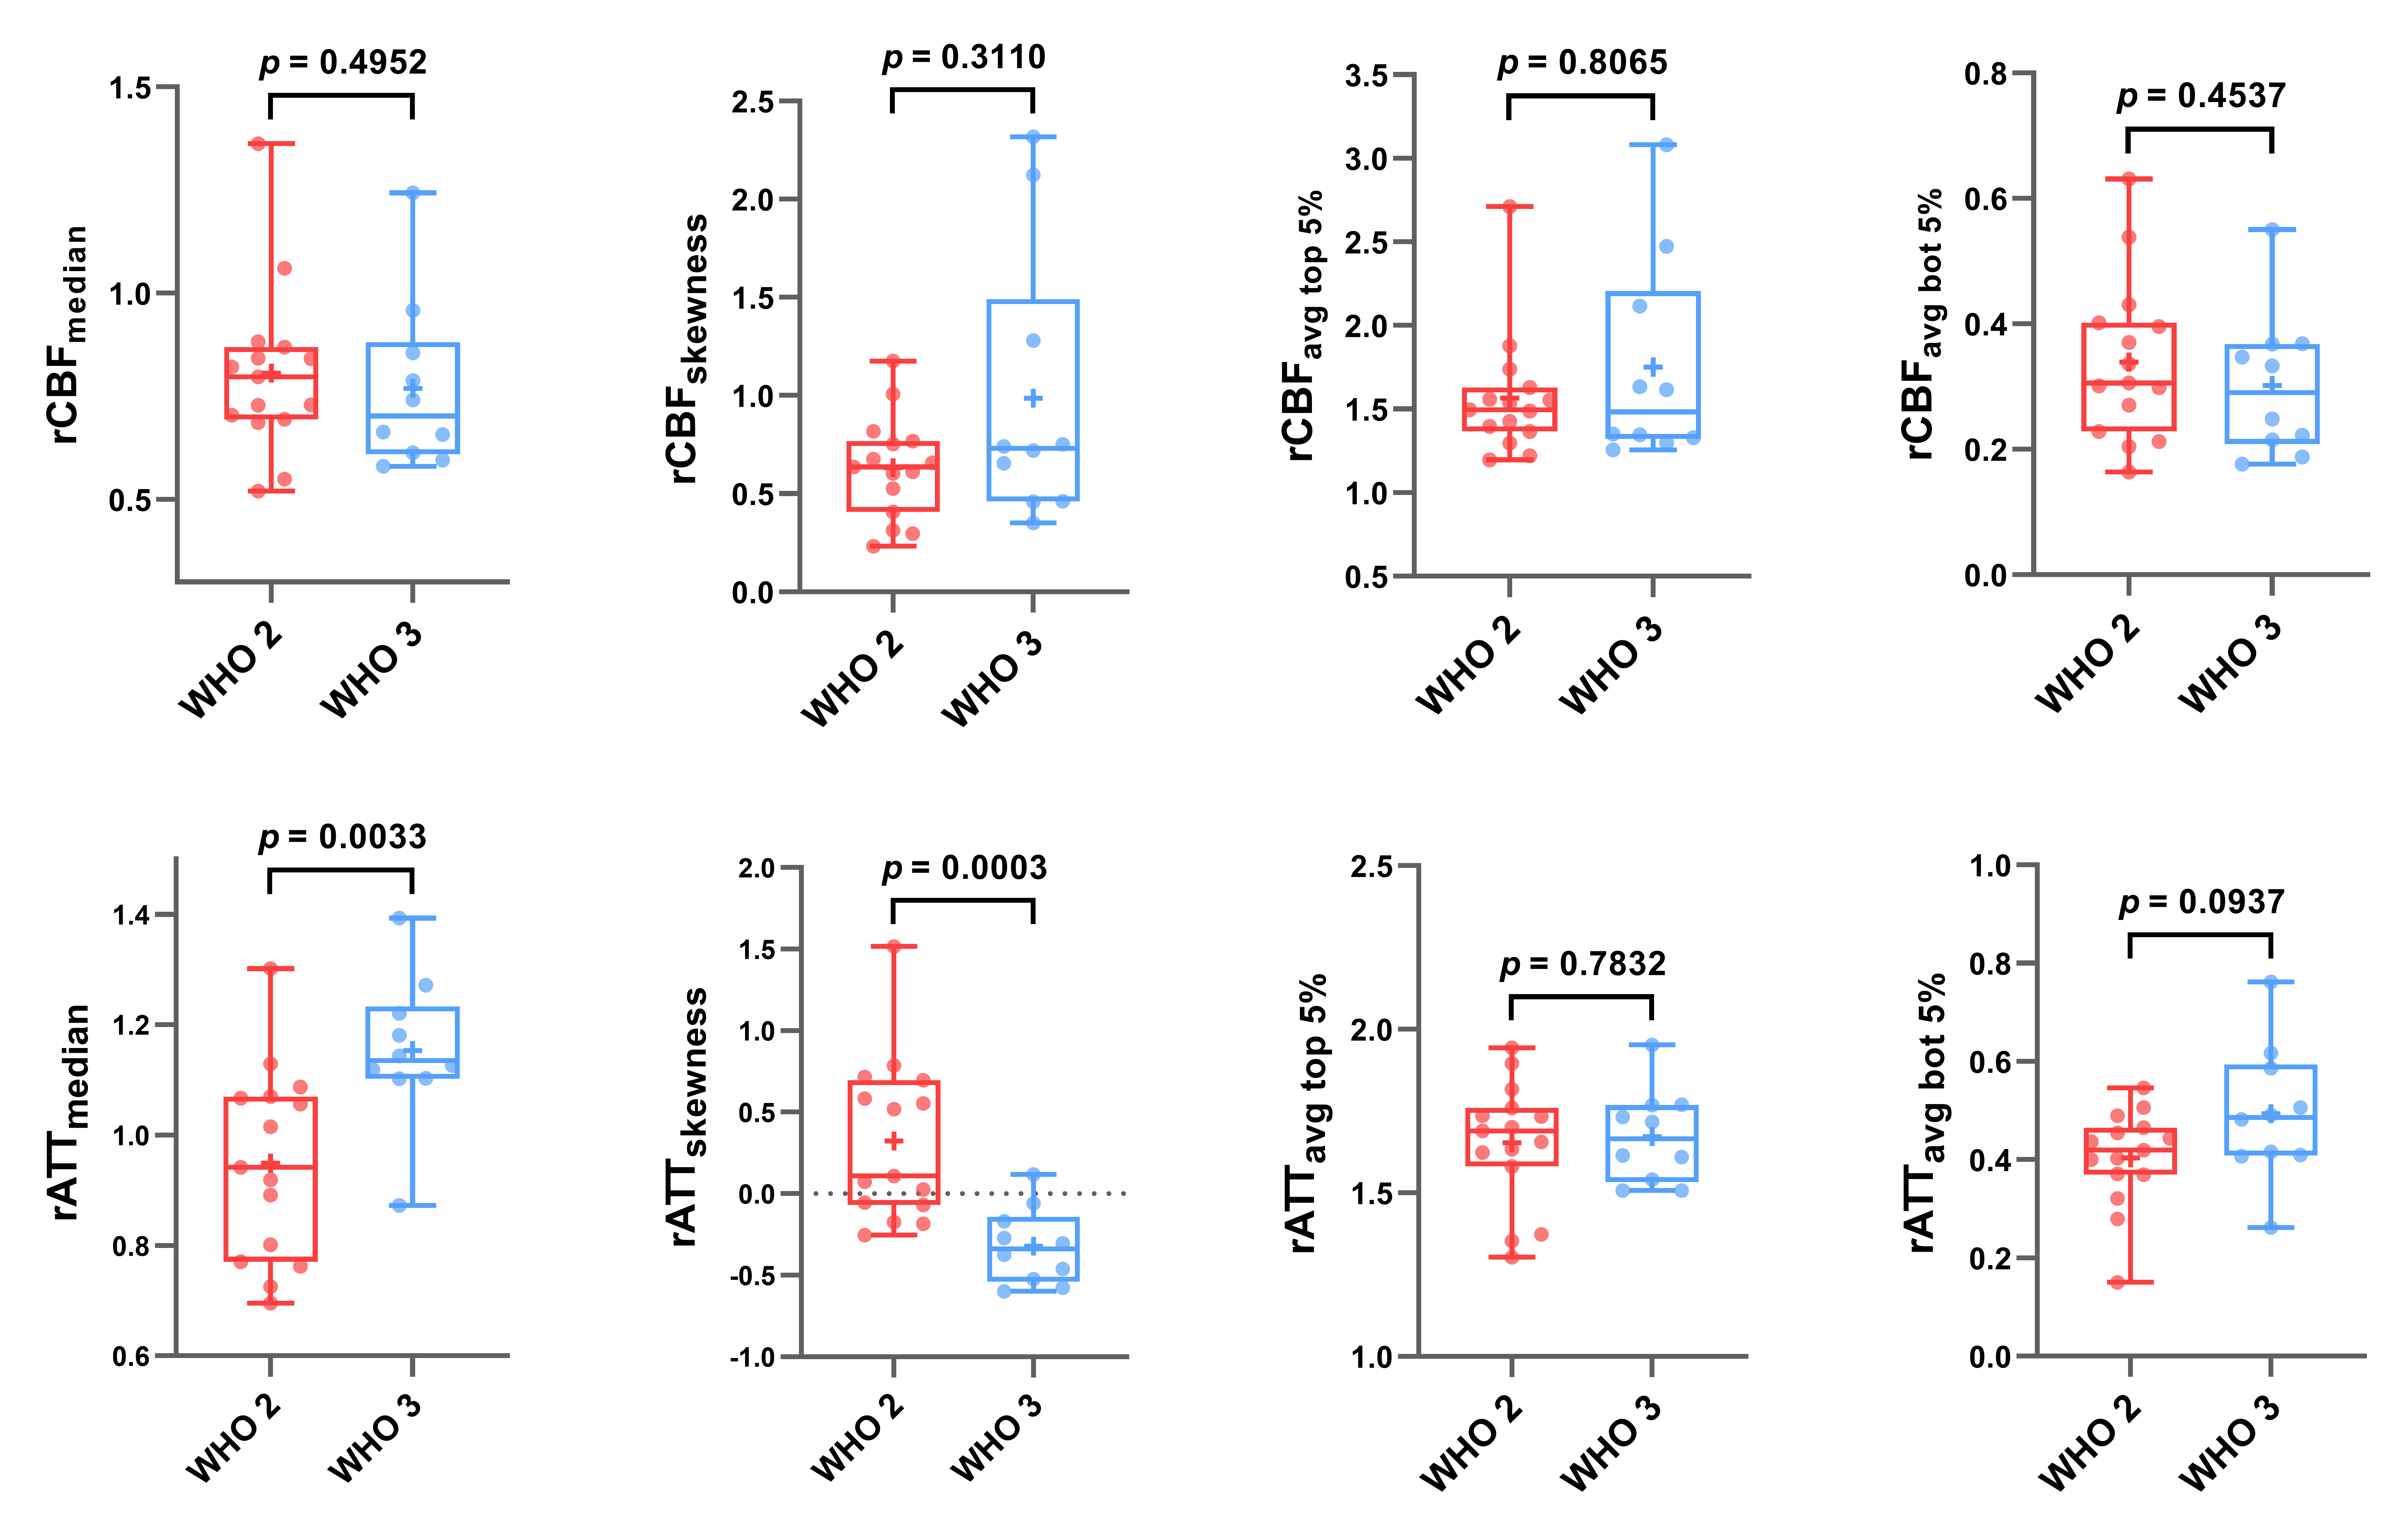
Figure 3. Box and whiskers plots of histogram-based features of rCBF and rATT for WHO grade 2 and 3 oligodendroglioma patients. The box represents the median and quantiles, and the whiskers indicate the minimum and maximum values. The mean values are shown as ‘+’. No data points were identified as outliers ( 3 SD from the mean). For multiple comparison corrections, Bonferroni corrected p value was set at 0.0125 (0.05/4).
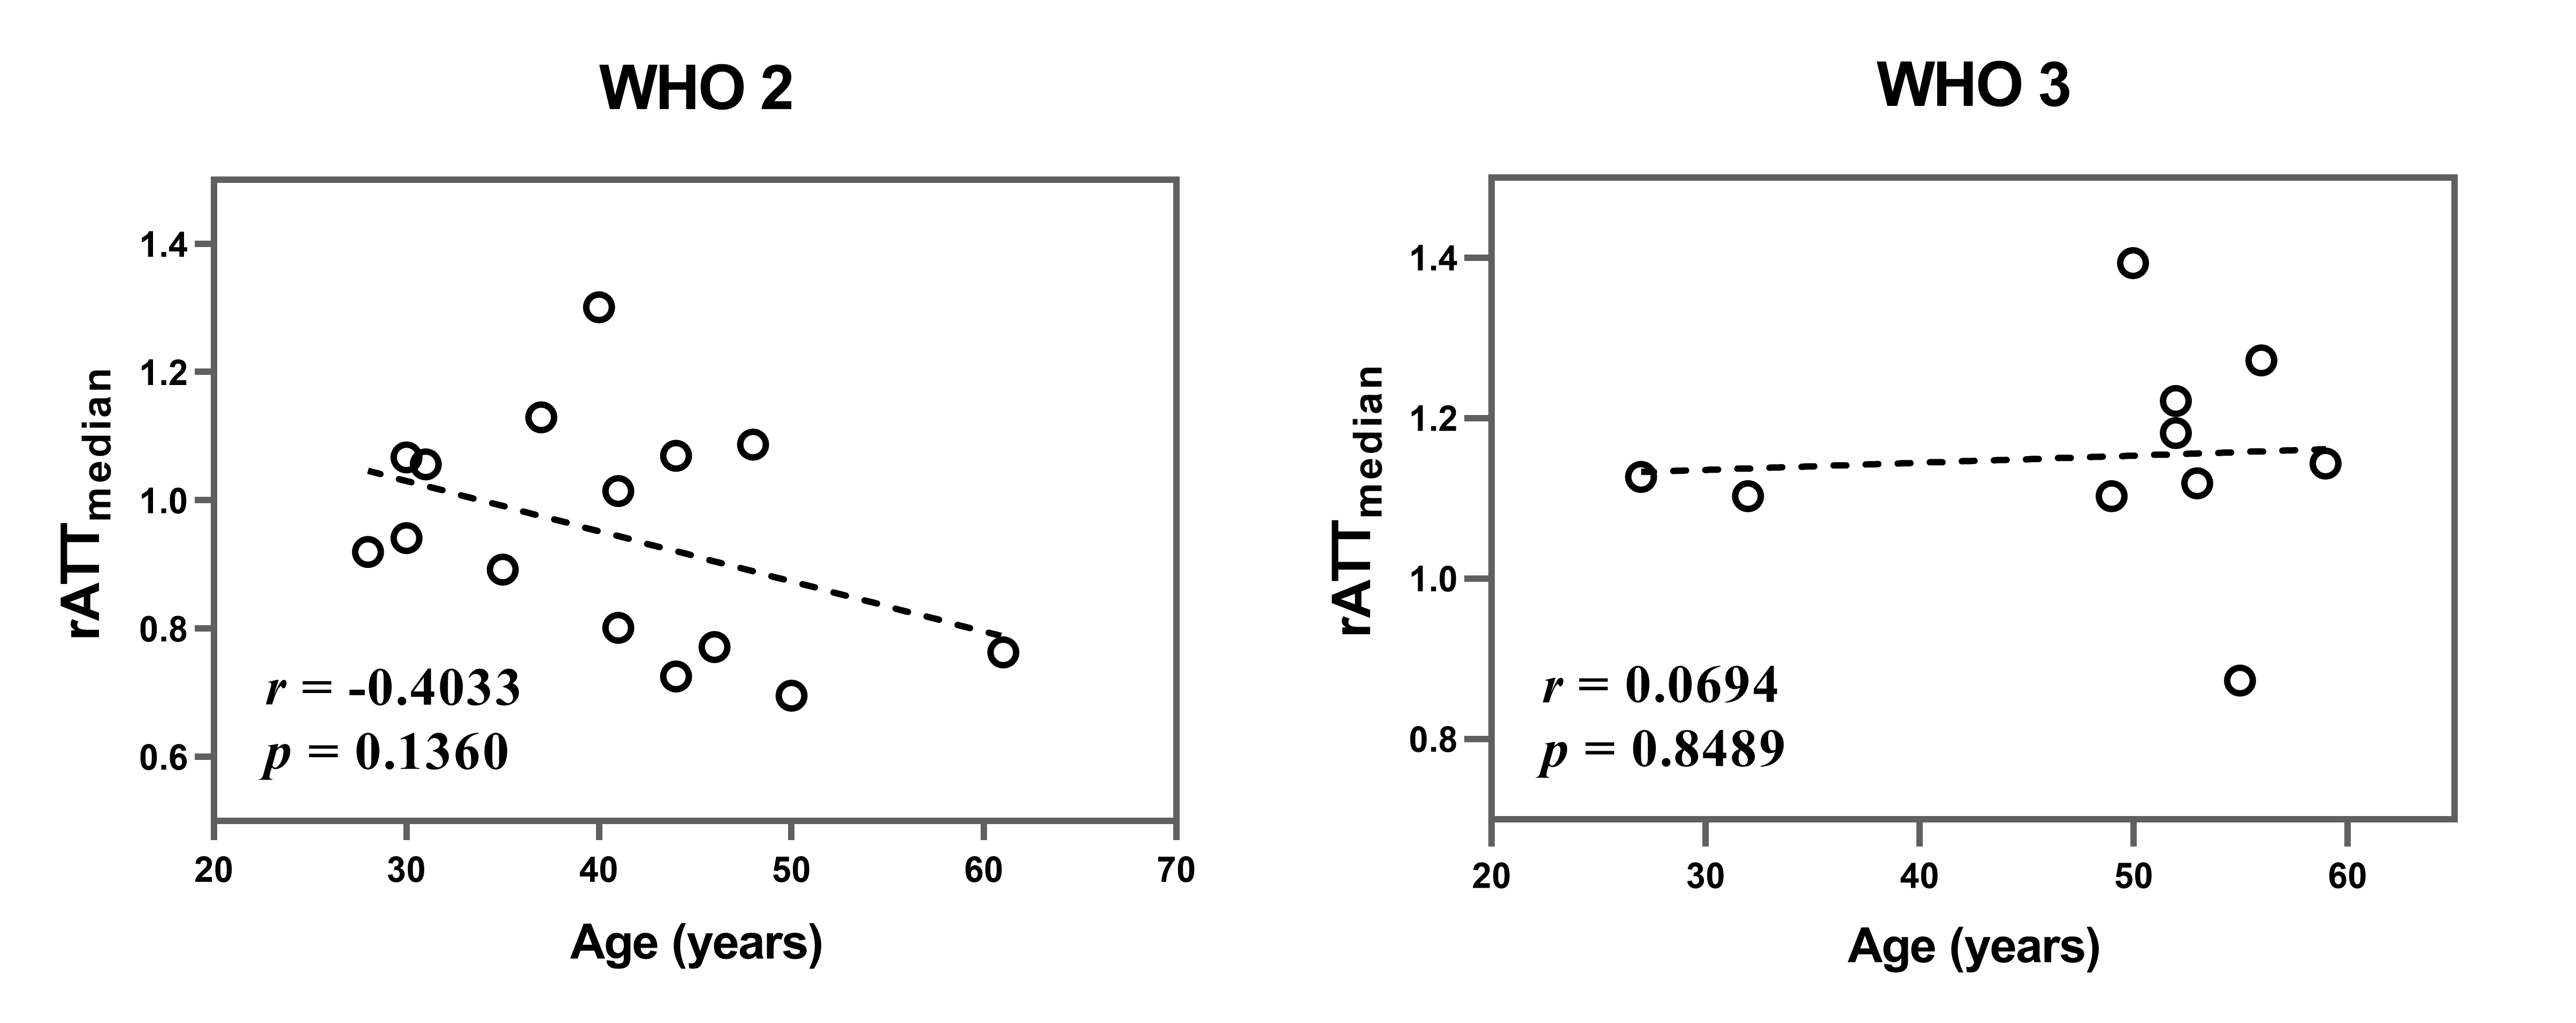
Figure 4. The plots showing the correlations between rATTmedian and age for WHO grade 2 and 3 oligodendroglioma patients respectively. Pearson correlation coefficient r (two-tailed) and p values were also displayed. The p values < 0.05 were considered statistically significant.
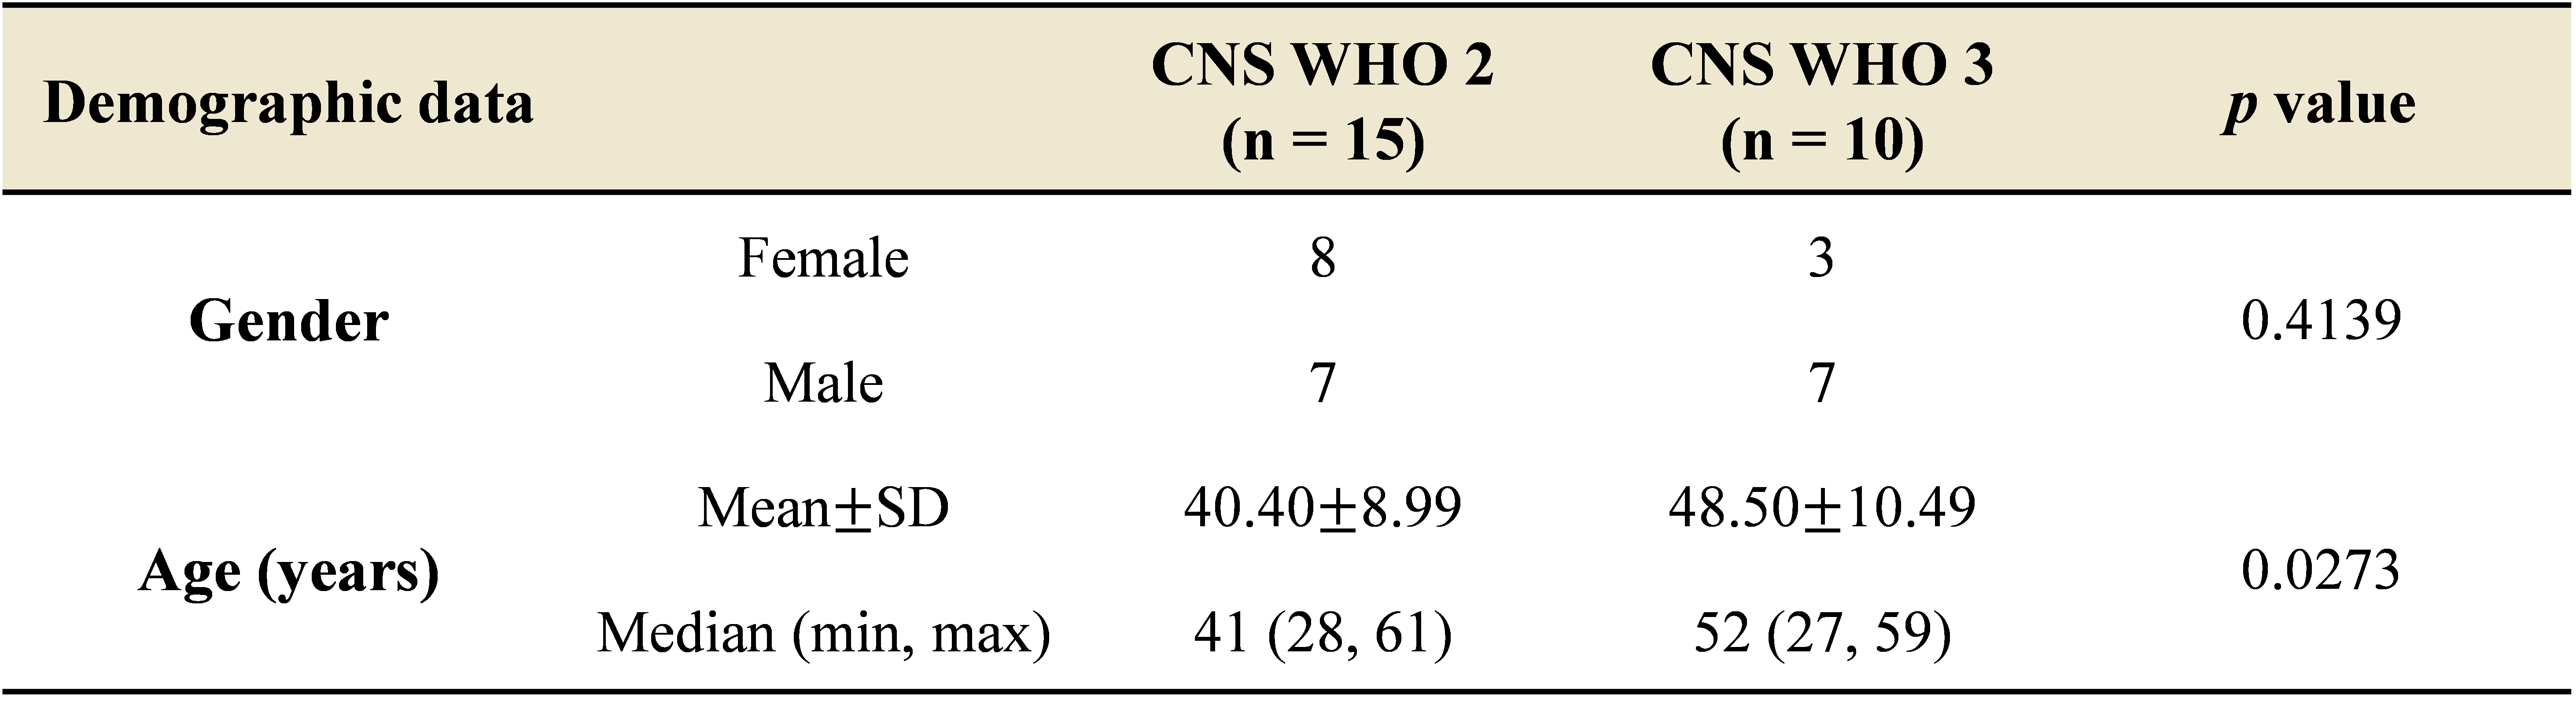
Table 1. Demographic data of oligodendroglioma patients with different WHO grades. The p values < 0.05 were considered statistically significant.