4605
A Hybrid-Two-Compartmental-Model for the Blood-Brain-Barrier Assessment of Glioma Patients1Center for Biomedical Engineering, Indian Institute of Technology Delhi, New Delhi, India, 2Fortis Memorial Research Institute, Gurugram, India, 3All India Institute of Medical Sciences New Delhi, New Delhi, India
Synopsis
Dynamic-contrast-enhanced (DCE)-MRI has shown wide potential in characterizing brain tumor. Conventionally, generalized-tracer-kinetic-model (GTKM) and Patlak-model (PM) have been widely used in clinics to characterize the blood-brain-barrier (BBB) integrity of the tumor. However, PM is recommended for DCE-MRI data with shorter duration (less than 1 minute) and GTKM may overfit in non-enhancing and normal tissues causing erroneous estimation of extra-vascular volume fraction (ve). So, the current study proposes a hybrid tissue depended model with maximum 2 model fitting parameters by combining GTKM and PM depending on underlying tissue. Proposed model has outperformed GTKM in all tissue regions.
Introduction
Dynamic-Contrast-Enhanced(DCE)-MRI has been widely used in clinics for the blood-brain-barrier(BBB) characterization of brain tumor patients1,2. Multi-compartmental models are fitted to the voxel-wise concentration-time curves(C(t)) to extract certain physiological(tracer-kinetic) parameters(TKPs) such as plasma-volume-fraction(vp), volume transfer constant(Ktrans) and extra-cellular-volume-fraction(ve)3,4. Among the different models proposed till date, generalized-tracer-kinetic-model(GTKM)5 and Patlak-model(PM)6 has been widely used in clinical settings. GTKM derived Ktrans is defined as the product of blood-flow(Fp) and permeability-surface area product(PS)7,8. In the case of contrast-enhancing(CE) tissue, Ktrans can be interpreted as PS. A reliable estimate of ve is possible in these regions due to high amount of perfusion and bidirectional flow of tracer between two compartments. However, PM computes vp and λtrans(PM derived Ktrans is defined as λtrans in this work to make it apparent) assuming an irreversible flow of CA from one compartment to the other(figure-1(a)). PM model can be a best approximation of data in regions with no contrast leakage(healthy and non-enhancing tissues of brain). Since the underlying conditions are different in enhancing and non-enhancing regions of brain, an optimized model is needed to reliably characterize the BBB permeability of whole human brain. So, in the current study, we propose a hybrid-two-compartmental-model(HTCM) by considering tissue specific model from GTKM and PM depending on the behavior of CA uptake to estimate two-compartmental TKPs more reliable and physiologically meaningful, with improved computation time on application to glioma.Methods
In figure-1(a), EES and LS are the same space, defined at two-different underlying conditions. So, according to HTCM, C(t) for the whole brain with and without CE lesions can be written as:$$$C(t) = \begin{cases}v_{p}.C_{p}(t)+ K^{trans}\int_{0}^{t_{n}}C_{p}(\tau)\exp(-K_{ep}t)d\tau & mCE (i,j) = 0\\v_{p}.C_{p}(t)+ \lambda^{trans}\int_{0}^{t_{FP}}C_{p}(\tau)d\tau & mCE(i,j) = 1\end{cases} $$$ (1.1)
Where, mCE is the binary mask of brain slice with value ‘1’ for contrast enhancing voxels and ‘0’ for non-contrast enhancing voxels including healthy brain tissues, tn and tFP are the final time point of the FP and full-length (FL) curves respectively. Figure-1(b) shows the flow diagram which describes the fitting using HTCM. It involves mainly 3 steps:
i.PM in the FP for deriving vp:PM separates IPS and LS by assuming an irreversible back-flow of tracer from IPS to LS. This stays valid in the FP(25-30 seconds after onset-time). So, in this step, fit PM to the FP-C(t) for simultaneously deriving vp and λtrans. If the current C(t) represents a pixel in contrast enhancing area(mCE(i,j)=1), then move to step-ii.
ii. GTKM for enhancing curves:Fix vp computed from step-i and consider Ktrans and Kep as free parameters and fit GTKM to FL-C(t).
iii. Final parameter estimation:For CE curves, use vp from step-i and Ktrans and ve from step-ii. For all other curves, ve is hardly relevant and use λtrans and vp computed from step-i as final parameters computed from HTCM.
So, the final output parameters are a combination of FP-PM and FL-GTKM, which we refer as HTCM. In regions with BBB leakage, HTCM acts as GTKM and in regions with low BBB(NET and healthy tissues(gray-matter(GM) and white-matter(WM))) HTCM acts as PM.
MRI data(42 high-grade-glioma patients) included conventional MRI images(2D-T1-W, dual PD-T2-W, 3D-FLAIR) and DCE-MRI data acquired at 3T(Ingenia, Philips Healthcare, The Netherlands). DCE-MRI data protocol4: 20 slices,6mm thickness,TR/TE=6.15/3ms, 10o FA, 230×230mm2 FOV, 32 time-points with 3.8s temporal-resolution. Contrast(Gd-BOPTA) of dose 0.1 mmol/kg body weight was injected at 4th time point at 3.0ml/sec injection rate. Sum of squared errors (adjusted-R2)9, Co-efficient of variation(CoV), bar graphs and box-whisker plots were used for quantitative comparison. Monte-carlo simulations were used to evaluate the noise sensitivity of parameters. Linear regression and Pearson’s correlation coefficient (CC)10 was used to evaluate the correlation of parameters between models.
Results
FL-GTKM was more reliable than FL-PM in all tissue regions. ve was highly unreliable in GM and WM, and was highly reliable in CE regions(figure-2). Noise sensitivity of GTKM and HTCM improved with data length. Ktrans and ve computed from GTKM and HTCM were in high correlation(CC>0.95)(figure-3). R2 and noise sensitivity of HTCM was better than GTKM in all tissue regions(figure-4(a)). HTCM has shown significant improvement in computation time(~40%)(figure-4(b)).Discussion
Monte-Carlo simulations of showed that ve in the GM and WM tissues has exhibited relatively larger variations compared to CE tissues. The parameters computed from HTCM and GTKM in CE regions exhibited high correlation for shorter duration(2 minutes). Here, it is interesting to note vp of HTCM is computed from the PM in the FP and it was in agreement with the vp computed across the FL(2 minute) in all tissue regions. Magnitude of ve has been stable with data length in HTCM. Ktrans computed from HTCM for longer data(6 minute) was found to be slightly lesser than GTKM. vp, on the other hand, has slightly improved in magnitude. However, these variations with data length didn’t affect the fitting accuracy and reliability of HTCM parameters. One of the major advantages while fitting the HTCM that the maximum number of parameter estimation is always two. However, it is possible to differentiate between Ktrans and λtrans depending on the underlying physiology of the representing voxel. This model has been proposed for data with shorter duration. HTCM can be considered as an optimized version of this model.Acknowledgements
Authors acknowledge Science and Engineering Research Board, Department of Science and Technology projects: YSS/2014/000092 and CRG/2019/005032 for fundingReferences
1. Wong SM, Jansen JFA, Zhang CE, et al. Measuring subtle leakage of the blood–brain barrier in cerebrovascular disease with DCE-MRI: Test–retest reproducibility and its influencing factors. J Magn Reson Imaging. 2017;46(1):159-166. doi:10.1002/jmri.25540
2. Tofts PS, du Boulay EPGH. Towards quantitative measurements of relaxation times and other parameters in the brain. Neuroradiology. 1990;32(5):407-415. doi:10.1007/BF00588474
3. Heye AK, Culling RD, Valdés Hernández MDC, Thrippleton MJ, Wardlaw JM. Assessment of blood-brain barrier disruption using dynamic contrast-enhanced MRI. A systematic review. NeuroImage Clin. 2014;6:262-274. doi:10.1016/j.nicl.2014.09.002
4. Tofts, Paul S. "T1-weighted DCE imaging concepts: modelling, acquisition and analysis." signal 500.450 (2010): 400..
5. Singh A, Haris M, Rathore D, et al. Quantification of Physiological and Hemodynamic Indices Using T 1 Dynamic Contrast-Enhanced MRI in Intracranial Mass Lesions. 2007;880:871-880. doi:10.1002/jmri.21080
6. Patlak CS, Blasberg RG, Fenstermacher JD. Graphical Evaluation of Blood-to-Brain Transfer Constants from Multiple-Time Uptake Data. 1983:1-7.
7. Sourbron SP, Buckley DL. On the Scope and Interpretation of the Tofts Models for DCE-MRI. 2011;745:735-745. doi:10.1002/mrm.22861
8. Sourbron S, Ingrisch M, Siefert A, Reiser M, Herrmann K. Quantification of cerebral blood flow, cerebral blood volume, and blood-brain-barrier leakage with DCE-MRI. Magn Reson Med. 2009;62(1):205-217. doi:10.1002/mrm.22005
9. Sasi S D, Gupta RK, Patir R, Ahlawat S, Vaishya S, Singh A. A comprehensive evaluation and impact of normalization of generalized tracer kinetic model parameters to characterize blood-brain-barrier permeability in normal-appearing and tumor tissue regions of patients with glioma. Magn Reson Imaging. 2021;83:77-88. doi:10.1016/J.MRI.2021.07.005
10. Tofts, Paul, ed. Quantitative MRI of the brain: measuring changes caused by disease. John Wiley & Sons, 2005.
Figures
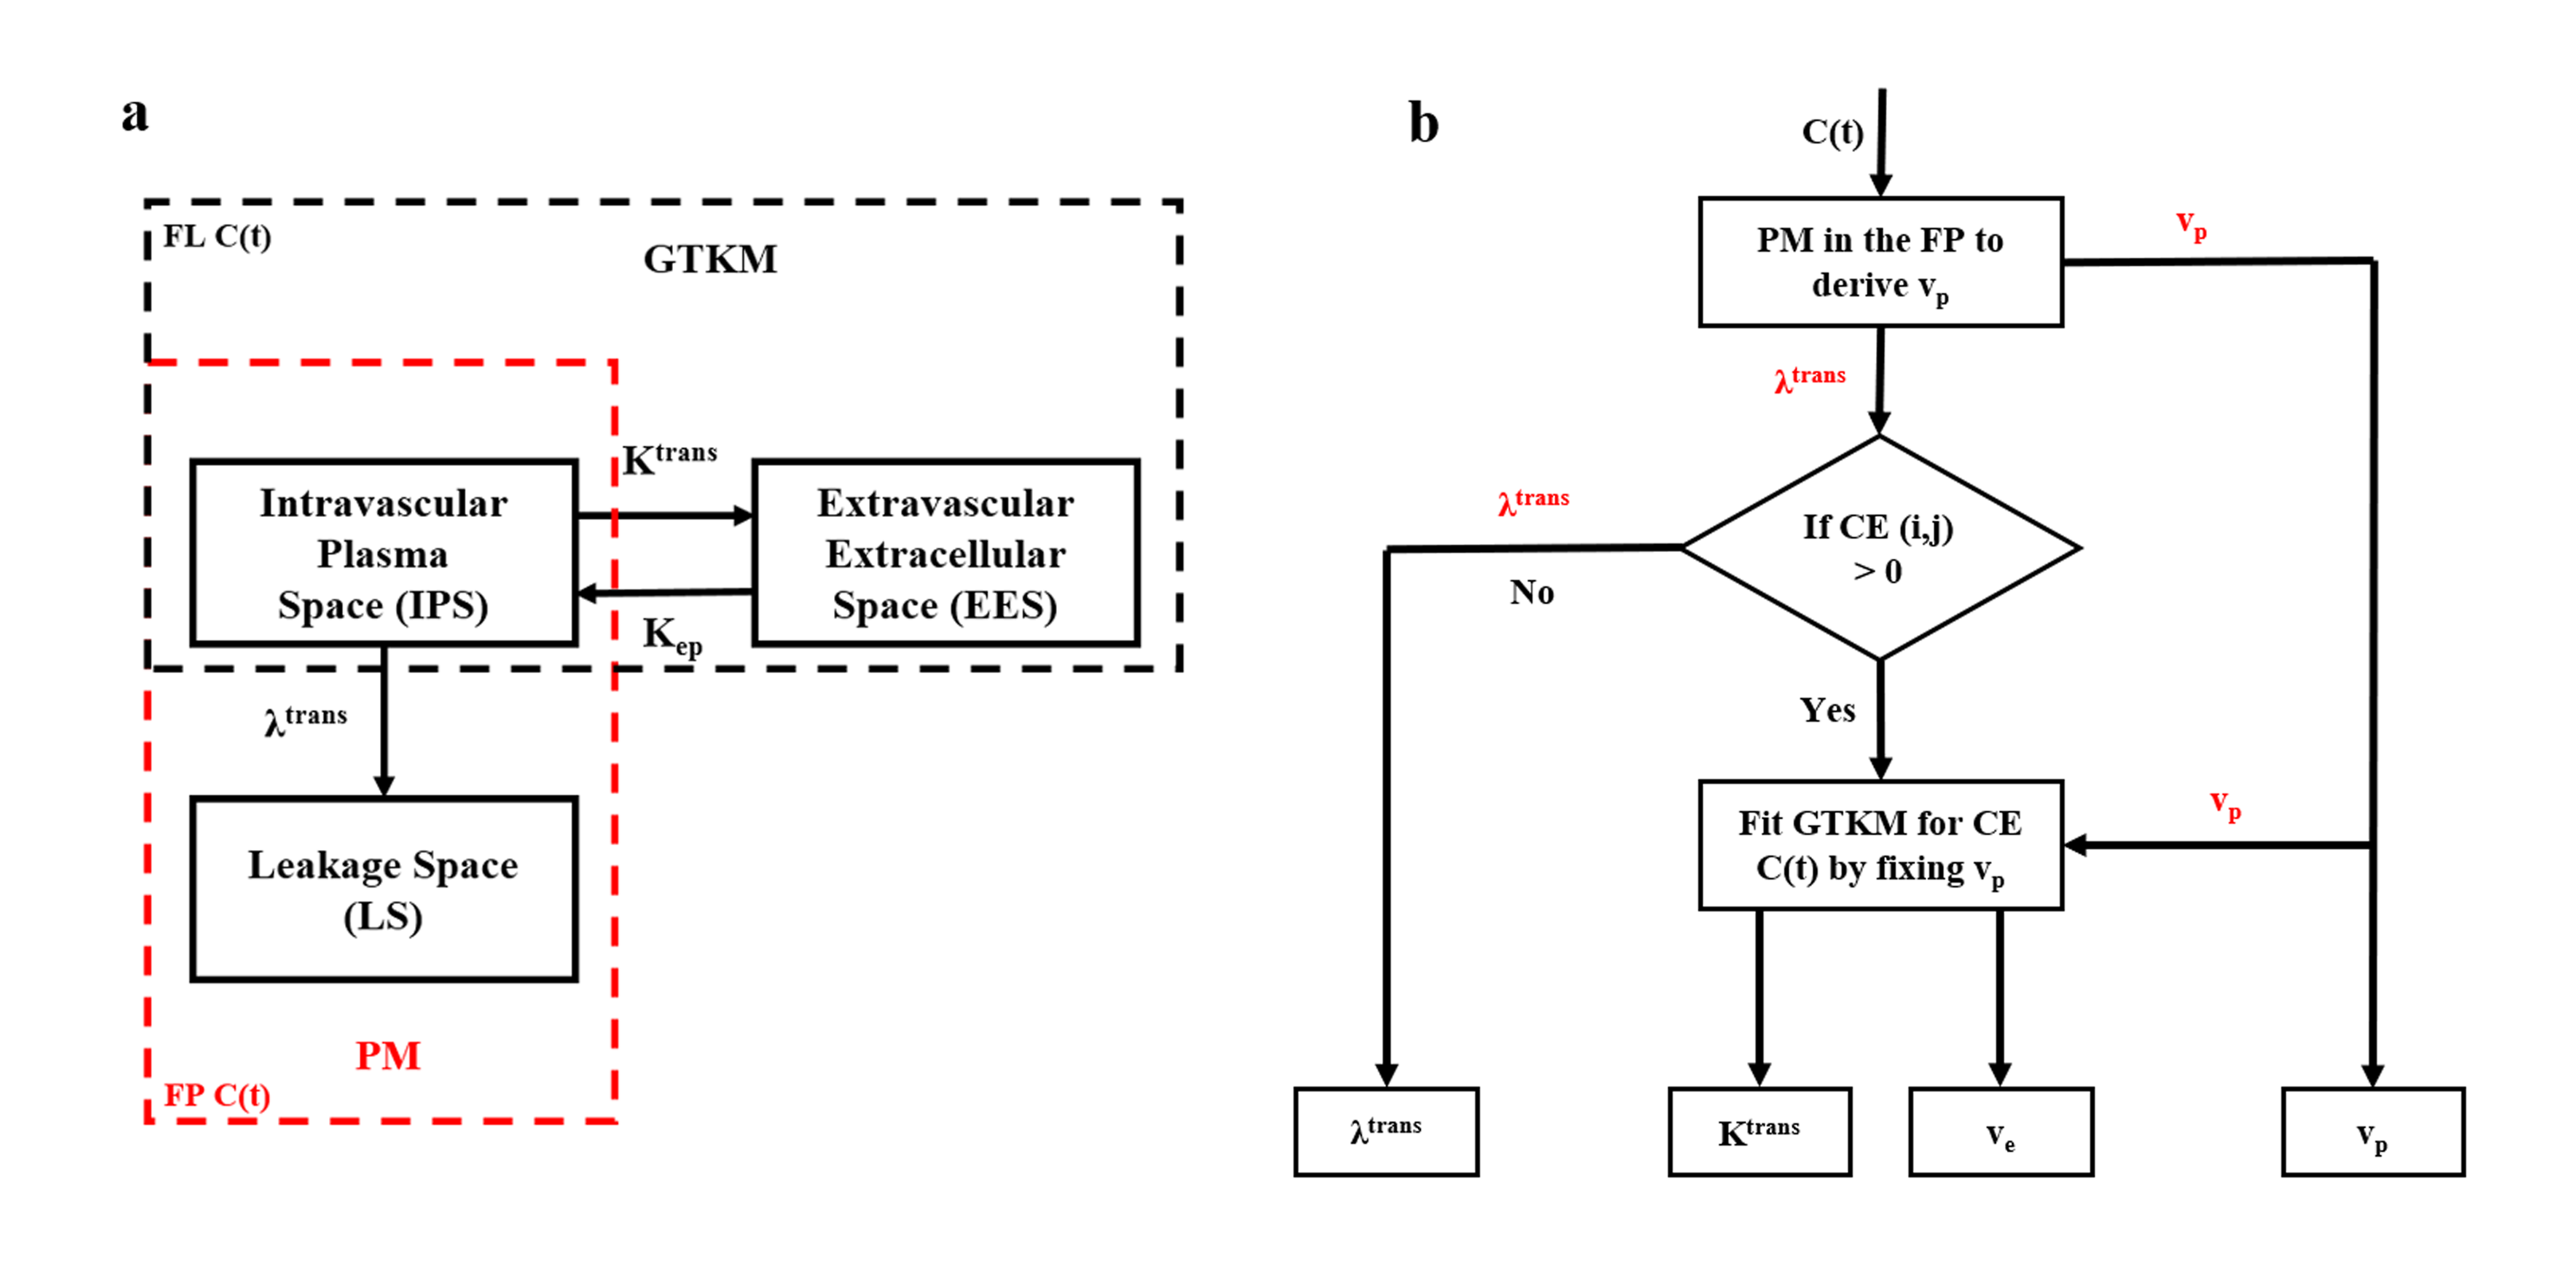
Figure-1(a): Compartmentalization of PM (red box) and GTKM (black box). HTCM is the combination of these 2 models depending on the contrast uptake in respective tissues,(b) Flow chart of HTCM. In contrast enhancing regions (CE), GTKM (full length (FL)) is fitted to C(t) by fixing vp computed from first pass (FP) using PM. In non-enhancing regions, it utilizes PM in the FP
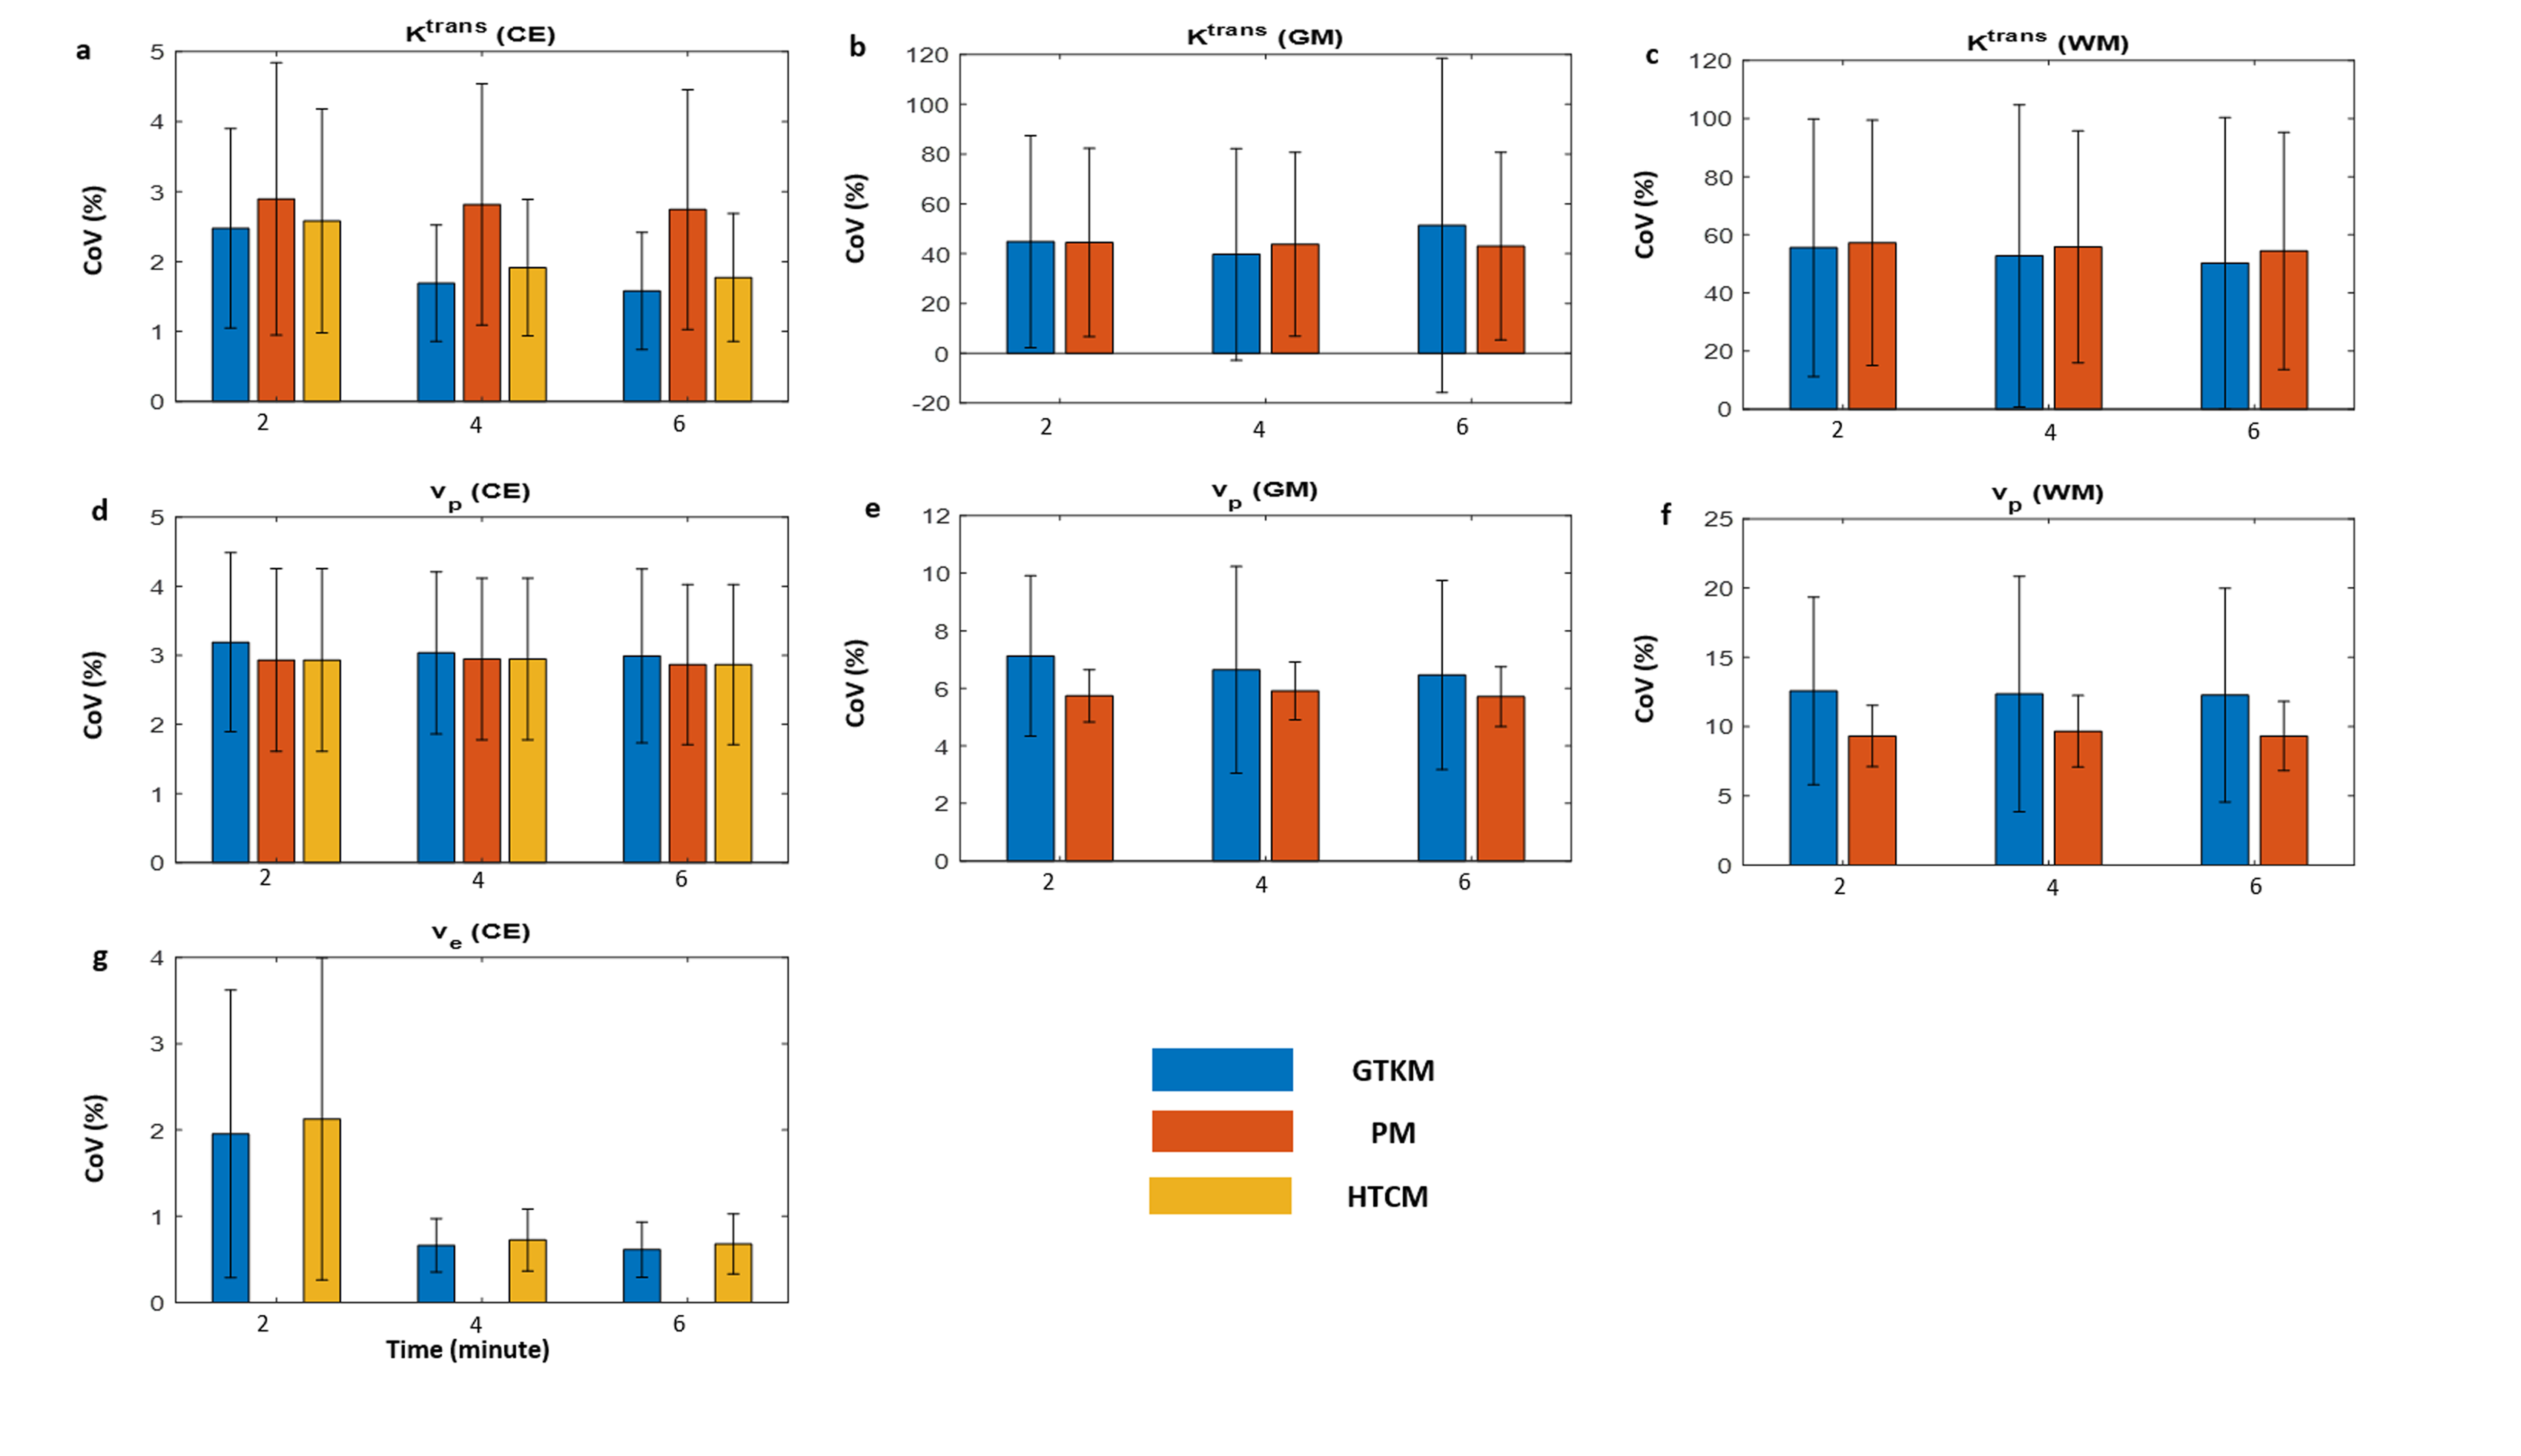
Figure-2: Bar diagrams show the results of Monte-Carlo simulation for noise sensitivity of PM (FP), GTKM (FL) and HTCM (FL) parameters in CE, GM and WM.

Figure-3: Scatter plot showing the correlation of (a) vp, (b) Ktrans and (c) ve computed using HTCM and GTKM (CC = correlation coefficient and Y denotes the straight line fitting the data).
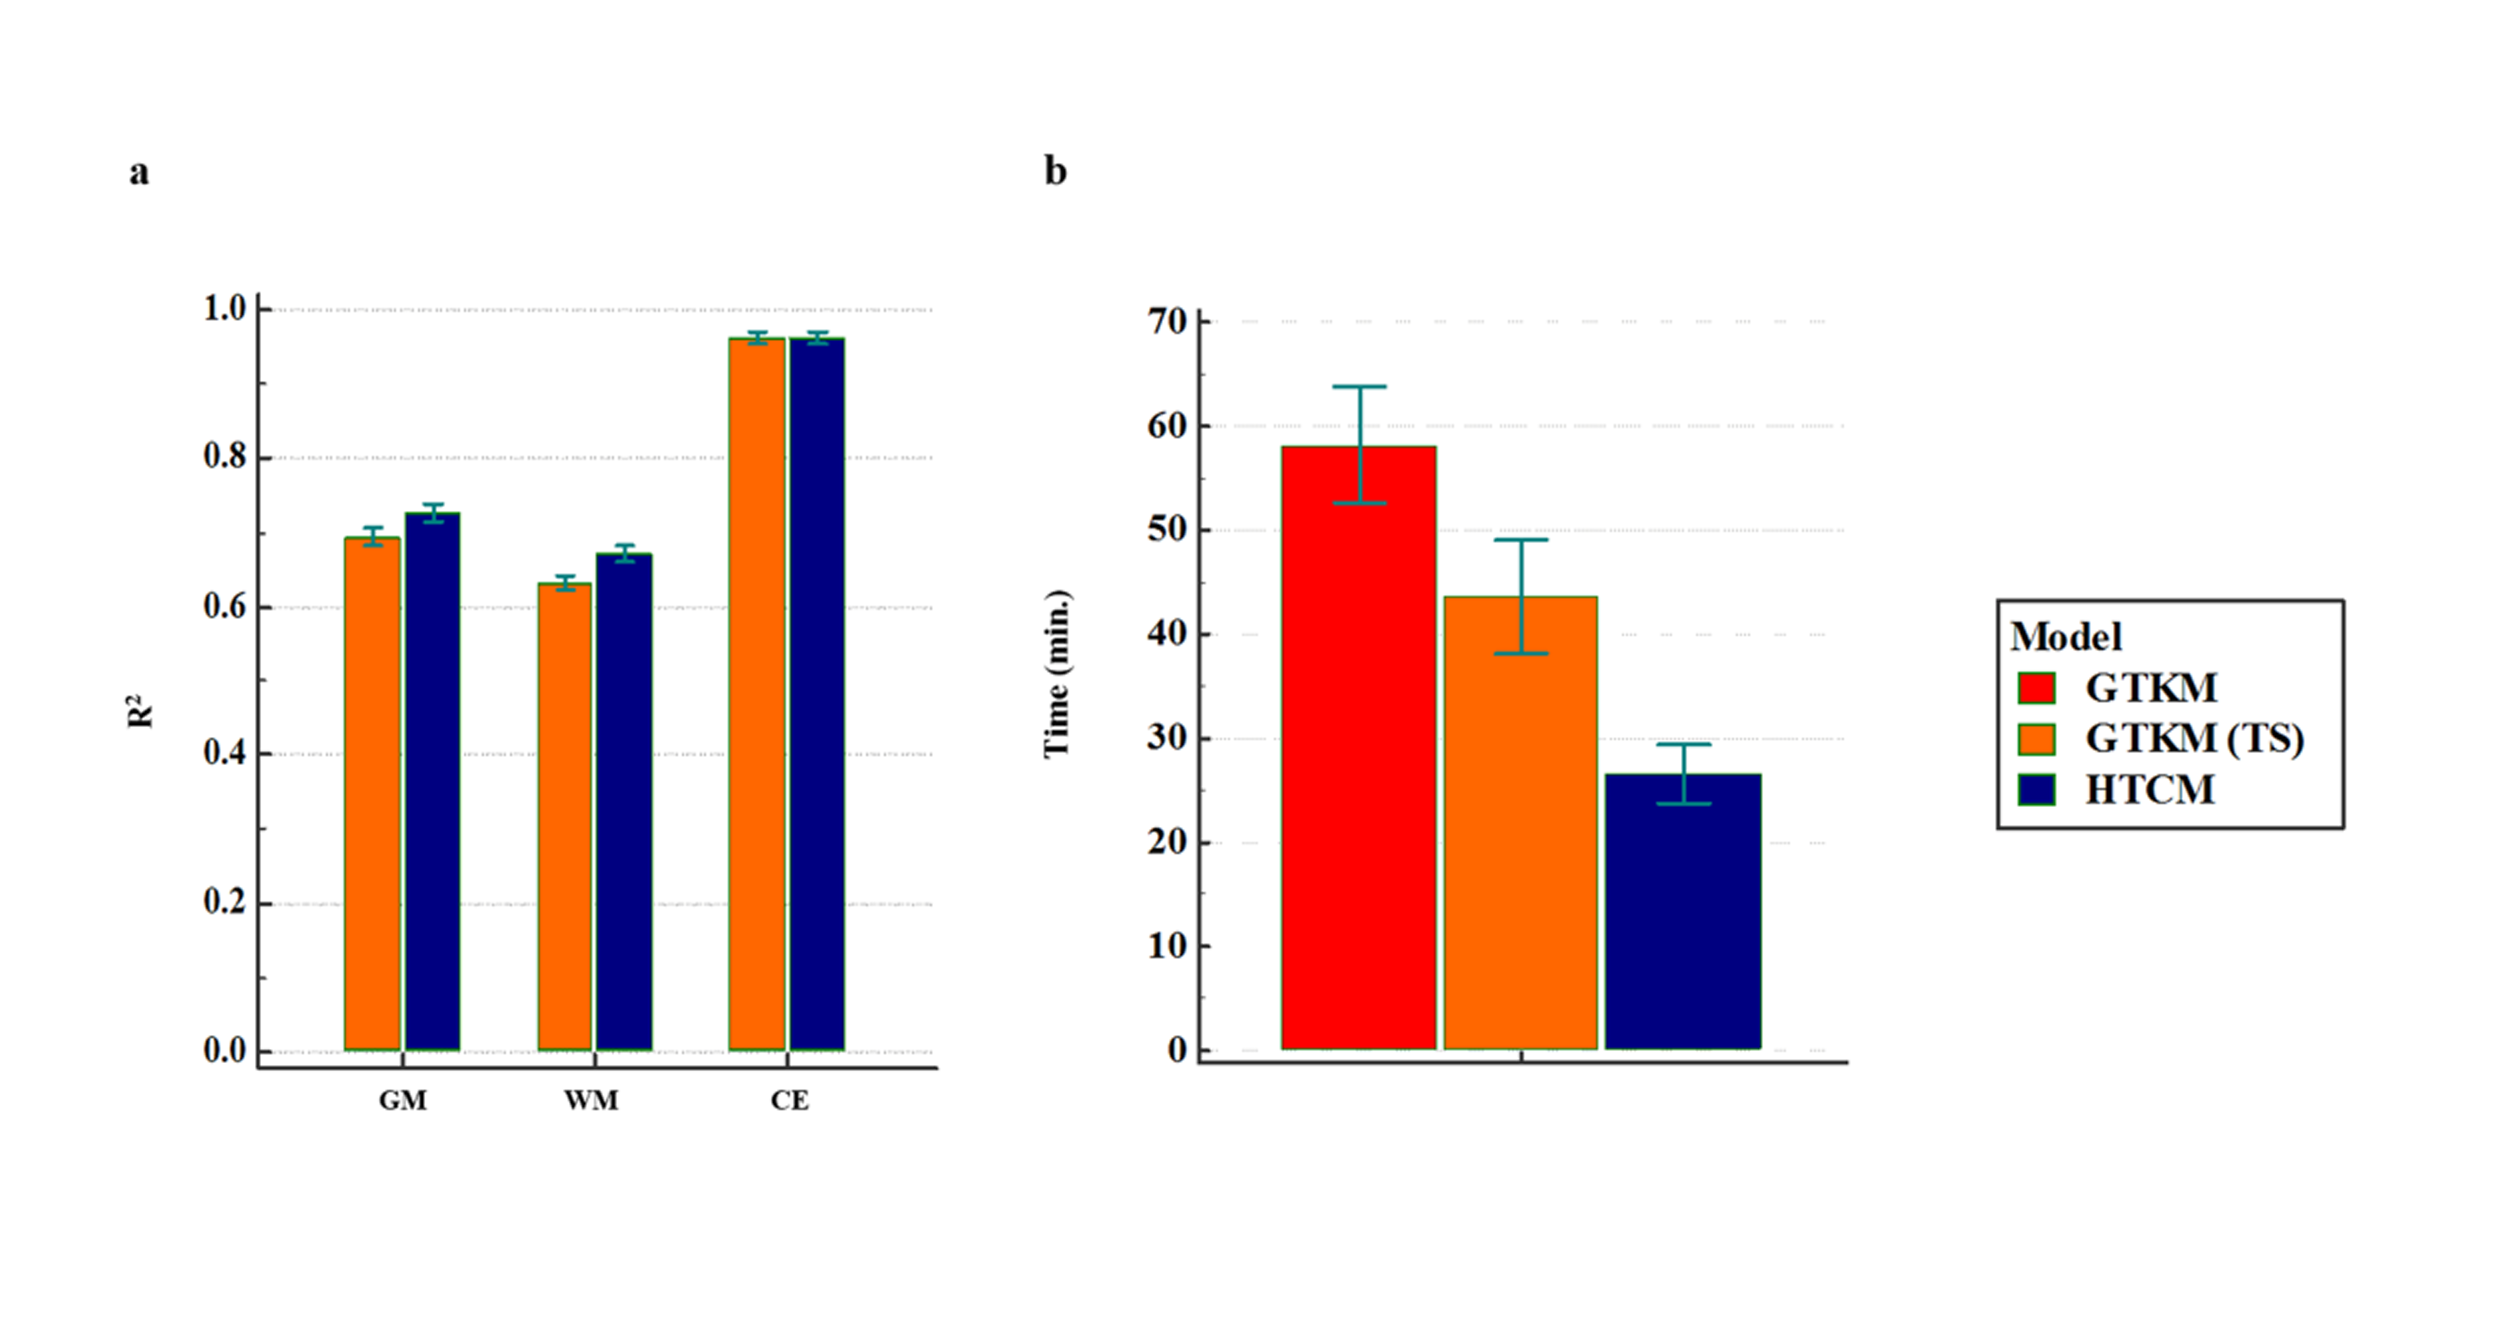
Figure-4: Bar diagrams (a) mean R2 computed at gray matter (GM), white matter (WM) and contrast enhancing (CE) regions using GTKM and HTCM, (b) time for model fitting for GTKM and HTCM.