4597
3D Large-Coverage Simultaneous QUantitative T1-T2-T2* Mapping (LC-SQUMA) of Carotid Vessel Wall
Huiyu Qiao1, Qiansu Yang2, Shuo Chen1, Zihan Ning1, Hualu Han1, Rui Shen1, Peng Wu3, Huijun Chen1, and Xihai Zhao1
1Center for Biomedical Imaging Research, Department of Biomedical Engineering, School of Medicine Tsinghua University, Beijing, China, 2Center of Medicine Clinical Research, Department of Pharmacy, Medical Supplies Center of PLA General Hospital, Beijing, China, 3Philips Healthcare, Shanghai, China
1Center for Biomedical Imaging Research, Department of Biomedical Engineering, School of Medicine Tsinghua University, Beijing, China, 2Center of Medicine Clinical Research, Department of Pharmacy, Medical Supplies Center of PLA General Hospital, Beijing, China, 3Philips Healthcare, Shanghai, China
Synopsis
MR T1-, T2-, and T2*- mapping have been used to characterize carotid plaques. In this study, we realized a 3D Large-Coverage (longitudinal coverage: 160 mm) Simultaneous QUantitative T1-T2-T2* Mapping (LC-SQUMA) sequence with 0.8 mm isotropic spatial resolution. The LC-SQUMA sequence showed excellent agreements with reference imaging in measuring T1 (R2=0.96), T2 (R2=0.85) and T2* (R2=0.90) values. No significant difference was found in measuring T1, T2 and T2* values (all P>0.05) of cervical muscle between LC-SQUMA sequence and clinical referenced quantitative imaging sequences. The 3D LC-SQUMA sequence is feasible in the large-coverage carotid vessel wall quantitative imaging with isotropic spatial resolution.
Introduction
MR multi-contrast vessel wall imaging is proved to be an ideal noninvasive modality for evaluating carotid vulnerable plaques characterized by compositional features such as lipid-rich necrotic core and intraplaque hemorrhage.1 Since plaque compositions are identified on MR images according to their signal intensity on different contrast images and the signal intensity is mainly dependent on the value of T1, T2 or T2* relaxation, MR quantitative imaging has been used to identify carotid plaque compositions by quantifying T1, T2 and T2* values of each pixel which may reflect the microstructure of carotid plaque compositions. 2,3 Hence, we previously proposed a three-dimensional (3D) simultaneous quantitative T1-T2-T2* mapping (SQUMA) sequence for the carotid vessel wall.4 However, the longitudinal coverage of the proposed SQUMA sequence is only 40 mm with the inter-slice resolution of 2 mm which is insufficient to assess atherosclerotic diseases occurring in more proximal and more distal segments to the bifurcation of carotid arteries. In this study, we optimized the carotid 3D SQUMA sequence to realize a large-coverage and isotropic high spatial resolution quantitative imaging (LC-SQUMA) and determined its feasibility in in-vivo imaging.Methods
Sequence optimization: The 3D SQUMA sequence was composed of five dynamic scans with 5 seconds interval to ensure the recovery of magnetization (Figure 1). 4 Variable flip angles, different improved motion sensitized driven equilibrium (iMSDE) preparation time, and multiple TEs were adopted in five dynamic scans to quantify T1, T2 and T2* values, respectively. In the sequence optimization, compressed sensing-sensitivity encoding reconstruction (CS-SENSE) was introduced for enlarging the longitudinal coverage from 40 mm to 160 mm within the acceptable scan time. Furthermore, the spatial resolution was improved from non-isotropic (0.8×0.8×2.0 mm3) to isotropic (0.8×0.8×0.8 mm3) resolution and the water-fat shift was adjusted from 1.6 to 2.0 to reach the best signal-to-noise ratio of carotid vessel wall. Finally, the 3D LC-SQUMA imaging can be performed within 10 minutes after utlizing CS-SENSE. The detailed imaging parameters of 3D LC-SQUMA are shown in Table 1.B1 correction: To obtain the actual flip angle for the T1 calculation, an additional B1 mapping scan (Table 1) was performed and resampled with spline interpolation.
Phantom experiments: The reference T1, T2 and T2* maps of phantom were determined by inversion recovery (IR) spin echo with different IR time, spin echo with 9 echo time and gradient echo with 25 echo time, respectively. The 3D SQUMA sequence was also scanned for phantom.
Volunteer experiments: Four healthy subjects (34.3±15.6 yrs, 3 males) were recruited in this study. The 3D LC-SQUMA sequence and clinical referenced quantitative T1-, T2- and T2*- mapping sequences (Table 2) were acquired for all subjects on a 3.0 T MR scanner (Ingenia CX, Philips Healthcare, Best, the Netherlands) with the dedicated 8-channel carotid coil and 32-channel head coil.
Data analysis: All images obtained from 3D LC-SQUMA were registered by a retrospective motion correction on Elastix5 with a non-rigid principle component analysis-based groupwise registration6 using B-spline interpolator. The T1, T2 and T2* maps of phantom and in-vivo subjects from 3D LC-SQUMA sequence were fitted using Matlab 2020a (MathWorks, Inc. Natick, Massachusetts, USA). The T1, T2 and T2* values of carotid vessel wall were recorded.
Statistical analysis: Linear correlation analysis was used to evaluate the agreement of quantitative mapping based on 3D SQUMA sequence and reference methods in phantom studies. The paired t test was used to assess the differences in measuring T1, T2 and T2* values of cervical muscle between 3D LC-SQUMA sequence and clinical referenced quantitative T1-, T2- and T2*- mapping sequences.
Results
Phantom measurements: In phantom imaging, excellent agreements were found in measuring the values of T1 (R2=0.96), T2 (R2=0.85) and T2* (R2=0.90) between 3D SQUMA sequence and reference imaging. (Figure 2)In-vivo measurements: In the carotid vessel wall imaging of four health subjects, the T1, T2 and T2* values of carotid vessel wall were 993.1±66.5 ms, 42.8±5.6 ms, and 22.8±2.9 ms, respectively. There was no significant difference in measuring T1 (1052.6±38.1 ms vs. 1051.4±38.5 ms, P=0.93), T2 (30.3±0.9 ms vs. 31.1±1.4 ms, P=0.24) and T2* (21.5±1.0 ms vs. 21.7±1.3 ms, P=0.58) values of cervical muscle between 3D LC-SQUMA sequence and clinical referenced quantitative imaging sequences. Figure 3 shows 3D LC-SQUMA original images and T1, T2 and T2* maps of a representative slice from a 57-year-old female subject.
Discussion and Conclusion
For the optimized 3D LC-SQUMA sequence in this study, the B1 map was acquired using dual flip angles method and the blood was suppressed using MSDE. More novel methods can be used for the B1 map acquisition and blood suppression.7,8 In addition, the calculation of T2* map revealed the possibility to generate quantitative susceptibility map (QSM) and proton density map using 3D LC-SQUMA sequence in the future. In conclusion, the 3D LC-SQUMA sequence is feasible in the large-coverage carotid vessel wall quantitative imaging with isotropic spatial resolution.Acknowledgements
None.References
- Cai JM, Hatsukami TS, Ferguson MS, et al. Classification of human carotid atherosclerotic lesions with in vivo multicontrast magnetic resonance imaging. Circulation. 2002;106:1368-1373.
- Qiao H, Li D, Cao J, et al. Quantitative evaluation of carotid atherosclerotic vulnerable plaques using in vivo T1 mapping cardiovascular magnetic resonance: validation by histology. J Cardiovasc Magn Reson. 2020;22:38.
- Chai JT, Biasiolli L, Li L, et al. Quantification of Lipid-Rich Core in Carotid Atherosclerosis Using Magnetic Resonance T2 Mapping: Relation to Clinical Presentation. JACC Cardiovasc Imaging. 2017;10:747-756.
- Qiao H, Chen S, Ning Z, et al. Three-Dimensional Simultaneous Quantitative T1-T2-T2* Mapping of Carotid Vessel Wall: Sequence Design and In-vivo Feasibility. In the proceeding of 32nd SMRA Annual International Conference #43.
- Klein S, Staring M, Murphy K, Viergever MA, Pluim J. Elastix: a toolbox for intensity-based medical image registration. IEEE Trans Med Imaging. 2010;29:196-205.
- Huizinga W, Poot D, Guyader J-M, et al. PCA-based groupwise image registration for quantitative MRI. Med Image Anal. 2016;29:65-78.
- Gavazzi S, van den Berg CAT, Sbrizzi A, et al. Accuracy and precision of electrical permittivity mapping at 3T: the impact of three B1+ mapping techniques. Magn Reson Med. 2019;81:3628-3642.
- Li L, Miller KL, Jezzard P. DANTE-prepared pulse trains: a novel approach to motion-sensitized and motion-suppressed quantitative magnetic resonance imaging. Magn Reson Med. 2012;68:1423-1438.
Figures

Figure
1. Diagram
of the 3D SQUMA sequence.
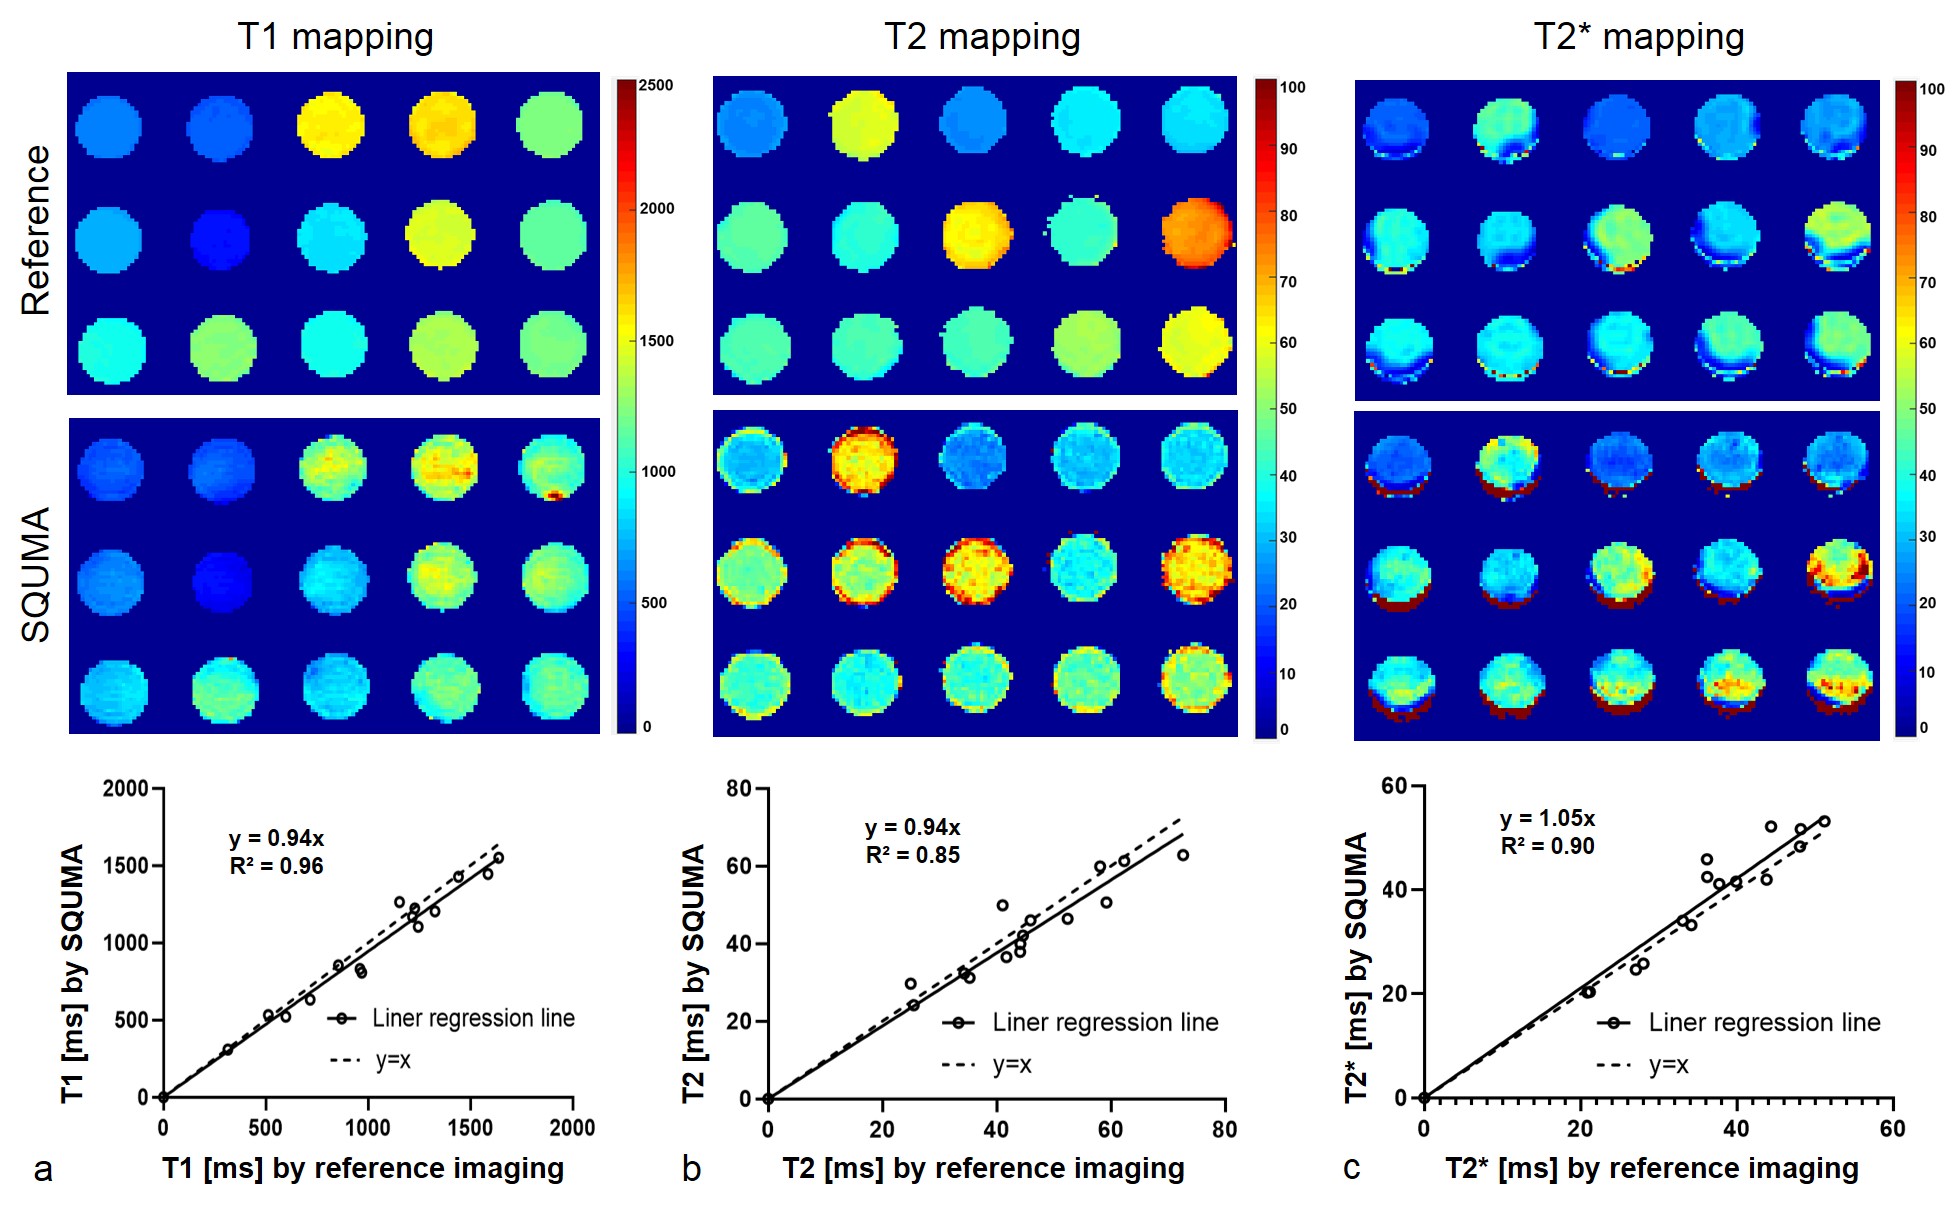
Figure
2. The linear regression lines of the T1 maps (a),
T2 maps (b) and T2* maps (c) derived from SQUMA sequence and the reference
method (inversion
recovery spin echo, multi-echo spin echo and multi-echo gradient echo sequence)
in phantom experiments.

Figure 3. 3D
LC-SQUMA original images (a,b) and T1, T2 and T2* maps (c) of a representative
slice from a 57-year-old female subject.
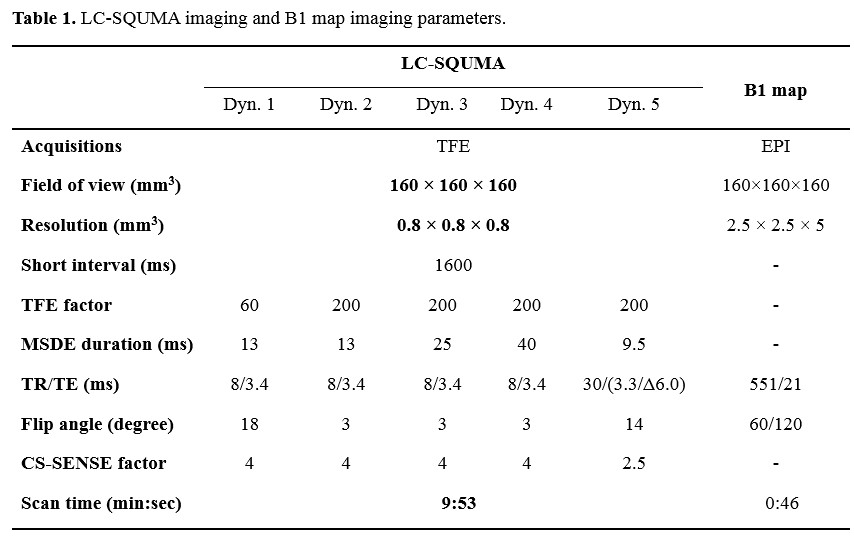
Table
1.
LC-SQUMA imaging and B1 map imaging parameters.

Table
2.
The imaging parameters of clinical referenced quantitative T1-, T2- and T2*-
mapping.
DOI: https://doi.org/10.58530/2022/4597