4585
Cerebrovascular Reactivity Mapping using General Linear Model in Frequency Domain1University of Southern California, Los Angeles, CA, United States, 2Children's Hospital Los Angeles, Los Angeles, CA, United States
Synopsis
Cerebrovascular reactivity (CVR), measuring the ability of vessel dilation or constriction, is an important indicator of cerebrovascular health. As a parameter describing the hemodynamic changes, CVR requires a physiological challenge as the stimulus and monitors the response of the brain metabolism. We propose a frequency-based approach, which applies general linear model (GLM) on the magnitude of the stimulus and response spectrum to avoid challenges with signal alignment and improve robustness to noise in CVR estimation.
Introduction
Cerebrovascular reactivity (CVR), measuring the ability of vessel dilation or constriction in response to a stimulus, is an important indicator of cerebrovascular health1. CVR typically uses a metered physiological challenge such as acetazolamide injection or carbon dioxide (CO2) inhalation, although measures can also be derived from endogenous fluctuations in end-tidal CO2 levels2. CO2 inhalation has been increasingly used as the stimulus in CVR study because it is well-tolerated, efficiently produces vasodilation and is compatible with magnetic resonance imaging (MRI). Blood oxygen level dependent (BOLD) MRI, is commonly used to record the cerebrovascular response1 because of its speed and brain coverage. CVR is often calculated from the linear fit between CO2 stimulus and MRI signal response in the time-domain, assuming the brain is a linear time-invariant system1. However, this requires temporal alignment of the input and output signals, which can be difficult, when the signal is noisy or distorted. To avoid signal misalignment, modeling-based methods3,4 are proposed, but they need a designed stimulus paradigm, typically, a sinusoidal or block input signal. In this article, we propose a frequency-based approach, which applies general linear model (GLM) in the magnitude of the signal spectrum, to avoid challenges with signal alignment and improve robustness to noise in CVR estimation.Methods
CVR analysis: In a CVR study with CO2 challenge, CVR can be defined by the following equation: $$CVR = \frac{\Delta(MRI\:measurement)}{\Delta{EtCO_2}}\qquad(1)$$ where $$$\Delta(MRI\:measurement)$$$ and $$$\Delta{EtCO_2}$$$ represent the changes of MRI signal and end-tidal CO2 between baseline and hypercapnic measurements. Let $$$y(t)$$$ be the MRI response, $$$x(t)$$$ be the CO2 stimulus, and $$$\tau$$$ be the voxelwise delay between the MRI and CO2 signals. According to equation (1), we can have: $$y(t-\tau)=CVR\cdot{x(t)}\qquad(2)$$ Apply Fourier transform on both side: $$Y(\omega)e^{-j\omega\tau}=CVR\cdot{X(\omega)}\qquad(3)$$ If we only consider the magnitude and apply a general linear model: $$\mid{Y(\omega)}\!\mid=CVR\cdot\mid\!{X(\omega)}\mid+c+\varepsilon\qquad(4)$$ where $$$\mid{Y(\omega)}\mid$$$ and $$$\mid{X(\omega)}\mid$$$ are the magnitudes, $$$c$$$ is the estimated intercept, and $$$\varepsilon$$$ is the estimated error. Therefore, the CVR is estimated only by the magnitude, and the effect of signal time shifting is eliminated. Note that equation (4) estimates the mean of the gain in each frequency, which differs from the gain of transfer function2.Data description and preprocessing: 24 BOLD MRI (TR/TE = 1500/30 ms) scans were acquired using a 3T Philips Achieva D-Stream with a 32 element head coil. The BOLD images were registered to MNI space and slice-time corrected using FSL5 and AFNI6. The corresponding CO2 stimulus were recorded by RespirAct. We use a 4-cycle sinusoidal paradigm of CO2 with a peak-to-peak amplitude of 5 torr and a period of 1 minute. The CO2 sinusoid was biased +5 torr from the resting end-tidal CO2, such that CO2 fluctuations range from 0 to 10 torr greater than resting end-tidal CO2. The CO2 data was resampled and interpolated at the BOLD sampling.
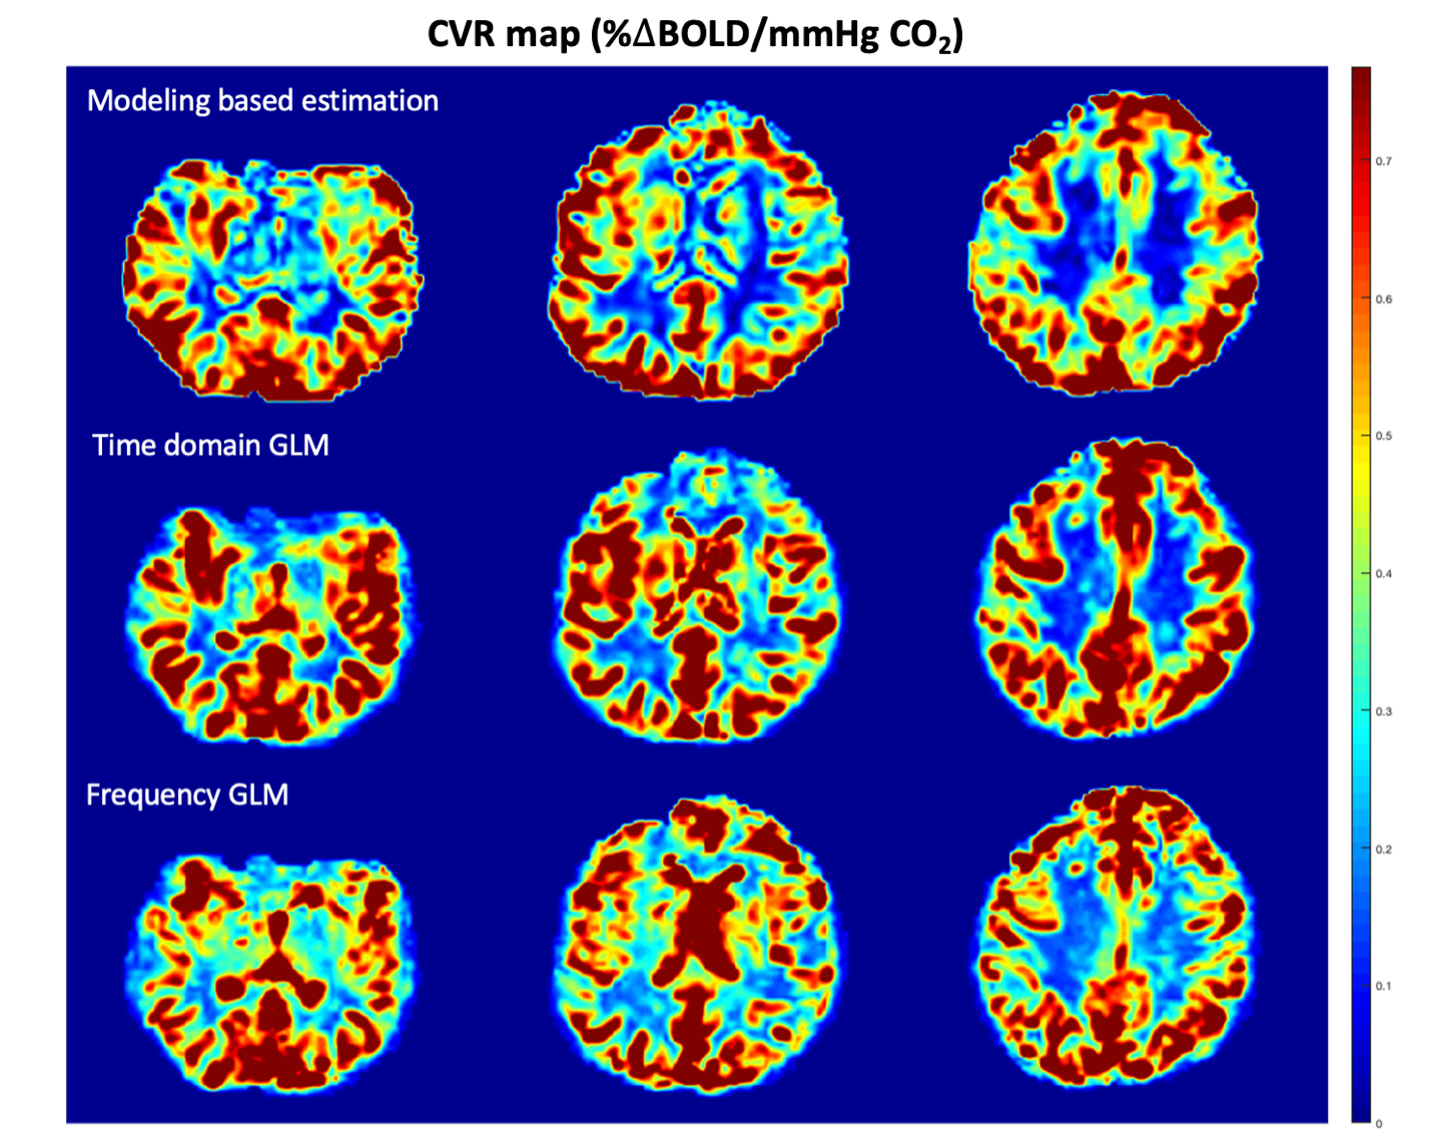
Evaluation: We compared our method with a modeling-based approach4 and time domain general linear model estimation1. All the algorithms are running at voxel by voxel, and Figure 1 shows an example of the color-coding CVR map comparison. For each subject, we calculate the mean CVR of white matter and gray matter, respectively. One sample T-test and Bland-Altman plot7 are used to pairwise compare our method with other two.
Results and Discussion
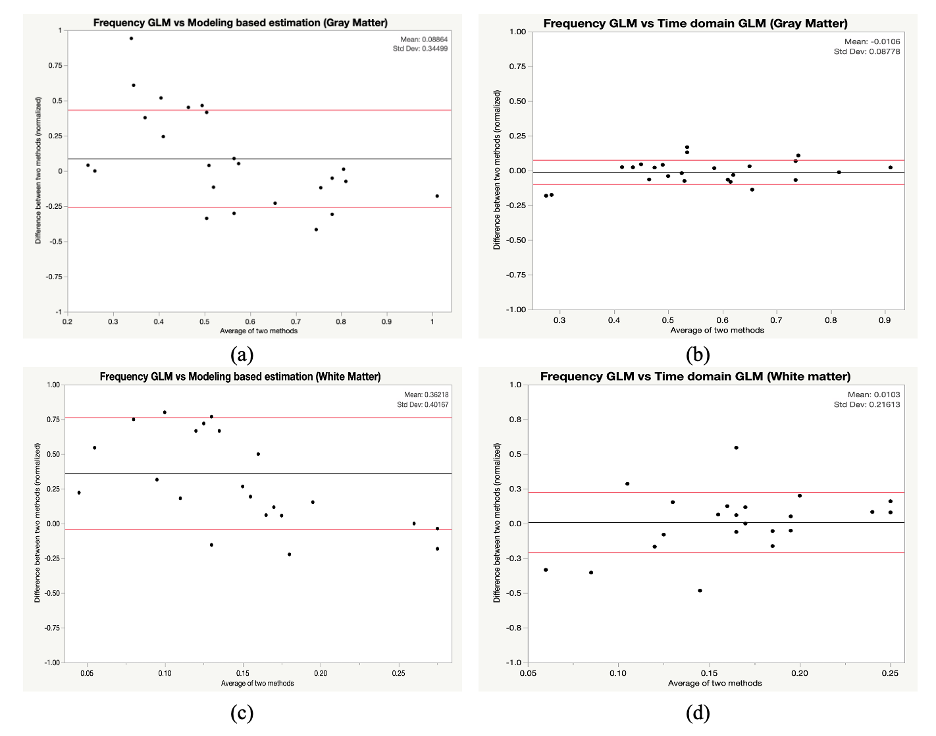
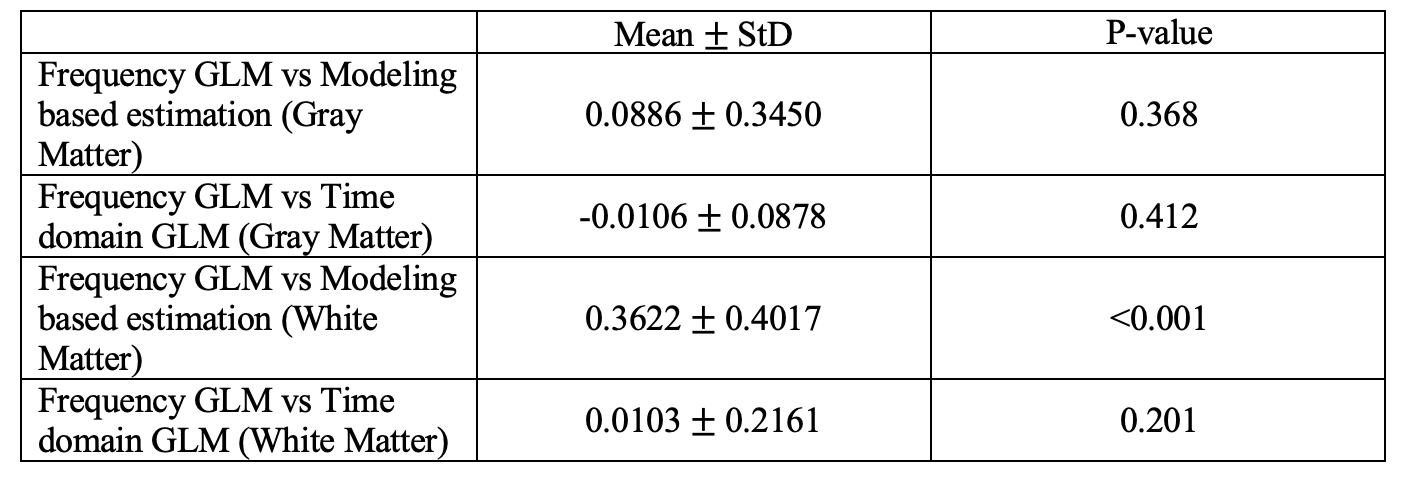
Figure 2 shows the relative Bland-Altman plot between our frequency GLM and the other two methods. The method differences are normalized to their average value. Table 1 summarizes the mean and standard deviations of these comparisons. The time and frequency based GLMs (Figure 2b, 2d) are unbiased with one another in both the gray and white matter and have limits of agreement of 18% and 42%, respectively. In contrast, the limits of agreement between the model-based and frequency GLM in the gray and white matter are much broader, measuring 70% and 81%, respectively. Model-based CVR (Figure 2a, 2c) is greater than frequency-based GLM (8.8% and 36.2%), but this difference was only significant in the white matter; similar disagreements were observed between the model based and time-domain GLM (not shown).The close agreement between time and frequency-based GLM’s was expected because they are duals of one-another and it is relatively easy to align the powerful, sinusoidal BOLD fluctuations using correlation analysis. However, frequency domain GLM does not require signal alignment, making it better suited to noisier signals where temporal alignment is more challenging.
The disagreement between both GLM methods and the model-based method likely arises from measurement and system non-idealities. The modeling-based method is designed to fit a specific signal shape, the performance highly depends on the fidelity of signals as well as system linearity. Large errors caused by signal distortion will enlarge the difference with other non-modeling-based methods. And it is worse when estimating the CVR of white matter, because the white matter has a longer group delay8, which could make signals more noisy.
Conclusion
We have validated frequency-domain GLM against time-domain GLM using a powerful CO2 stimulus paradigm where time-domain GLM performs exceedingly well. We postulate that frequency-domain GLM will more robust than time-domain GLM for less powerful CO2 stimuli where temporal alignment is challenging. The disagreement between GLM and model-based methods requires further exploration before concluding superiority or inferiority of either technique.Acknowledgements
This work was supported by the Additional Ventures Single Ventricle Fund, National Heart, Lung, and Blood Institute (grant 1U01-HL-117718-01, 1R01-HL136484-01A1), and the National Center for Research (5UL1-TR000130-05) through the Clinical Translational Science Institute at Children’s Hospital Los Angeles. Philips Healthcare provided support for protocol development and applications engineering on a support-in-kind basis. Chau Vu was supported by a Research Career Development Fellowship from the Saban Research Institute at Children’s Hospital Los Angeles.References
1. Liu P, Jill B, Lu H. Cerebrovascular reactivity (CVR) MRI with CO2 challenge: a technical review. Neuroimage. 2019 Feb 15;187:104-15.
2. Duffin J, Sobczyk O, Crawley AP, Poublanc J, Mikulis DJ, Fisher JA. The dynamics of cerebrovascular reactivity shown with transfer function analysis. Neuroimage. 2015 Jul 1;114:207-16.
3. Blockley NP, Driver ID, Francis ST, Fisher JA, Gowland PA. An improved method for acquiring cerebrovascular reactivity maps. Magnetic resonance in medicine. 2011 May;65(5):1278-86.
4. Blockley NP, Harkin JW, Bulte DP. Rapid cerebrovascular reactivity mapping: Enabling vascular reactivity information to be routinely acquired. Neuroimage. 2017 Oct 1;159:214-23.
5. Jenkinson M, Beckmann CF, Behrens TE, Woolrich MW, Smith SM. NeuroImage. Fsl. 2012;62(2):782-90.
6. Cox RW. AFNI: software for analysis and visualization of functional magnetic resonance neuroimages. Computers and Biomedical research. 1996 Jun 1;29(3):162-73.
7. Altman DG, Bland JM. Measurement in medicine: the analysis of method comparison studies. Journal of the Royal Statistical Society: Series D (The Statistician). 1983 Sep;32(3):307-17.
8. Thomas BP, Liu P, Park DC, Van Osch MJ, Lu H. Cerebrovascular reactivity in the brain white matter: magnitude, temporal characteristics, and age effects. Journal of Cerebral Blood Flow & Metabolism. 2014 Feb;34(2):242-7.
Figures