4582
Correlation Analysis between BOLD Delay and Cerebral Blood Flow: A Study in Moyamoya Patients1GE Healthcare, Beijing, China, 2Tiantan Neuroimaging Center of Excellence, Beijing Tiantan Hospital, Capital Medical University, Beijing, China, 3China National Clinical Research Center for Neurological Diseases, Beijing, China, 4Department of Neurosurgery, Beijing Tiantan Hospital, Capital Medical University, Beijing, China
Synopsis
It has been shown that the BOLD delay calculated from resting-state fMRI can reveal perfusion information. In this study, the correlation between BOLD delay and CBF measured from ASL were explored. The results showed the inter-subject correlation between BOLD delay and CBF values. Meanwhile, the inter-group differences of the correlation coefficients between Moyamoya patients and healthy controls were also compared.
Introduction
Resting-state functional MRI (rs-fMRI) is a useful tool for identifying functional abnormalities by analyzing blood oxygen level dependent (BOLD) signals, from which regional neuronal activities can be objectively detected (1). Meanwhile, the temporal properties of the BOLD signals were also investigated in many studies, with one of the most well-studied index as BOLD delay, which is the delay in the arrival of systemic low-frequency oscillations (sLFOs) to a certain voxel compared to a reference region (2). The physiological basis for BOLD delay lies in axial variations in the concentration of deoxyhemoglobin within arteries and veins caused by vasomotion or changes in oxygen saturation, which can reflect the perfusion properties of the brain (3). Previous studies have compared BOLD delay with different perfusion modalities, such as dynamic susceptibility contrast MRI (DSC-MRI) (4-6) and arterial spin labeling (ASL) (7,8). In this study, the correlation between BOLD delay calculated from rs-fMRI and CBF measured from arterial spin labeling (ASL) (9) was explored. The inter-group differences between Moyamoya patients and healthy controls of the correlation coefficients were also compared.Methods
MRI data were acquired using a 3.0-Tesla MR system (SIGNA Premier, GE Medical Systems, Milwaukee, WI) using a 48-channel head coil. The imaging protocol includes T1w-MPRAGE, rs-fMRI and ASL perfusion imaging. Seventy-four subjects were recruited and provided with informed consent, including 31 healthy volunteers (33.5±10.4 years old) and 43 patients with Moyamoya (39.6±10.6 years old). All subjects were asked to remain still during all sessions, and keep eyes open during the resting-state fMRI session. Earplugs were used for noise reduction and foam pads were used for minimizing head motion. T1w volumetric images were acquired using the MP-RAGE sequence with 1 mm isotropic resolution (sagittal acquisition, FOV = 256 mm, acquisition matrix = 256, slice number = 192, flip angle = 8°, preparation time = 880ms, recovery time = 400 ms, acceleration factor = 2, acquisition time = 4:00). Resting-state fMRI were acquired using the multi-band BOLD sequence with 2.4 mm isotropic resolution (transverse acquisition, FOV = 208 mm, acquisition matrix = 86, slice number = 65 with a multi-band factor = 6, flip angle = 64°, TE/TR =39/1000 ms, no in-plane acceleration or slice gap, time point = 330). Perfusion imaging were acquired using 3D pseudo-continuous ASL sequence with background suppression (transverse acquisition, FOV = 240 mm, resolution =3.8 ×3.8 mm2, slice thickness = 4mm, slice number = 40, post label delay = 2025ms, acquisition time = 4:35).BOLD delay map was calculated following the procedures introduced by Tanritanir A.C. et al. (https://github.com/ahmedaak/BOLD_delay_repro) (2). The CBF map was calculated from M0 and perfusion-weighted data using the reported method (10) in MATLAB (Mathworks, Natick, MA). The BOLD delay map and CBF map were registered to the MNI space by combining the linear (fMRI/ASL-M0 to T1w with 6-DOF linear transformation) and nonlinear (T1w to MNI) transform using FSL toolbox (11).
The automated anatomical labelling atlas 3 (AAL3) (12) was used to parcellate the brain into 170 regions. The mean BOLD delay and CBF values of gray matter and white matter in each region were calculated. The inter-subject correlation coefficient of BOLD delay and CBF values was calculated in each region. For each individual, the correlation coefficients between BOLD delay and CBF were calculated for gray matter in each brain region. Then these correlation coefficients were compared between healthy volunteers and Moyamoya patients by using a two-tailed 2-sample t-test.
Results and Discussion
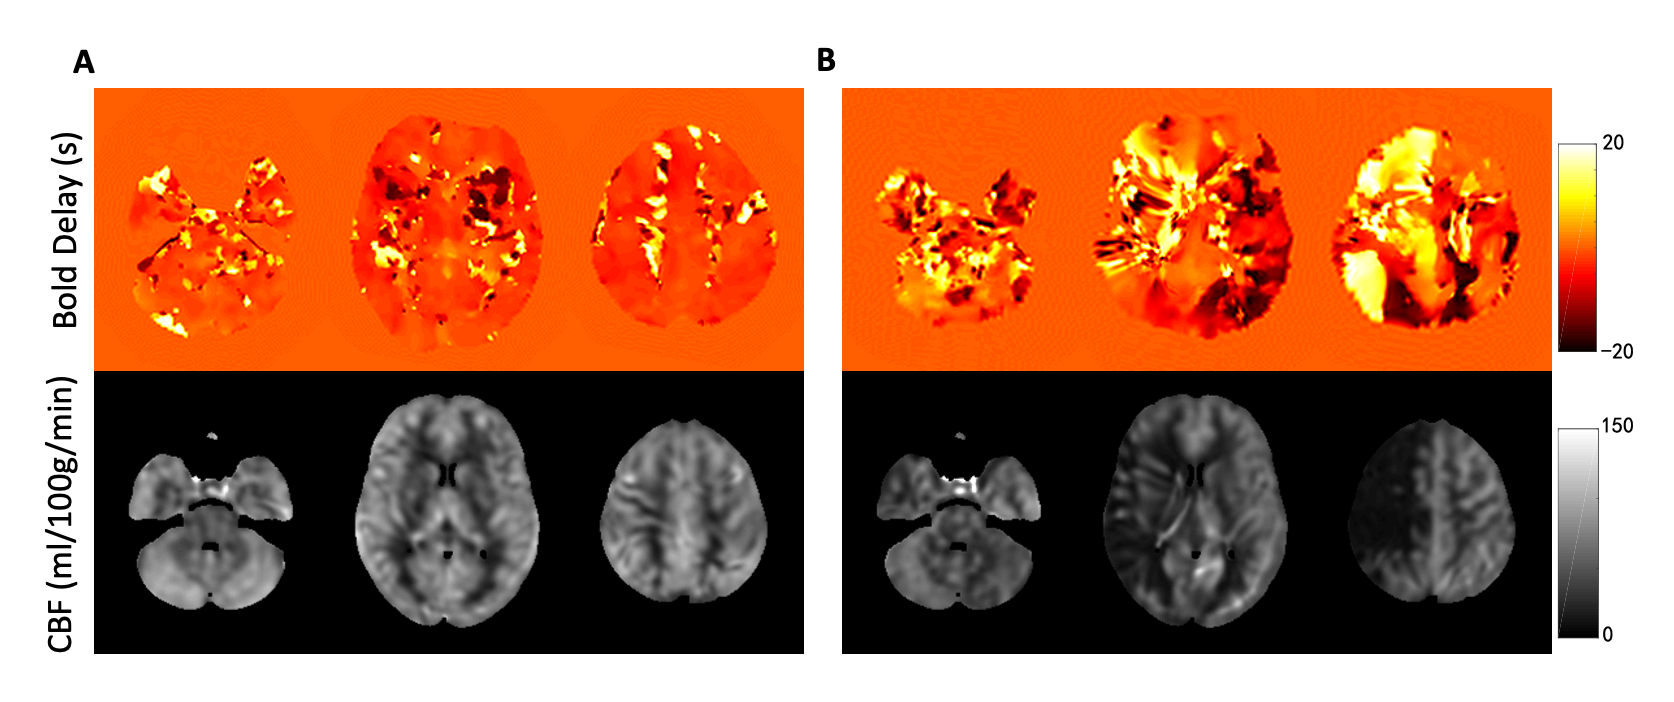
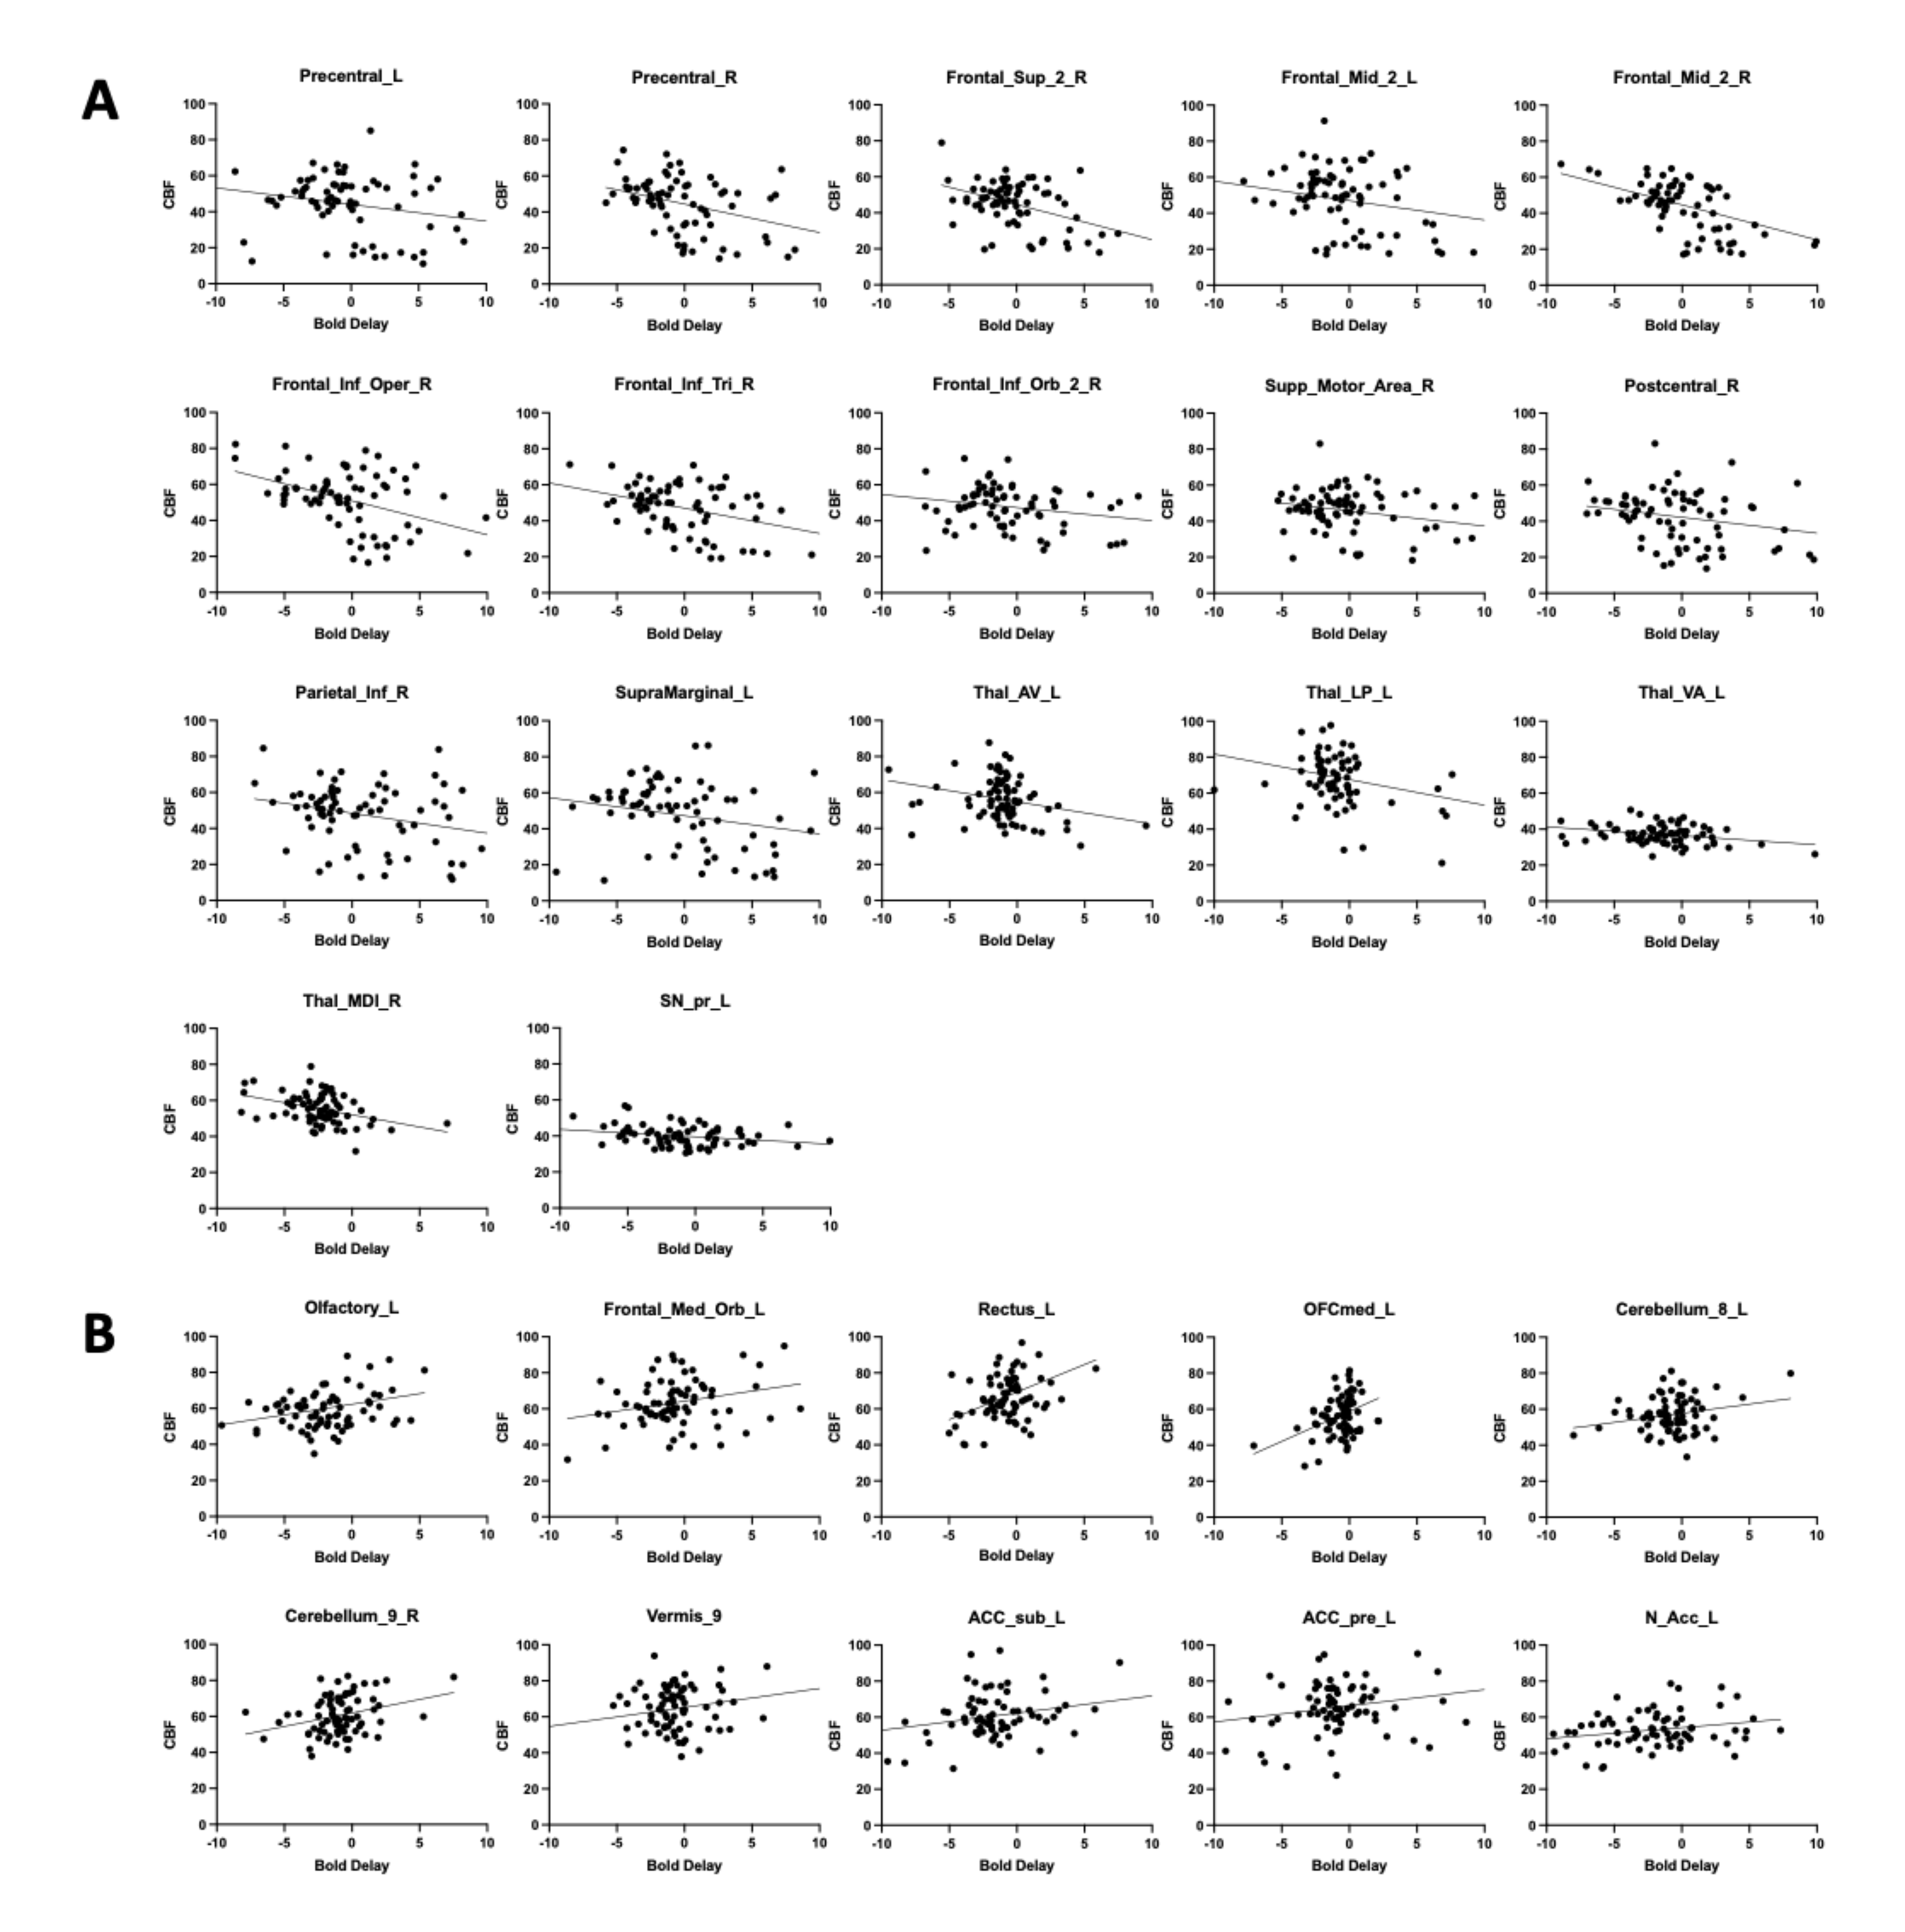
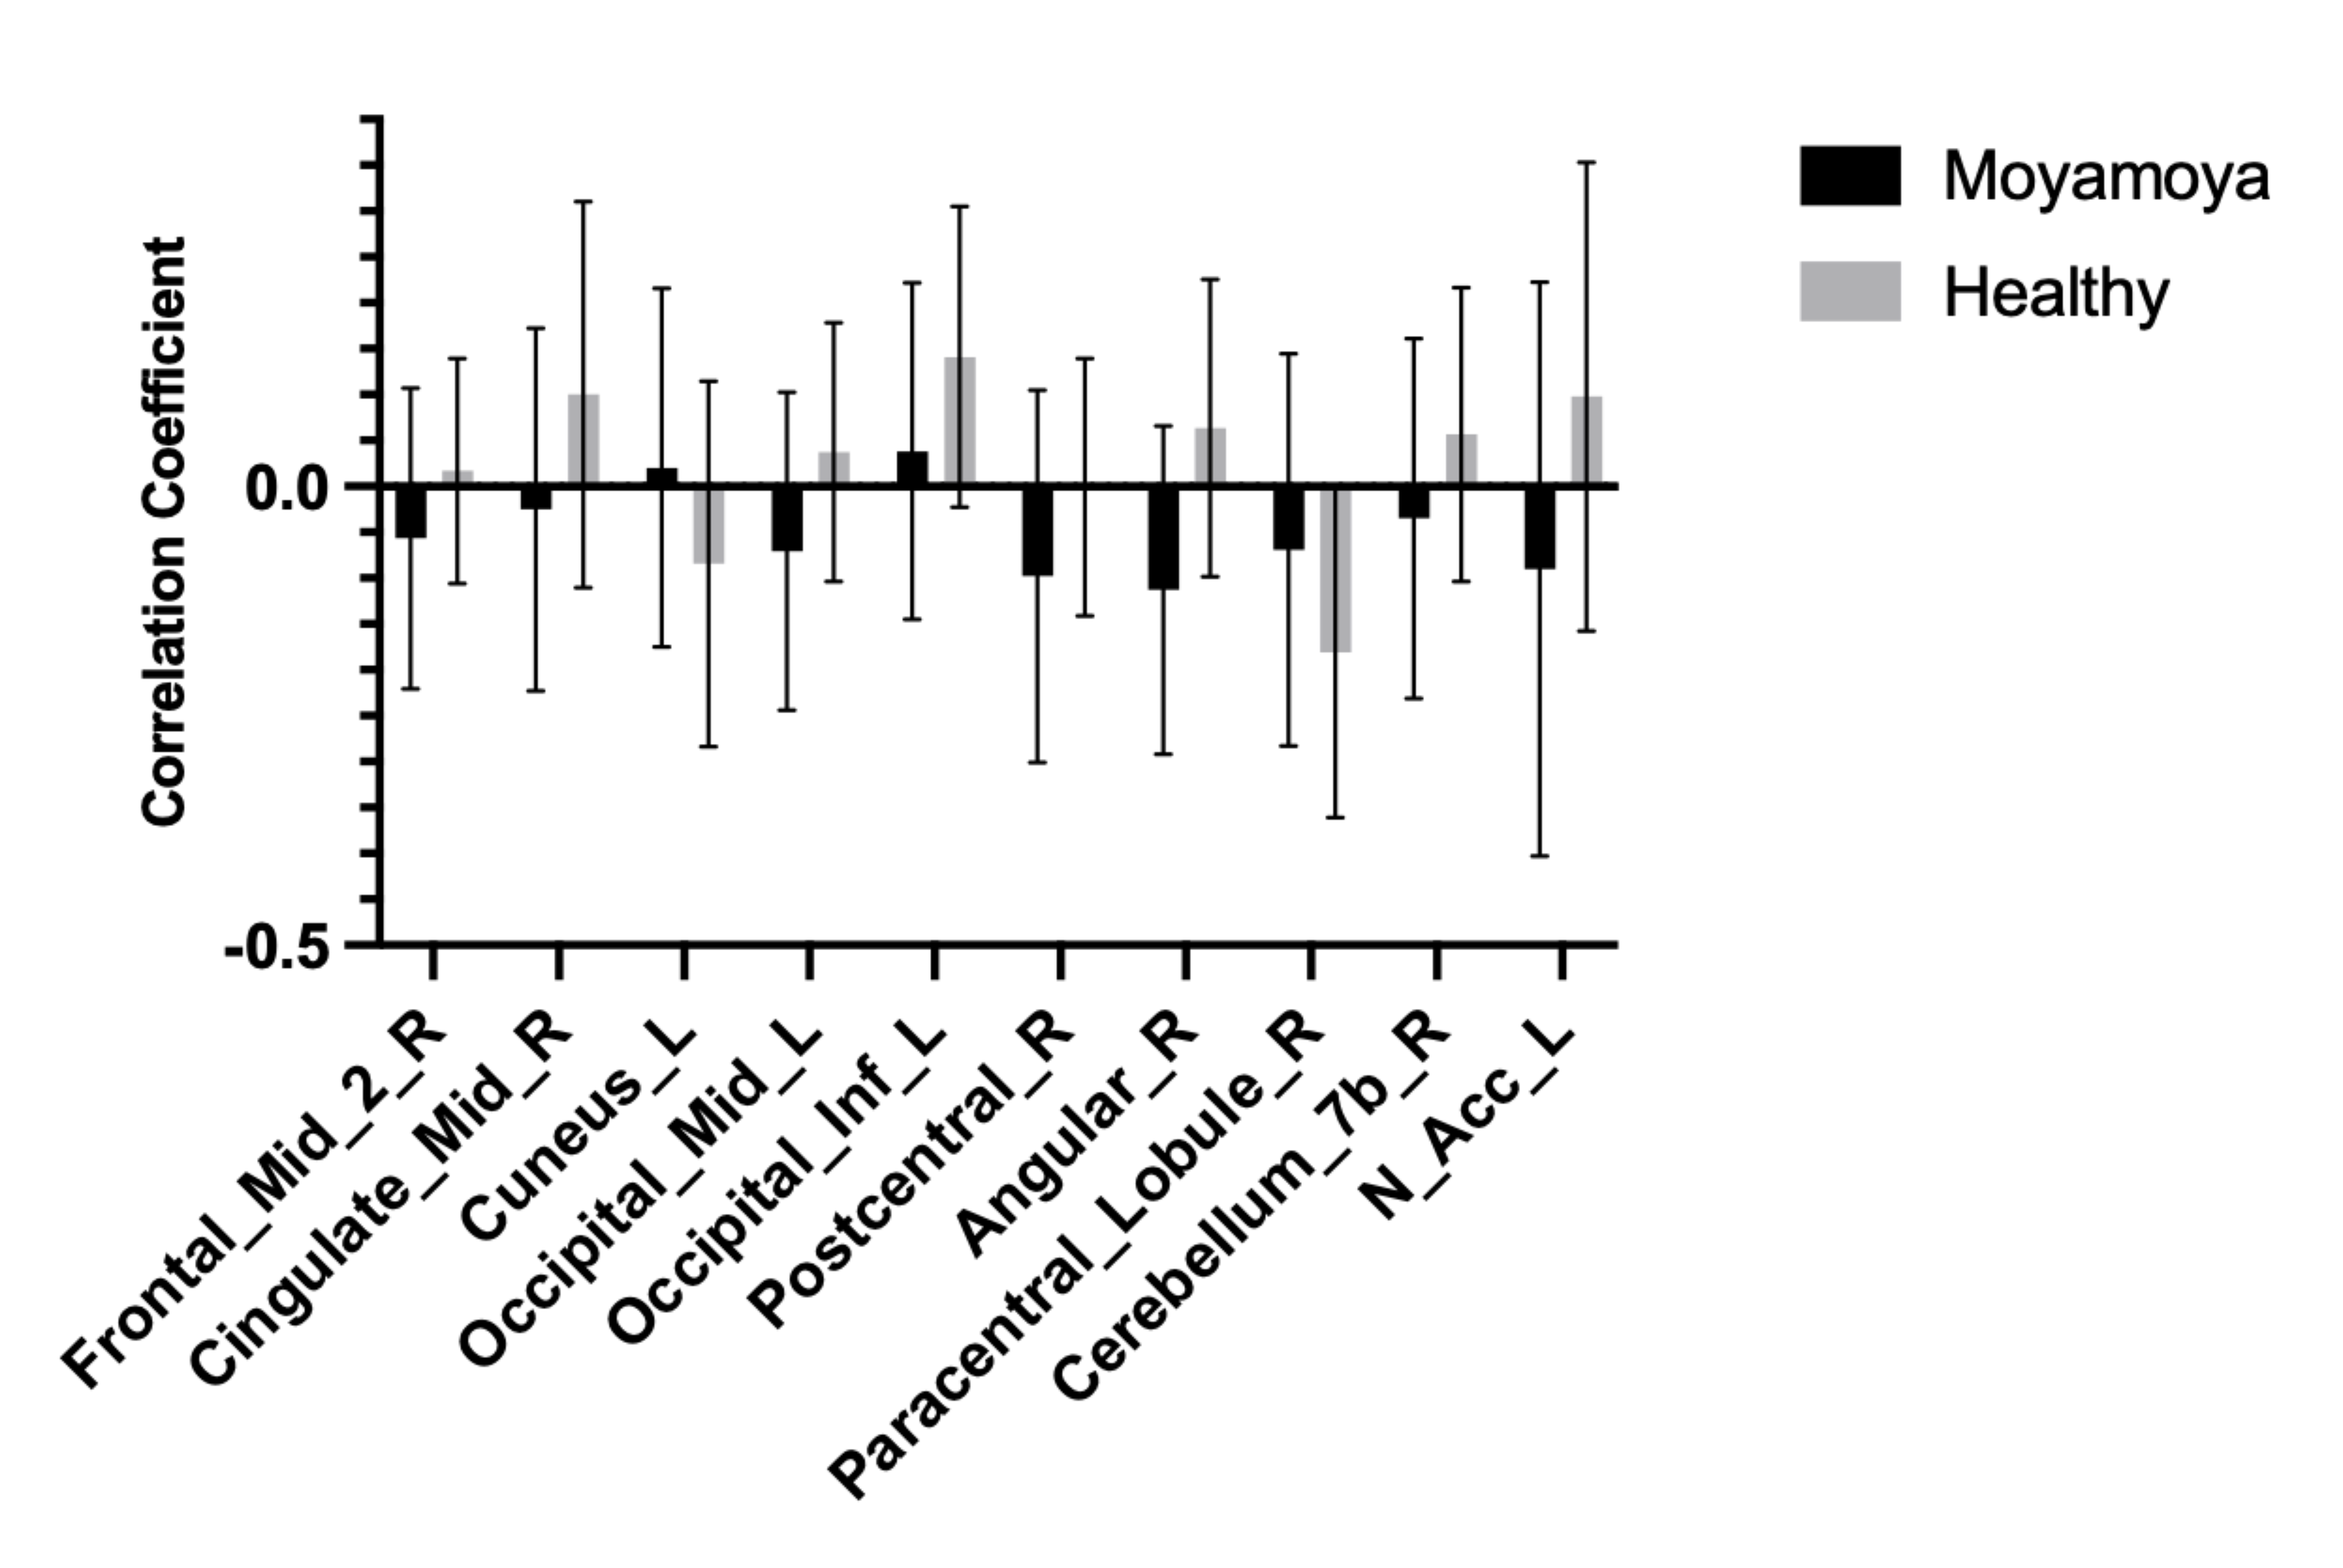
Fig. 1 shows representative BOLD delay maps and CBF maps of a healthy volunteer (A) and a patient with Moyamoya (B). The areas that showed abnormal BOLD delay match well with the hypoperfusion region in the CBF maps. Fig. 2 shows the results of the inter-subject correlation analysis of BOLD delay and CBF values in each region. In total, the BOLD delay and CBF values were found to be significantly correlated in 27 regions, in which 17 regions were negatively correlated and 10 were positively correlated. The negatively correlated regions are mainly located at the brain surface, while positively correlated regions are mainly located at the base. For the inter-group comparison of the correlation coefficients significant differences were found in the right middle frontal gyrus, right middle cingulate, left cuneus, left middle occipital gyrus, left inferior occipital gyrus, right postcentral gyrus, right angular gyrus, right paracentral lobule, left nucleus accumbens.Conclusion
In this study, the correlation between BOLD delay and CBF measured from ASL was explored. The results showed the inter-subject correlation between BOLD delay and CBF values. Meanwhile, the inter-group differences between Moyamoya patients and healthy controls may provide a new perspective in assessing the Moyamoya disease.Acknowledgements
No acknowledgement found.References
1. Luo S, Qi RF, Wen JQ, Zhong JH, Kong X, Liang X, Xu Q, Zheng G, Zhang Z, Zhang LJ, Lu GM. Abnormal Intrinsic Brain Activity Patterns in Patients with End-Stage Renal Disease Undergoing Peritoneal Dialysis: A Resting-State Functional MR Imaging Study. Radiology 2016;278(1):181-189.
2. Tanritanir AC, Villringer K, Galinovic I, Grittner U, Kirilina E, Fiebach JB, Villringer A, Khalil AA. The Effect of Scan Length on the Assessment of BOLD Delay in Ischemic Stroke. Front Neurol 2020;11:381.
3. Aso T, Urayama S, Fukuyama H, Murai T. Axial variation of deoxyhemoglobin density as a source of the low-frequency time lag structure in blood oxygenation level-dependent signals. PLoS One 2019;14(9):e0222787.
4. Lv Y, Margulies DS, Cameron Craddock R, Long X, Winter B, Gierhake D, Endres M, Villringer K, Fiebach J, Villringer A. Identifying the perfusion deficit in acute stroke with resting-state functional magnetic resonance imaging. Annals of neurology 2013;73(1):136-140.
5. Christen T, Jahanian H, Ni WW, Qiu D, Moseley ME, Zaharchuk G. Noncontrast mapping of arterial delay and functional connectivity using resting-state functional MRI: a study in Moyamoya patients. J Magn Reson Imaging 2015;41(2):424-430.
6. Khalil AA, Ostwaldt AC, Nierhaus T, Ganeshan R, Audebert HJ, Villringer K, Villringer A, Fiebach JB. Relationship Between Changes in the Temporal Dynamics of the Blood-Oxygen-Level-Dependent Signal and Hypoperfusion in Acute Ischemic Stroke. Stroke 2017;48(4):925-931.
7. Lv Y, Wei W, Song Y, Han Y, Zhou C, Zhou D, Zhang F, Xue Q, Liu J, Zhao L, Zhang C, Li L, Zang YF, Han X. Non-invasive evaluation of cerebral perfusion in patients with transient ischemic attack: an fMRI study. J Neurol 2019;266(1):157-164.
8. Siegel JS, Snyder AZ, Ramsey L, Shulman GL, Corbetta M. The effects of hemodynamic lag on functional connectivity and behavior after stroke. J Cereb Blood Flow Metab 2016;36(12):2162-2176.
9. Zheng G, Wen J, Yu W, Li X, Zhang Z, Chen H, Kong X, Luo S, Jiang X, Liu Y, Zhang Z, Zhang LJ, Lu GM. Anemia rather than hypertension contributes to cerebral hyperperfusion in young adults undergoing hemodialysis: A phase contrast MRI study. Sci Rep 2016;6:22346.
10. Guo L, Zhang Q, Ding L, Liu K, Ding K, Jiang C, Liu C, Li K, Cui L. Pseudo-continuous arterial spin labeling quantifies cerebral blood flow in patients with acute ischemic stroke and chronic lacunar stroke. Clin Neurol Neurosurg 2014;125:229-236.
11. Jenkinson M, Beckmann CF, Behrens TE, Woolrich MW, Smith SM. Fsl. NeuroImage 2012;62(2):782-790.
12. Rolls ET, Huang CC, Lin CP, Feng J, Joliot M. Automated anatomical labelling atlas 3. NeuroImage 2020;206:116189.
Figures