4581
Revealing Occult Hemodynamic Signatures from the Acetazolamide-Augmented Cerebral BOLD Response1Department of Radiology, New York University Langone Health, New York, NY, United States, 2Department of Radiology, Weill Cornell Medicine, New York, NY, United States, 3Department of Neurology, New York University Langone Health, New York, NY, United States, 4Department of Radiology, Emory University, Atlanta, GA, United States
Synopsis
Acetazolamide-augmented blood-oxygen-level-dependent (ACZ-BOLD MRI) provides robust estimation of cerebrovascular reactivity (CVR). Past approaches are limited to extraction of terminal CVR at arbitrarily selected times in the pharmacologic response, due to low signal-to-noise characteristics. We previously introduced a computational framework that pre-conditions the BOLD response for dynamic analysis and extraction of maximal, rather than terminal augmentation profiles, and novel hemodynamic signatures such as ACZ-BOLD time-to-maxima (Tmax). Several consistent and sometimes paradoxical patterns have emerged, the presentation of which we considered timely for this potentially novel hemodynamic neuroimaging biomarker.
Introduction
Cerebrovascular reactivity (CVR) refers to the ability of resistance vessels in the cerebral circulation to dilate in response to falling perfusion pressures to preserve cerebral blood flow.1 CVR exhaustion correlates with a regime of misery perfusion signified by increasing oxygen extraction and is associated with increased stroke risk in chronic steno-occlusive disease (SOD).2-8Acetazolamide-augmented BOLD-CVR has been limited to arbitrarily defined, terminal aspects of the CVR response (CVRend) due to suboptimal signal-to-noise characteristics of the time-signal course (TSC). Consequently, relevant dynamic features such as maximal (CVRmax) epochs, which can arise from the dose- and arrival-dependent nature of the slow ACZ response and induce non-monotonic responses, remain hidden to conventional BOLD-CVR.
We previously presented a computational framework to pre-condition BOLD signals for dynamic analyses, including previously undescribed CVRmax, which may differ from CVRend values in significant and paradoxical ways.9 Several hemodynamic signatures have emerged, and we felt a formalized summary of these profiles to be timely. Herein we present initial experience with this approach in a cohort of 23 clinical subjects with unilateral SOD.
Methods
23 patients with unilateral chronic SOD (mean age 51.4 years, 10 females) underwent 32 examinations.Subjects were scanned in a 3T whole-body system (Siemens Prisma, Siemens Healthineers, Erlangen, Germany) with a 64-channel head coil to include: i.1mm isotropic T1-weighted MPRAGE; ii.~20-minute BOLD imaging performed with a gradient-echo EPI sequence (TR=2.15-2.37 seconds, voxel size=2x2x5mm3, whole-brain coverage); iii.Gradient echo magnitude and phase field maps for distortion correction. 1-gram ACZ in 10 mL normal saline was infused over 3 minutes, following 4-5 minutes baseline scanning, without interruption of BOLD imaging.
For each subject, T1-MPRAGE was processed using Freesurfer for automated segmentation of cortical and subcortical structures.10 Thermal noise in BOLD images was suppressed with a custom PCA-based denoising strategy isolating noise in the eigenspectrum using universal properties of the Random Matrix Theory.11 Denoised BOLD images and field maps were processed in FSL Melodic for motion correction, unwarping, slice timing correction, and spatial smoothing.12 0.01Hz temporal low-pass filtering was applied to pre-processed BOLD without detrending. The first and last 30 frames were discarded.
Conventional CVRend maps were produced from the first and last one-minute BOLD data and averaged respectively as BOLDpre and BOLDpost. CVR was calculated as %CVR=100*(BOLDpost–BOLDpre)/BOLDpre. CVRmax was extracted from the maximal, pre-binned and denoised BOLD TSC for each voxel. A linear boundary-based coregistration was used to align CVR maps with Freesurfer-processed T1-MPRAGE.13
We investigated vascular atlas-defined territories of the middle cerebral artery (MCA) in MNI space.14 Territorial masks were inverse warped to individual T1 space using DARTEL, then linearly transformed masks to BOLD MRI space.15 Average BOLD TSC were demeaned for uniform scaling.
A canonical TSC representing hypothetically idealized BOLD-CVR with monotonically increasing signal before an ultimate plateau was formulated to contextualize empirically observed signatures. Potential deviations included: i. flat, non-responsive TSC; ii. delayed and/or blunted TSC; iii. Non-monotonic TSC which may coincide either with delayed or early and dampened or exuberant CVR motifs, and which made allowances for paradoxical reductions in normal (i.e., reverse Robinhood/steal) or previously unreported abnormal (i.e., Robinhood) in BOLD studies.
Results
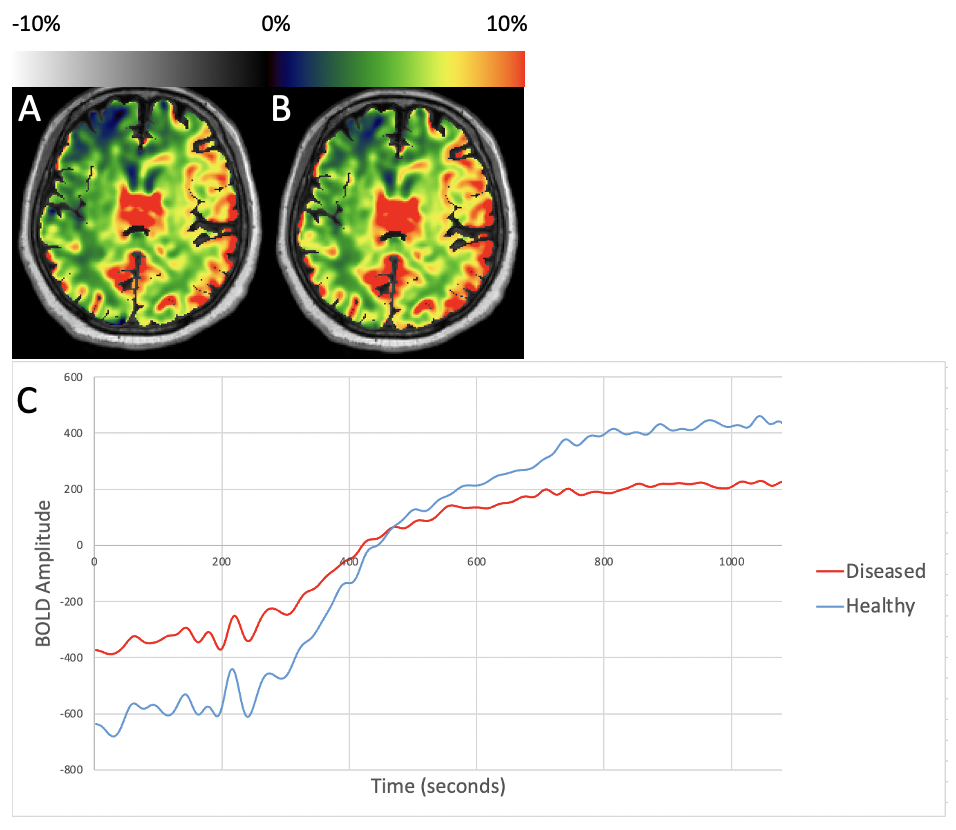
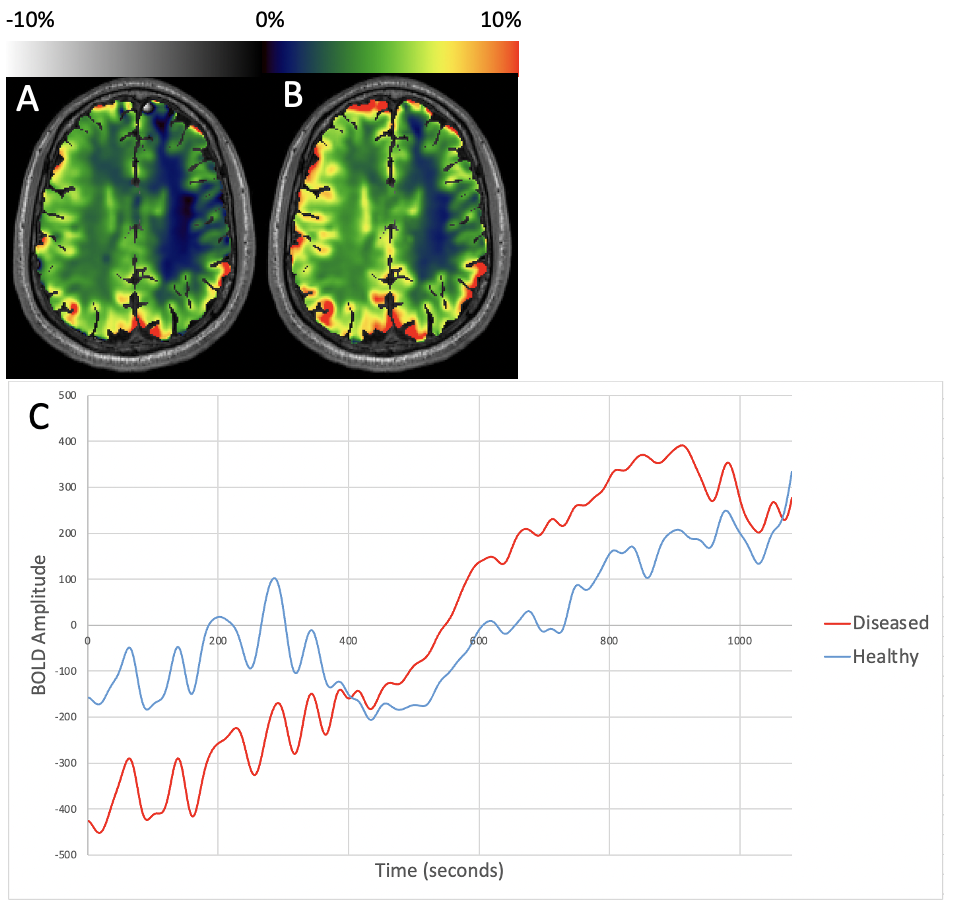
Figure 1 shows representative CVRend and CVRmax maps from a patient with right ICA SOD, and demeaned TSC from healthy and diseased MCA territories. CVRend and CVRmax are comparable due to monotonic features, albeit with delayed and dampened kinetics in the diseased hemisphere.Figure 2 shows representative maps and TSC from MCA territories in a patient with right ICA disease. CVR maps reveal paradoxical elevations in the diseased hemisphere in this patient with a large anterior communicating artery (acomm), supporting paradoxical siphoning of perfusion reflecting a hyperdynamic ACZ effect to the diseased hemisphere (so-called Robinhood effect).
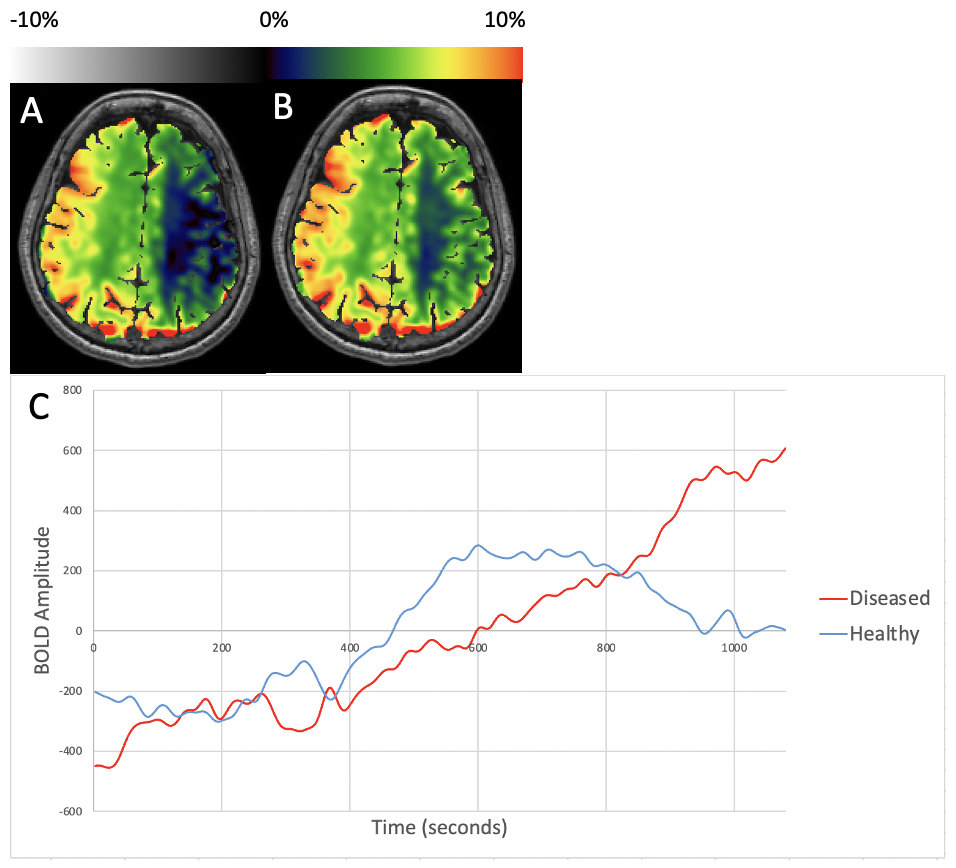
Figure 3 shows representative maps and TSC from MCA territories in a patient with right ICA SOD. Healthy hemispheric CVRend severely underestimates maximal augmentation, again with a prolonged Robinhood effect, but here persisting to the terminus even as the normal hemisphere exhibits earlier initial pharmacologic response and transient steal phenomenon in the pathologic hemisphere prior to exuberant augmentation in the pathologic territory.
Discussion
We present initial experience using BOLD-CVRmax in a real-world clinical cohort of treatment-naïve, angiographically-confirmed, unilateral SOD patients. As anticipated, BOLD-CVRmax, produces a more nuanced characterization of pharmacokinetic and hemodynamic features of the BOLD response, free of assumptions regarding optimal post-ACZ timing.Our experience suggests that CVRend estimations conceal early kinetic features of the ACZ stimulus response. Importantly, even maximal CVR extracted from incrementally truncated CVRend measurements fail to converge upon true voxel maxima, particularly when robust cross-hemispheric collaterals (e.g., acomm, present in all such cases in our series) allow efficient hemodynamic equilibria between territories. This equilibrium is further supported through the apparent reciprocity, within the limits of temporal resolution, that occurs as increasing and declining TSC intersect in nearly all such cases of our series.
Dynamic TSC may conceal an abundance of data to be explored, including potential insights into pharmacodynamics of hemodynamic stimuli. More refined paradigms and formalized hemodynamic signatures and, most importantly, their potential prognostic utility, merits further study.
Conclusion
Dynamic BOLD-CVR analysis reveals distinct kinetic responses to hemodynamic stimuli unattainable d from conventional ACZ BOLD analysis.Acknowledgements
No acknowledgement found.References
1. Liu P, De Vis JB, Lu H. Cerebrovascular reactivity (CVR) MRI with CO2 challenge: A technical review. Neuroimage 2019;187:104-115
2. Reinhard M, Schwarzer G, Briel M, et al. Cerebrovascular reactivity predicts stroke in high-grade carotid artery disease. Neurology 2014;83:1424-1431
3. Gupta A, Chazen JL, Hartman M, et al. Cerebrovascular reserve and stroke risk in patients with carotid stenosis or occlusion: a systematic review and meta-analysis. Stroke 2012;43:2884-2891
4. Liu M, Zhou L. Cerebrovascular reserve may be a more accurate predictor of stroke than degree of ICA or MCA stenosis. Med Sci Monit 2014;20:2082-2087
5. Ogasawara K, Ogawa A, Yoshimoto T. Cerebrovascular reactivity to acetazolamide and outcome in patients with symptomatic internal carotid or middle cerebral artery occlusion: a xenon-133 single-photon emission computed tomography study. Stroke 2002;33:1857-1862
6. Nemoto EM, Yonas H, Kuwabara H, et al. Identification of hemodynamic compromise by cerebrovascular reserve and oxygen extraction fraction in occlusive vascular disease. J Cereb Blood Flow Metab 2004;24:1081-1089
7. Markus H, Cullinane M. Severely impaired cerebrovascular reactivity predicts stroke and TIA risk in patients with carotid artery stenosis and occlusion. Brain 2001;124:457-467
8. Bouvier J, Detante O, Tahon F, et al. Reduced CMRO₂ and cerebrovascular reserve in patients with severe intracranial arterial stenosis: a combined multiparametric qBOLD oxygenation and BOLD fMRI study. Hum Brain Mapp 2015;36:695-706
9. Dogra S, Wang X, Veraart J, et al. A Flexible Computational Framework for Characterization of Dynamic Cerebrovascular Response to Global Hemodynamic Stimuli. ISMRM 2021 In Proc Intl Soc Mag Reson Med 29 (2021); 2021
10. Dale AM, Fischl B, Sereno MI. Cortical surface-based analysis. I. Segmentation and surface reconstruction. Neuroimage 1999;9:179-194
11. Veraart J, Fieremans E, Novikov DS. Diffusion MRI noise mapping using random matrix theory. Magn Reson Med 2016;76:1582-1593
12. Beckmann CF, Smith SM. Probabilistic independent component analysis for functional magnetic resonance imaging. IEEE Trans Med Imaging 2004;23:137-152
13. Greve DN, Fischl B. Accurate and robust brain image alignment using boundary-based registration. Neuroimage 2009;48:63-72
14. Mutsaerts H. ATT based flow territories. figshare. 2015
15. Ashburner J. A fast diffeomorphic image registration algorithm. NeuroImage 2007;38:95-113
Figures