4580
Comparison of different denoising approaches for DCE-MRI1Key Laboratory of Biomedical Engineering of Ministry of Education, College of Biomedical Engineering and Instrument Science, Zhejiang University, Hangzhou, China, 2Department of Radiology, Qilu Hospital of Shandong University, Jinan, China, 3College of Life Sciences, Zhejiang University, Hangzhou, China, 4Department of Neurosurgery, Shandong Provincial Hospital Affiliated to Shandong First Medical University, Jinan, China, 5Department of Physical Medicine and Rehabilitation, Interdisciplinary Institute of Neuroscience and Technology, The Affiliated Sir Run Run Shaw Hospital, School of Medicine,, Zhejiang University, Hangzhou, China
Synopsis
The physiological parameters estimated from pharmacokinetic modeling of DCE-MRI are usually biased by the non-white, spatially-dependent noise. In this study, we compared several state-of-arts denoising approaches, including gaussian low pass filter (GLPF), the dynamic nonlocal mean (DNLM), the nonlocal mean based on spatiotemporal patches (NLM-ST), 2D and 3D kinetics-induced bilateral filter (KIBF). Our results reveal that the 3D KIBF can reduce the noise significantly and reserve subtle information best.
Introduction
Dynamic contrast-enhanced MRI (DCE-MRI), which is used to obtain the information about permeability of vascular, hemodynamic and components’ proportion of tissue,1 is widely applied in clinical research and diagnosis of tumors, neurodegeneration disease.2There are many kinetic models proposed to analyze the DCE-MRI data, however, the curve fitting of the DCE‐MRI time‐courses is error-prone due to the non-white, spatially-dependent noise.3 Hence, for DCE-MRI, many approaches have been put forward to reduce the noise, such as the gaussian low pass filter (GLPF), the dynamic nonlocal mean (DNLM),4 the bilateral filter.5 What’s more, due to the similar characteristic, the 2D kinetics-induced bilateral filter (KIBF-2D) and the nonlocal mean based on spatiotemporal patches (NLM-ST),6,7 which are used in denoising of dynamic PET images, are also valuable for DCE-MRI.
In this study, we aim to compare the different denoising approaches for DCE-MRI, which include GLPF, NLM-ST,6 DNLM,4 KIBF-2D,7 and KIBF-3D modified from KIBF-2D, and in the performance of denoising DCE-MRI data.
Methods
The conventional nonlocal mean (NLM) re-establish the given pixel signal by using the similarity, which is defined as the intensity difference, in the neighborhoods.8 NLM-ST is modified for DCE-MRI, which focuses on spatial information.6 On the other hand, DNLM moved the focus of NLM from spatial domain to time domain to denoise DCE-MRI data.4 Unlike the GLPF whose weighted matrix derived from distance difference and the NLM whose weighted matrix derived from intensity difference, the KIBF, which is based on bilateral filter, combines these two characteristics.7 To increase the utilization of spatial information, we extended KIBF’s neighbor windows from 2D to 3D, which is called KIBF-3D. Please refer to the references for specific formulas due to words limitations.4,6,7Ten high grade glioma (HGG) patients and ten solitary brain metastasis (SBM) patients were scanned on a 3.0T MRI instrument (Magnetom Skyra, Siemens Healthcare, Erlangen, Germany). DCE-MRI data were acquired with 3D CAIPIRINHA-Dixon-TWIST sequence with the parameters: FOV, 340 × 340 × 120 mm3; resolution, 0.8×0.8×1.5 mm3; flip angle, 10°; TR, 6 msec; TE, 1.3 msec; temporal resolution, 4.5 seconds; 120 frames (~ 9 min).
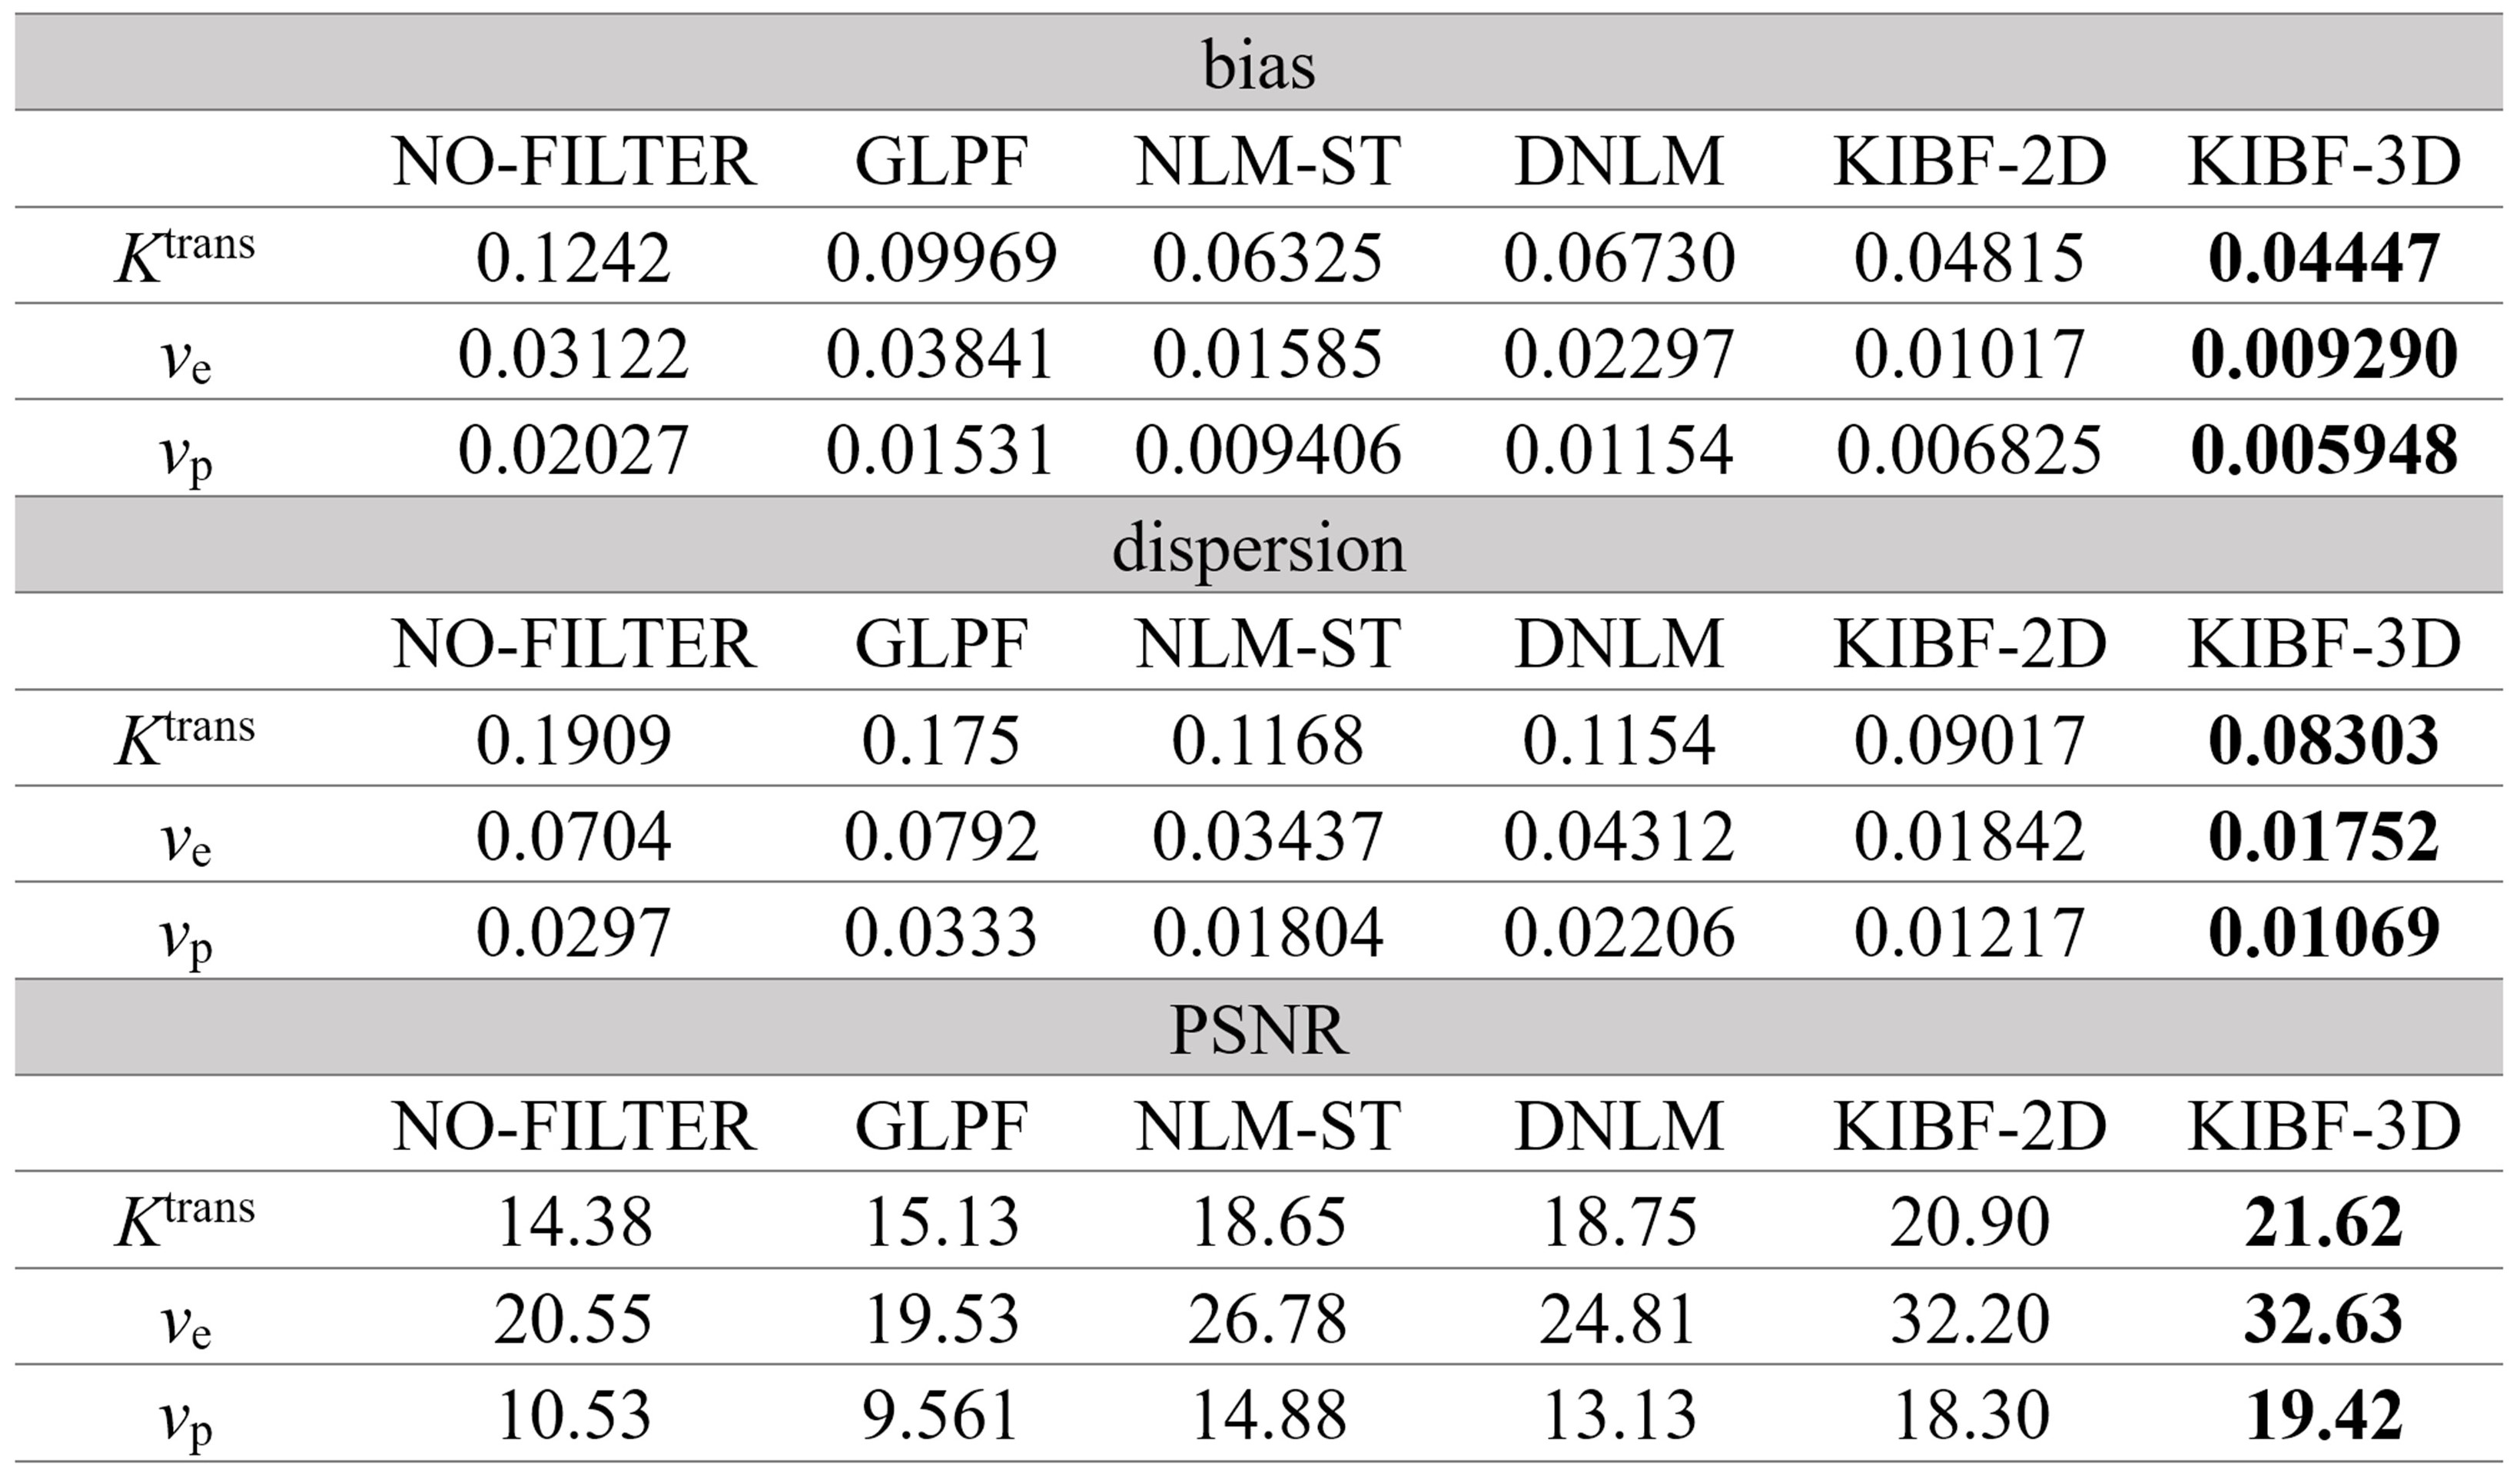
Simulations were performed to optimize the setting of NLM-ST, DNLM, 2D and 3D KIBF. Specifically, an artificial DCE-MRI brain phantom with DCE-MRI signal generated from the extended Tofts (eTofts) model with Rician noise added.9 The brain was divided into 121 regions base on MNI152 T1-weighted template images and the Ktrans, ve, vp and quantitative T1 of each brain region were randomly picked from reasonable ranges.10 At last, the noisy DCE-MRI signal were denoised with different approaches and then fitted with the eTofts model. The bias, dispersion and peak signal-to-noise ratio (PSNR) of the eTofts parameters were then used to evaluate the denoising approaches.
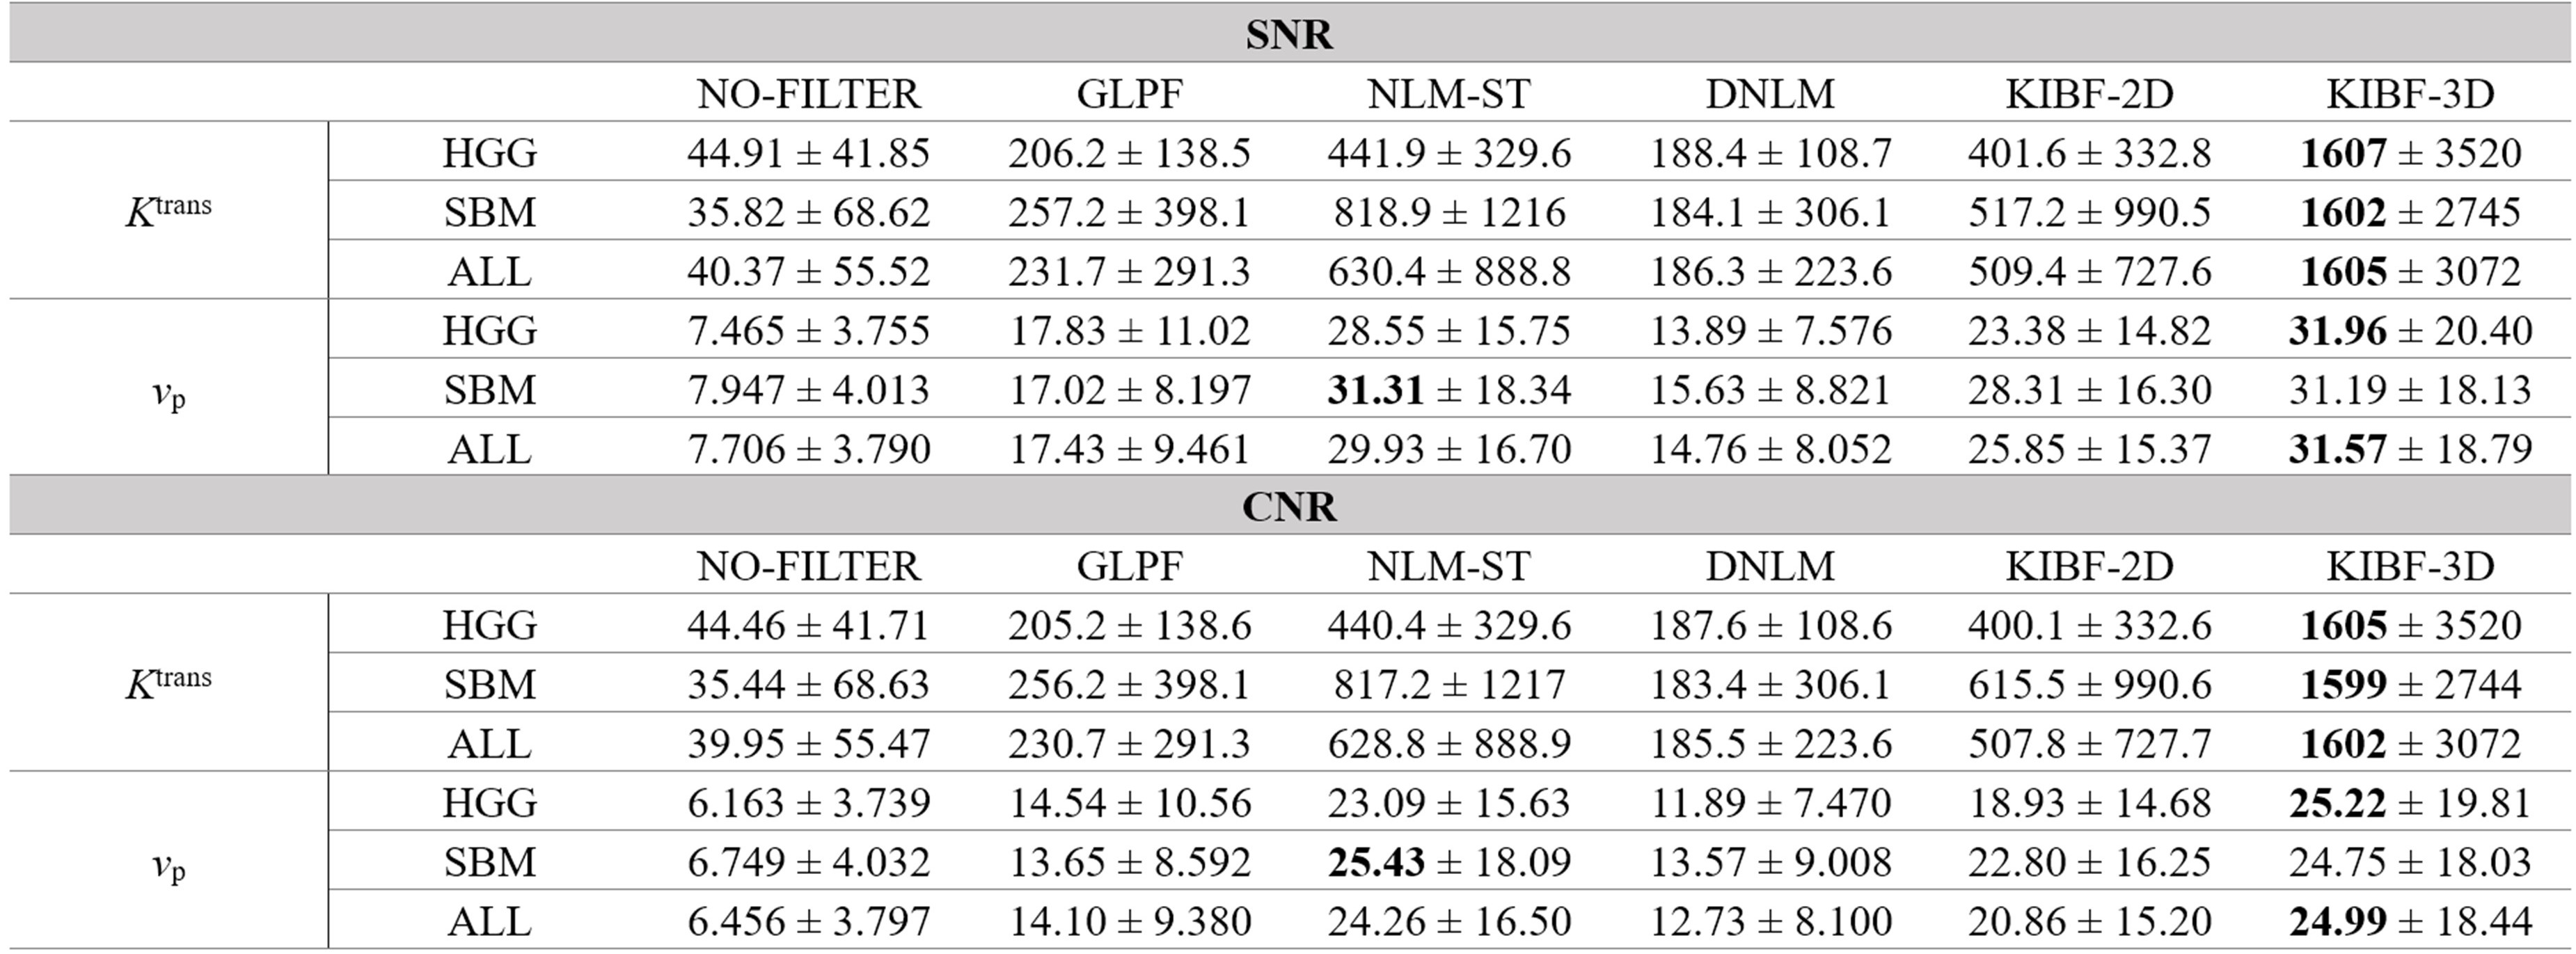
Those denoising methods were also applied onto the experimental DCE-MRI data and the noisy and denoised DCE-MRI data were then fitted by eTofts model. As there is no ground truth, the signal-to-noise ratio (SNR) and contrast-to-noise ratio (CNR, tumor vs normal appearing white matter (NAWM)) were used in the assessment. The SNR and CNR were defined as follows,
$$S N R = \frac { mean [ \textbf{I} _{r e s u l t } ( t u m o r ) ] } { s t d [ \textbf{I}_ {r e s u l t } ( NAWM ) ] }$$
$$C N R = \frac { mean [ \textbf{I} _{r e s u l t } ( t u m o r ) ]-mean [ \textbf{I} _{r e s u l t } ( NAWM) ] } { s t d [ \textbf{I}_ {r e s u l t } ( NAWM ) ] }$$
where $$$\textbf{I} _{r e s u l t }$$$ is the Ktrans or vp of the tumor ROIs or NAMW ROIs, which were manually selected by two experienced neuroradiologists together.
Results and Discussions
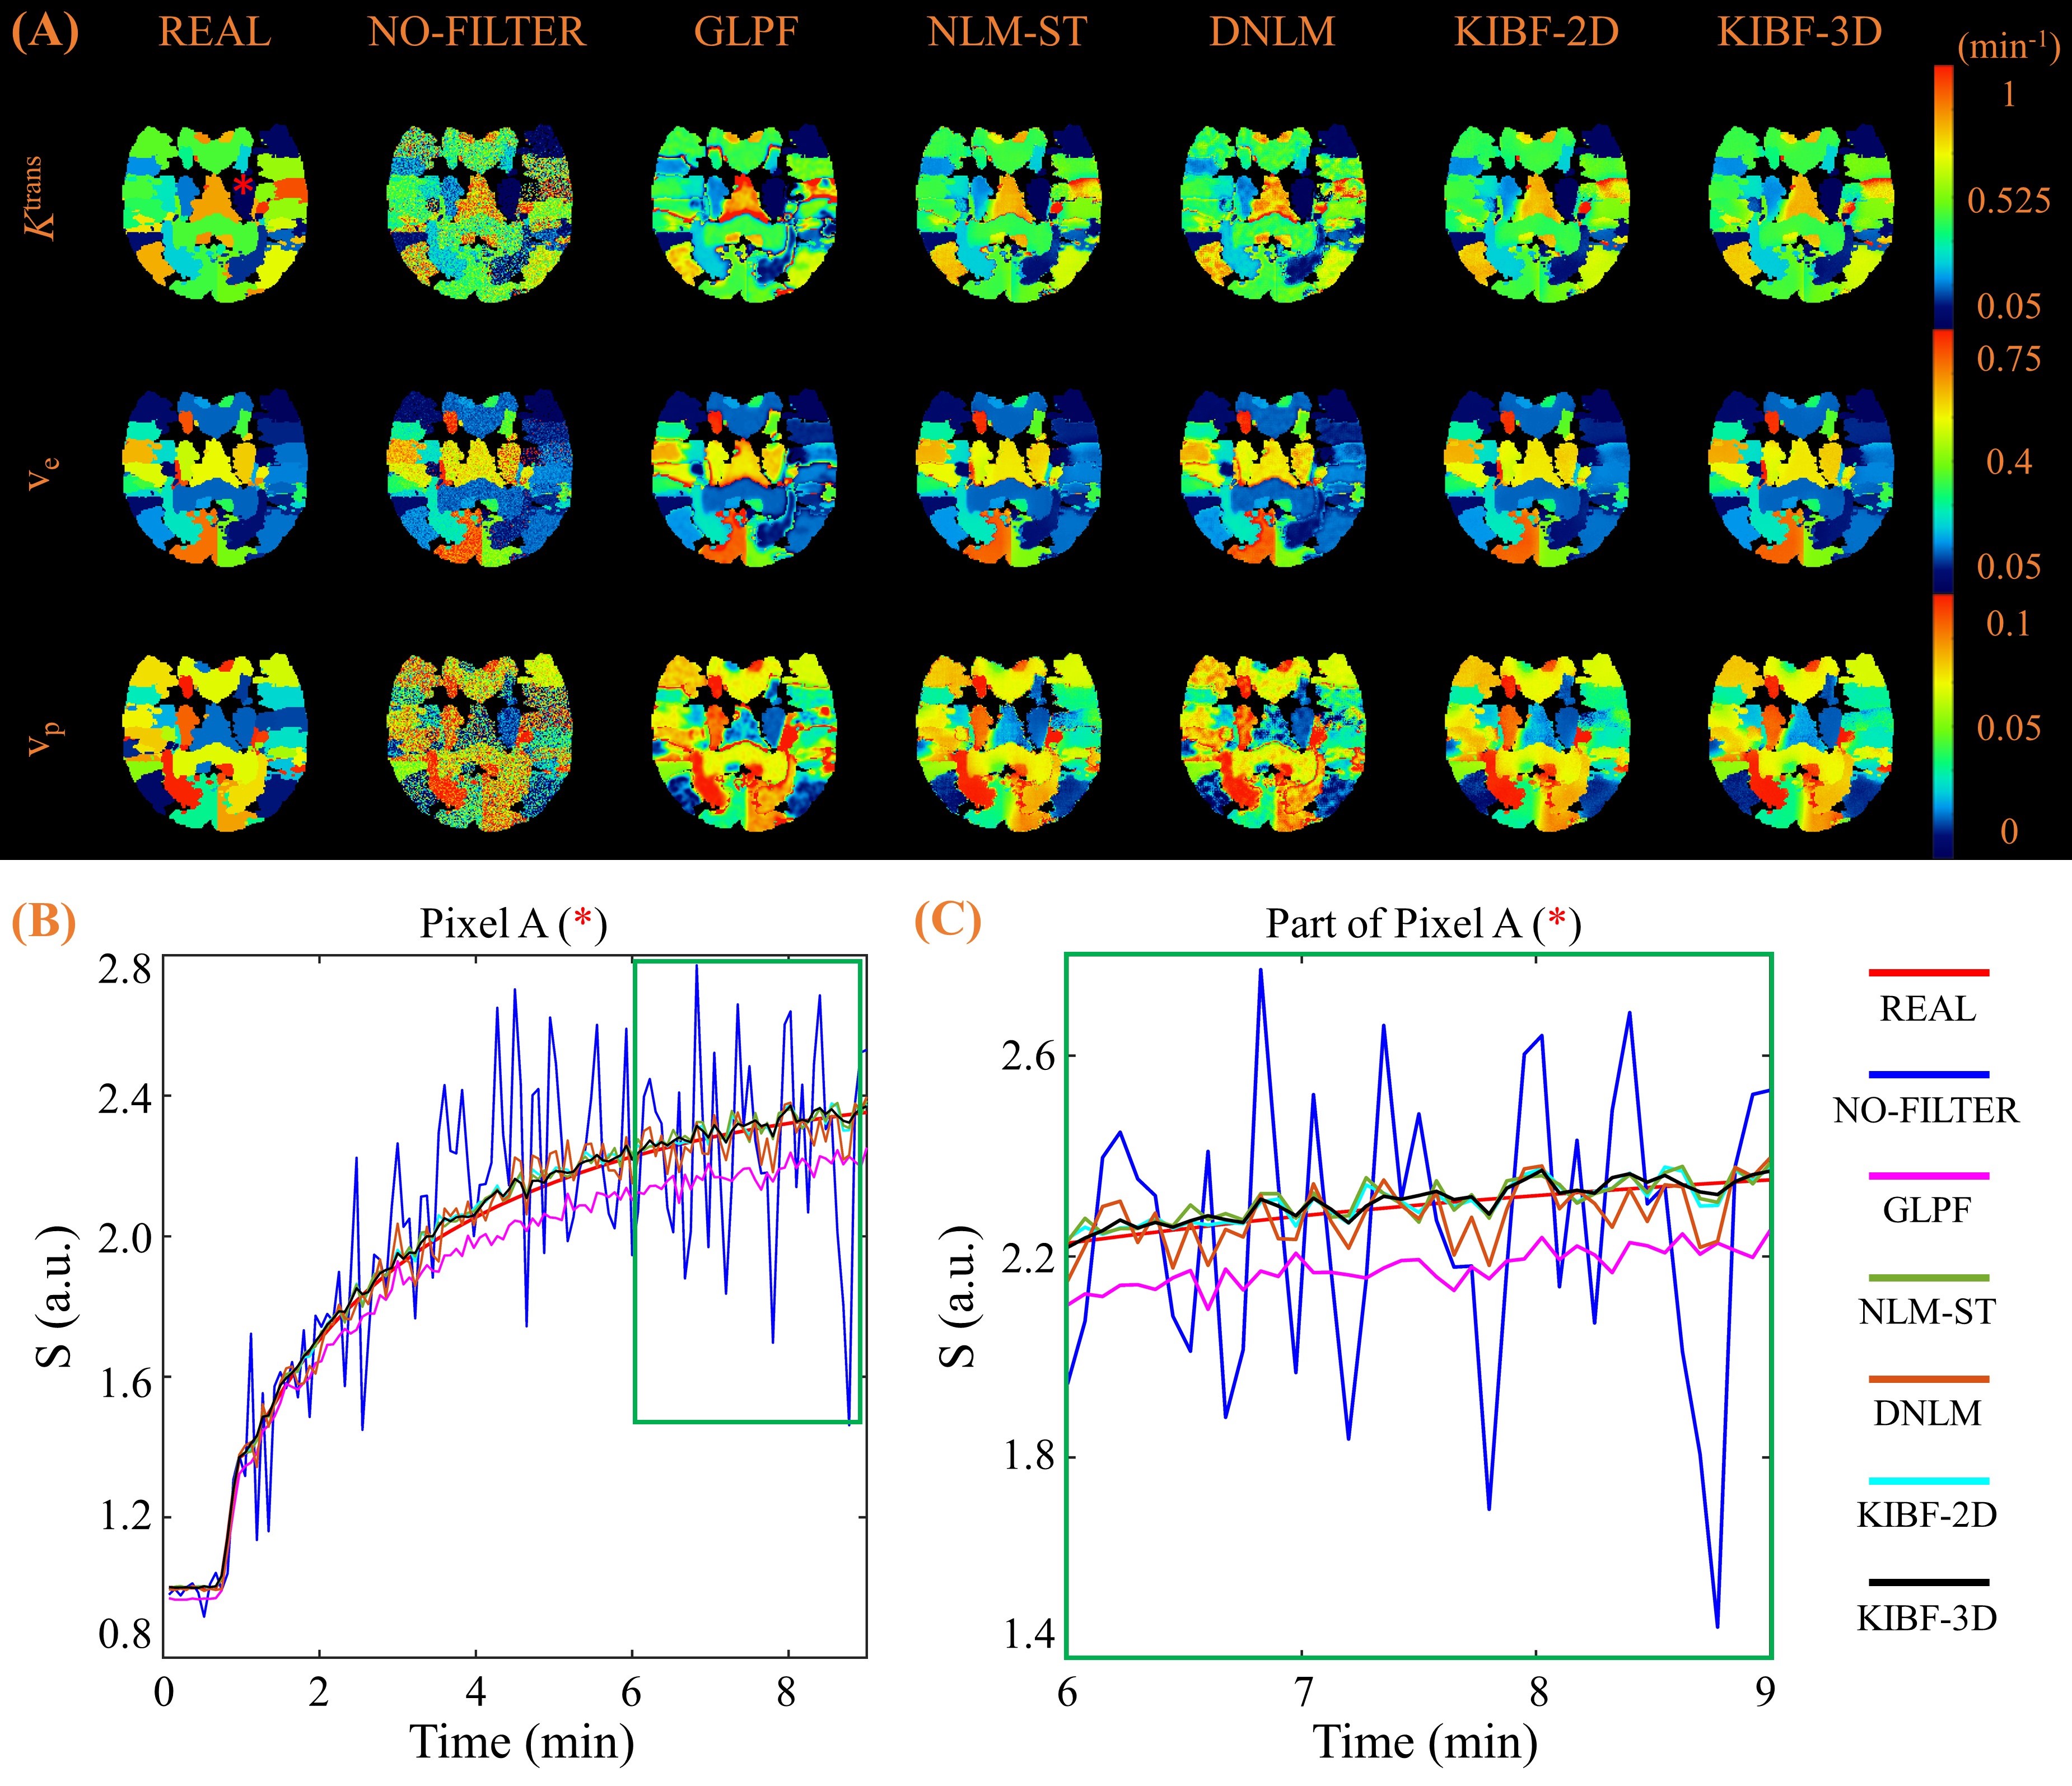
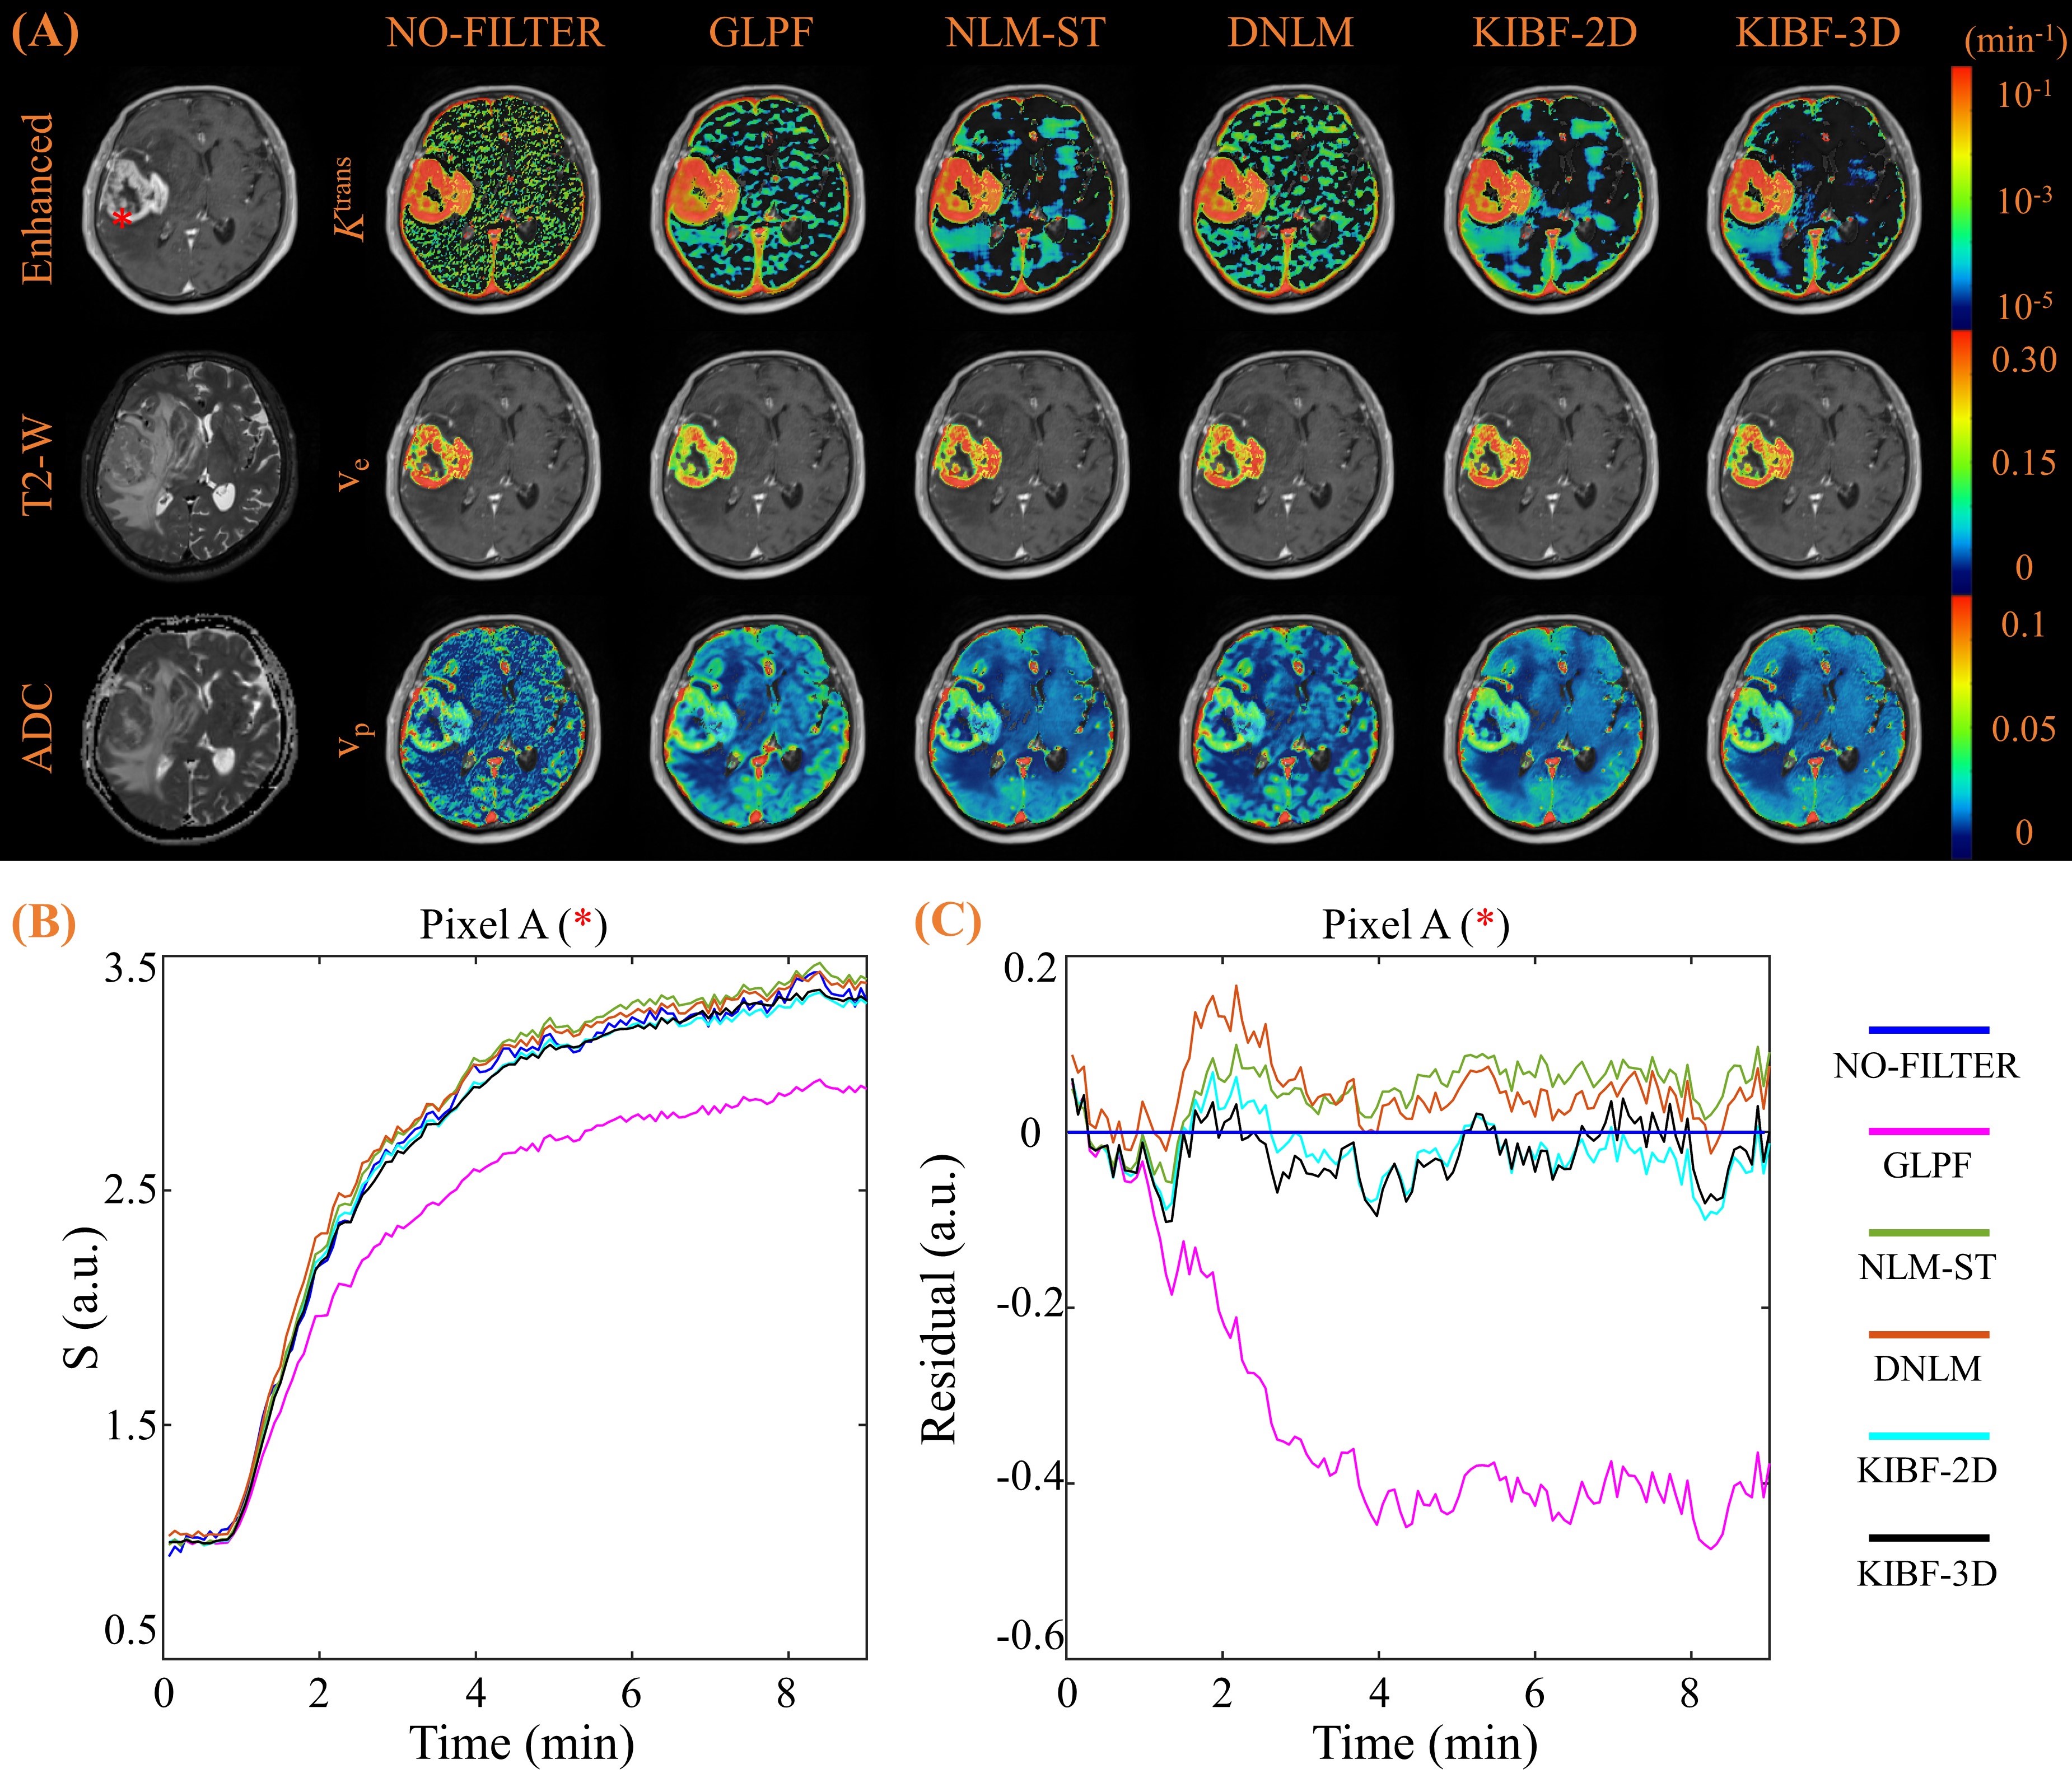
Parametric maps from the simulated brain DCE-MRI phantom preprocessed with different denoising approaches are shown in Figure 1A. Compared with other algorithms, the KIBF-2D and KIBF-3D reduce the noise significantly and reserve subtle information best, through bias also exists in some region. In Figure 1B&C, an typical example of the DCE-MRI time-course signal pre- and post-processed by the denoising methods are shown, in which KIBF-3D approach produces the results closest to the ground truth. Further quantitative evaluation also confirms that KIBF-3D achieves the smallest bias and dispersion, and has the greatest PSNR (Figure 2).The eTofts parametric maps from one HGG subject’s DCE-MRI data are shown in Figure 3A. In visual inspection, KIBF-3D performs best, especially in Ktrans map in which the Ktrans values in normal appearing brain area are close to minimum and more uniform. In addition, typical examples of pre- and post-denoised DCE-MRI time-course signal of one voxel are shown in Figure 3B&C, in which the difference between pre- and post-denoised signal with KIBF shows closest to white noise. Further quantitative evaluation also shows that KIBF-3D outperforms other methods in the SNR and CNR of of Ktrans and vp, though NLM-ST shows similar performance on vp in SBM patients’ data (Figure 4).
Conclusion
To achieve denoised DCE-MRI data with fine structural details, we compare different denoised methods. Both simulation and in vivo HGG and SBM study have shown the KIBF-3D algorithm can achieve significant advantage compared with other algorithms in terms of quantitative evaluation and visual inspection.Acknowledgements
No acknowledgement found.References
1. Bai R, Wang B, Jia Y, et al. Shutter‐Speed DCE‐MRI Analyses of Human Glioblastoma Multiforme (GBM) Data. J Magn Reson Imaging. 2020;52(3):850-863.
2. Guo Y, Lebel RM, Zhu Y, et al. High-resolution whole-brain DCE-MRI using constrained reconstruction: Prospective clinical evaluation in brain tumor patients. Med Phys. 2016;43(5):2013-2023.
3. Rojas I, Pomares H. Time Series Analysis and Forecasting: Selected Contributions from the ITISE Conference.; 2016.
4. Gal Y, Mehnert AJH, Bradley AP, McMahon K, Kennedy D, Crozier S. Denoising of dynamic contrast-enhanced MR images using dynamic nonlocal means. IEEE Trans Med Imaging. 2010;29(2):302-310.
5. Pineda FD, Medved M, Wang S, et al. Ultrafast Bilateral DCE-MRI of the Breast with Conventional Fourier Sampling: Preliminary Evaluation of Semi-quantitative Analysis. Acad Radiol. 2016;23(9):1137-1144.
6. Dutta J, Leahy RM, Li Q. Non-Local Means Denoising of Dynamic PET Images. PLoS One. 2013;8(12):e81390.
7. Bian Z, Huang J, Ma J, et al. Dynamic Positron Emission Tomography Image Restoration via a Kinetics-Induced Bilateral Filter. PLoS One. 2014;9(2):e89282.
8. Buades A, Coll B, Morel JM. A non-local algorithm for image denoising. Proc - 2005 IEEE Comput Soc Conf Comput Vis Pattern Recognition, CVPR 2005. 2005;II:60-65.
9. Tofts PS, Brix G, Buckley DL, et al. Estimating Kinetic Parameters From Dynamic Contrast-Enhanced T 1-Weighted MRI of a Diffusable Tracer: Standardized Quantities and Symbols. J Magn Reson Imaging. 1999;10:223-232.
10. He D, Xu L, Qian W, Clarke J, Fan X. A simulation study comparing nine mathematical models of arterial input function for dynamic contrast enhanced MRI to the Parker model. Australas Phys Eng Sci Med 2018 412. 2018;41(2):507-518.
Figures