4578
A study on MRI arterial spin labeling in predicting early response to chemoradiotherapy in patients with advanced nasopharyngeal carcinoma1Department of radiology, Affiliated hospital of Jiangnan university, Wuxi, China, 2GE healthcare,MR research China, Beijing, China
Synopsis
This study mainly investigated the feasibility of 3D pseudo-continuous arterial spin labeling (3D-pCASL) imaging in predicting the treatment response to chemoradiotherapy (CRT) for advanced nasopharyngeal carcinoma (ANPC) patients. 3D-pCASL derived blood flow (BF)s in tumors were respectively obtained for patients in response group (RG) and no-response group (NRG). The resultant pre-treatment BF showed significantly different values between RG and NRG patients. Combining with clinical information, BF also showed robust prediction between RG and NRG patients. Therefore, 3D-pCASL could be considered an effective method in tumor response prediction to CRT for ANPC patients before clinical treatment.
Introduction
Nasopharyngeal carcinoma is prevalent in east and southeast Asia countries such as China. Although intensity modulated radiotherapy and optimization of chemotherapy strategies (induction, concurrent) can achieve significant survival benefit, some advanced nasopharyngeal carcinoma (ANPC) patients still remain local control failure (i.e., residue or recurrence) due to insensitivity to treatments.1,2 At present, the Response Evaluation Criteria in Solid Tumors (RECIST 1.1) has been considered the standard for clinical therapeutic evaluation. Its application is however, somewhat hysteretic due to the retrospective nature by calculating the tumor regression rate in size between before and after treatment.3Fast spin-echo based 3D pseudo-continuous arterial spin labeling (3D-pCASL) imaging with spiral readout has been proposed a well-established non-invasive perfusion imaging by using magnetically labeled arterial blood as an endogenous tracer.4 With this technique, blood supply and oxygen status of tumor tissues were evaluated and the pathological changes of tumor were thus reflected earlier than morphological imaging.5 With these promising results, we assumed that 3D-pCASL imaging might also have clinical potential to predict the response to CRT in ANPC patients prior to clinical treatment.
Therefore, this study was to explore the feasibility of 3D-pCASL imaging in predicting the treatment response to CRT for ANPC patients. In addition, clinicopathological factors were further combined with 3D-pCASL derived blood flow (BF) to build a nomogram, aiming to investigate the robustness of this clinical predictive model.
Materials and methods
Patients70 ANPC patients (41males and 29 females, mean age: 58.1 years ranging from 36–79 years) were recruited in this study. Among these, 31 patients were for stage III and 39 were for stage IV, and the mean tumor size was of 2.88 cm ranging from 1.16–5.14 cm. Each patient underwent CRT treatment and pre-treatment MRI. According to RECIST 1.1, 48 patients were classified into response group (RG) and the rest 22 in no-response group (NRG). Clinicopathological information, e.g., clinical stage and pathological type, were also acquired for each patient.
MRI imaging
All MRI experiments were performed at a 3.0-T scanner (Discovery MR750, GE Healthcare, USA) with a 32-channel head-neck phase-array coil. 3D-pCASL imaging was applied for each patient with scan parameters of labeling duration=1450ms, post-label-delay=2025ms, TR=4852ms, TE=10.7ms, flip angle=111°, 8 arms with 512 points/arm, FOV=240×240mm2, NEX=3, slice thickness=3mm, acquisition time=4:42 mins.
Data analysis
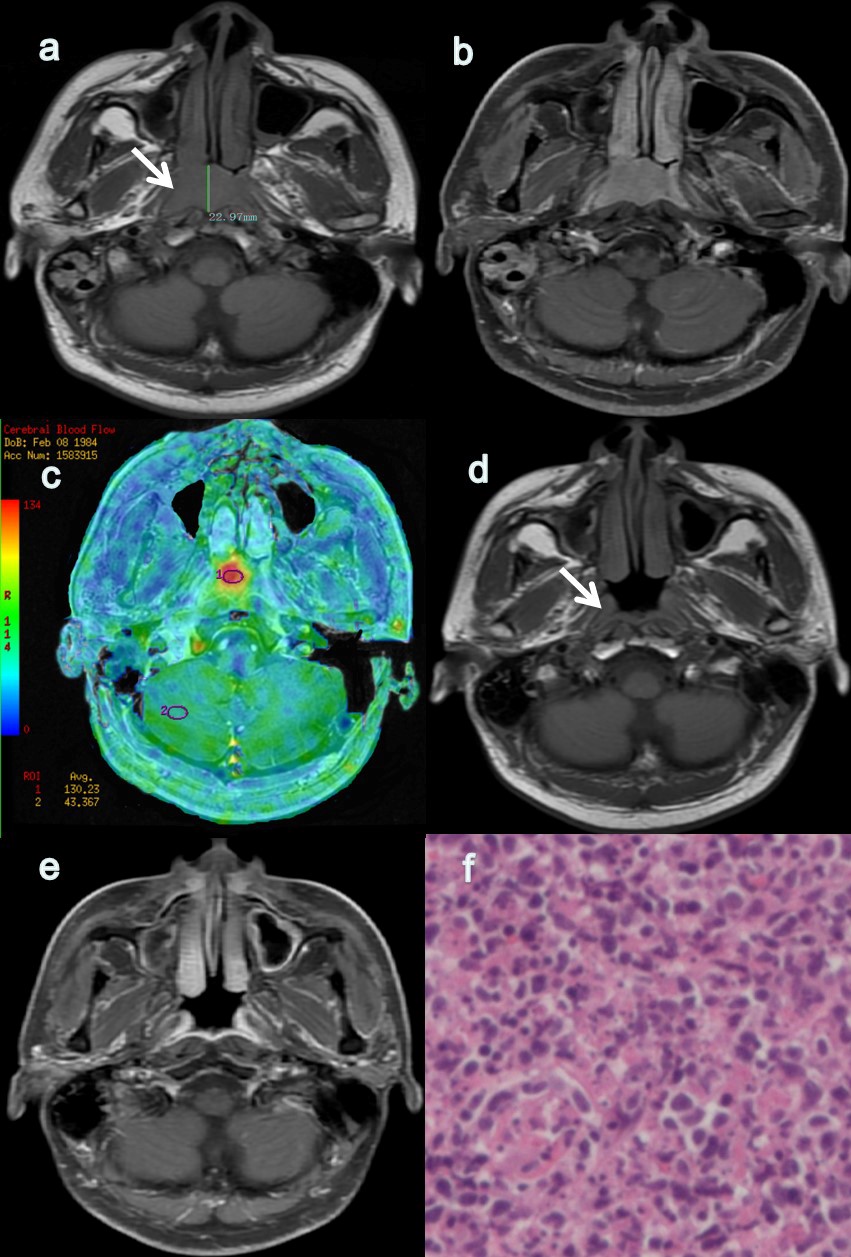
All 3D-pCASL data were post-processed using vendor-provided software in GE ADW 4.6 Workstation. The parameter of BF was obtained accordingly for each patient. A circle region of interest (ROI) was drawn twice on the tumor center based on a representative 2D image slice containing the largest tumor size. The average BF value over two measurements was recorded to avoid the measurement bias. Meanwhile, a ROI was drawn on the normal cerebellum to measure BF of normal tissue as a reference.
Statistical analysis
All statistical analyses were performed on SPSS 26.0 (SPSS Inc., Chicago, IL, USA), MedCalc version 15.11.4 (MedCalc software, Mariakerke, Belgium), and R software (version 3.5.1; http//www. R-projetc.org). Paired t-test was applied to compare pre-treatment BF in tumor between RG and NRG patients. Receiver-operating characteristic (ROC) analysis was further performed to determine the optimal diagnostic cutoff value for BF in predicting tumor response to CRT. Additionally, clinicopathological variables were analyzed by using univariate and binary logistic regression. The correspondingly obtained variables with statistical significance were further applied, together with BF, to create a nomogram in which the bootstrap resampling method was used for calibration. P<0.05 was considered significant threshold of statistic analysis.
Results
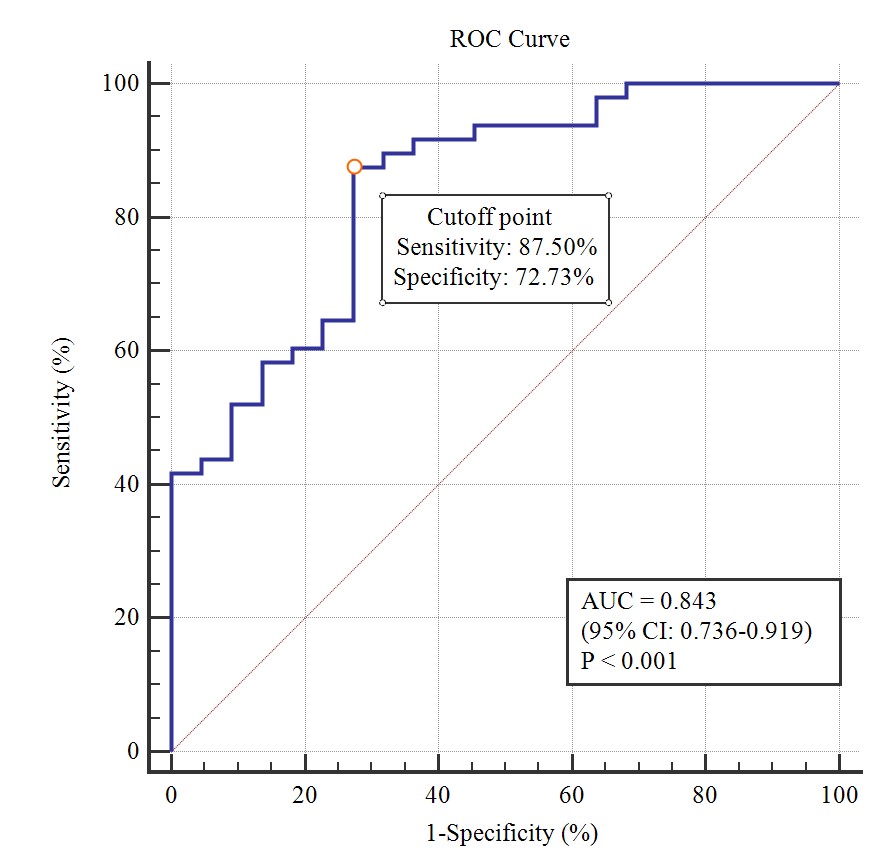
Forty-eight patients in RG had significantly higher pre-treatment BF values in tumors compared with 22 patients in NRG (113.74±8.68 vs. 97.20±13.80 mL/100 g/min, P<0.001, Fig.1).BF showed high area under the ROC curve (AUC=0.843) in distinguishing RG from NRG patients, with corresponding cutoff value of 103.68 ml/100 g/min, accuracy of 82.86%, sensitivity of 87.50% and specificity of 72.73%(Fig.2).
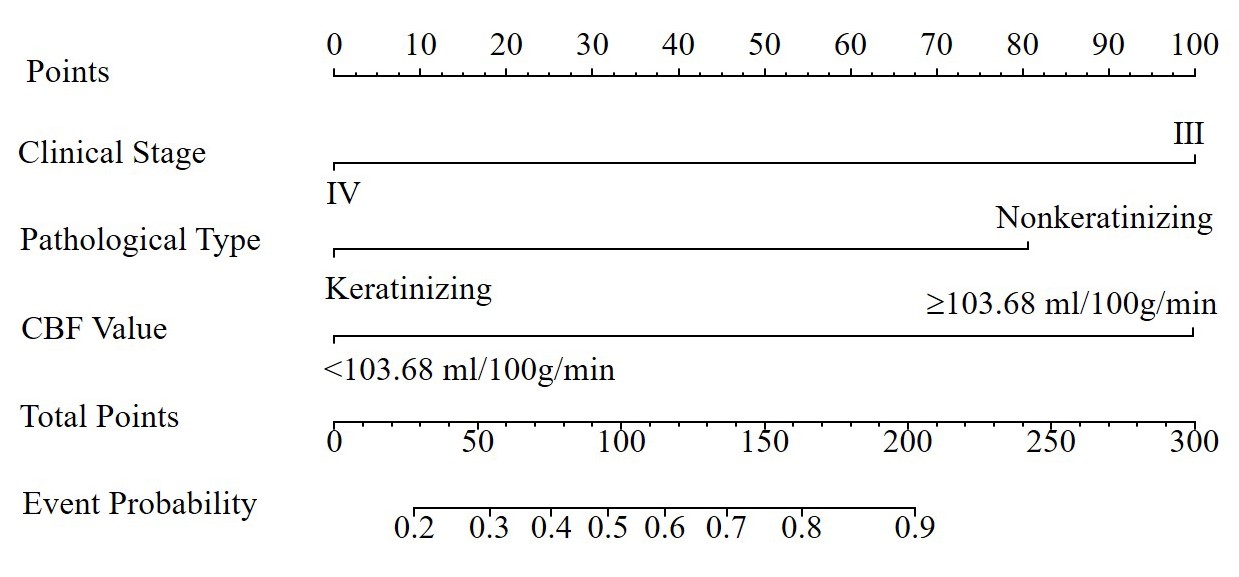
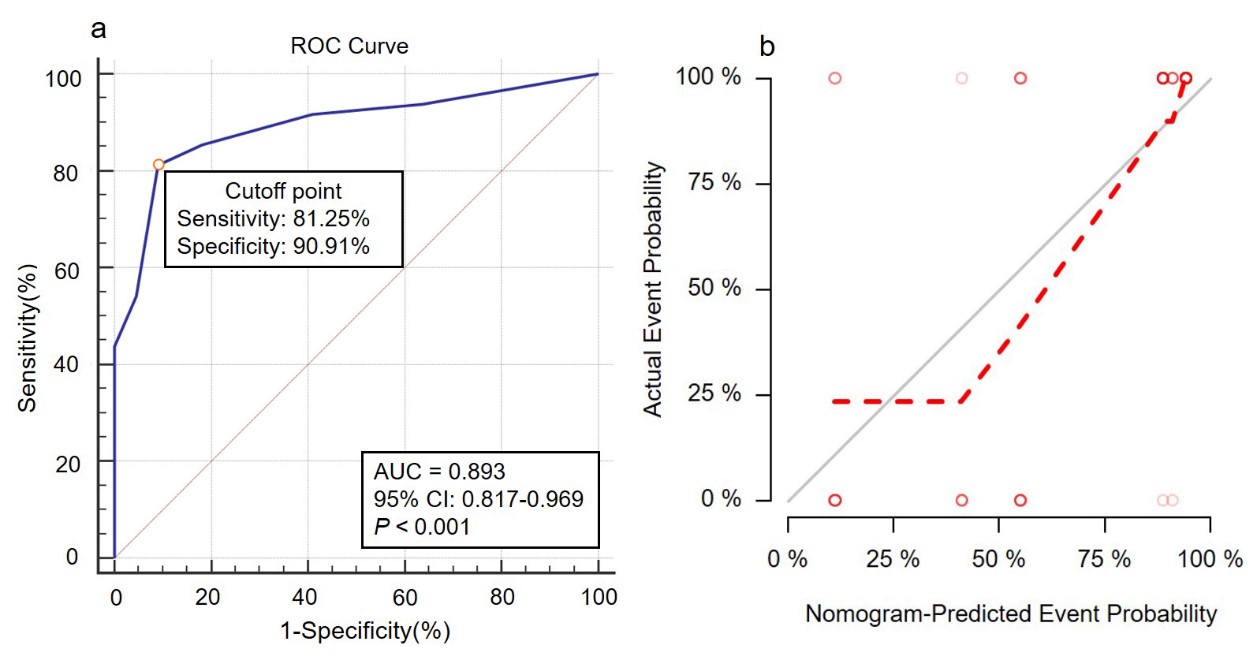
Nomogram was generated by binary logistic regression analysis to predict tumor response to CRT by incorporating three variables of BF, clinical stage and pathological type(Fig.3). Robust AUC of 0.893 , accuracy of 84.28%, sensitivity of 81.25% and specificity of 90.91% were obtained, respectively(Fig.4a). Moreover, a strong agreement was observed between nomogram prediction probability and actual clinical findings in calibration curve (P=0.309; Fig.4b).
Discussion and Conclusion
In this study, we mainly investigated the feasibility of 3D-pCASL in predicting the treatment response to CRT. 3D-pCASL derived BF showed higher tumor values in RG than NRG, and high AUC indicating a robust performance in predicting the response to CRT. Additionally, combining BF and clinicopathological variables, a nomogram as clinical predictive model was built, showing the best prediction in response to CRT for ANPC patients. This finding, being consistent with previous results, indicates that radiotherapy outcome of NPC was related to tumor angiogenesis6,7 and richer blood supply of tissues allowed higher concentration of chemotherapy drugs in tumor tissues, which could arise the response to CRT.8In conclusion, 3D-pCASL imaging could act as a noninvasive effective method to predict tumor response to CRT in ANPC patients before clinical treatment. Furthermore, the nomogram combining BF and clinicopathological variables could serve as a novel clinical analysis tool for treatment response prediction.
Acknowledgements
We thank Weiqiang Dou for help with the 3D pCASL perfusion imaging technology.References
1. Fei ZD, Xu T, Qiu XF, et al. Significance of boost dose for T4 nasopharyngeal carcinoma with residual primary lesion after intensity modulated radiotherapy. J Cancer Res Clin Oncol, 2021,147:2047-2055.
2. Yang J, Han J, He J, et al. Real-world cost effectiveness analysis of Gemcitabine and Cisplatin compared to Docetaxel and Cisplatin plus Fluorouracil induction chemotherapy in locoregionally advanced nasopharyngeal carcinoma. Front Oncol, 2020,10:594756.
3. Hui EP, Ma BBY, Chan ATC. The emerging data on choice of optimal therapy for locally advanced nasopharyngeal carcinoma. Curr Opin Oncol, 2020, 32:187-195.
4. Jezzard P, Chappell MA, Okell TW. Arterial spin labeling for the measurement of cerebral perfusion and angiography. J Cereb Blood Flow Metab, 2018, 38:603-626.
5. Schor-Bardach R, Alsop DC, Pedrosa I, et al. Does arterial spin-labeling MR imaging-measured tumor perfusion correlate with renal cell cancer response to antiangiogenic therapy in a mouse model? Radiology, 2009, 251:731-742.
6. Ma WL, Liu R, Huang LH, et al. Impact of polymorphisms in angiogenesis-related genes on clinical outcomes of radiotherapy in patients with nasopharyngeal carcinoma. Clin Exp Pharmacol Physiol, 2017, 44:539-548.
7. Xu Z, Fang S, Zuo Y, et al. Combination of pigment epithelium-derived factor with radiotherapy enhances the antitumor effects on nasopharyngeal carcinoma by downregulating vascular endothelial growth factor expression and angiogenesis. Cancer Science, 2011,102:1789-1798.
8. Zheng D, Yue Q, Ren W, et al. Early responses assessment of neoadjuvant chemotherapy in nasopharyngeal carcinoma by serial dynamic contrast-enhanced MR imaging. Magn Reson Imaging, 2017, 35:125-131.
Figures