4572
Arterial spin labeling estimation of penumbral tissue in acute ischemic stroke
Jinhao Lyu1 and Xin Lou1
1Chinese PLA General Hospital, Beijing, China
1Chinese PLA General Hospital, Beijing, China
Synopsis
Penumbral tissue identification is critical for the treatment decision for patients with acute ischemic stroke. In the present study, we aimed to assess the impact of arterial spin labeling (ASL) at different post-labeling delays (PLDs) in penumbral tissue quantification, and compare their performances in patients’ selection for endovascular treatment with dynamic susceptibility contrast as reference. The results showed ASL appears to persistently overestimate penumbral tissue in acute ischemic stroke. PLD shows substantial impact on quantification of hypoperfusion volume. Long PLD, 2500ms for example, is preferable in penumbral tissue detection and patients’ selection.
INTRODUCTION
Penumbral tissue quantification by imaging is critical for the treatment decision in patients with acute ischemic stroke.1 CT perfusion, dynamic susceptibility contrast (DSC), and diffusion-weighted imaging (DWI) have been widely implemented in recent clinical trials to quantify penumbral tissue by critical hypoperfusion – ischemic core mismatch paradigm. Arterial spin labeling, as a noninvasive perfusion imaging without contrast agent administration, has shown feasibility in the qualitative assessment of perfusion-core mismatch. Though ASL shows promising in stroke imaging, it has not been routinely applied in clinic scenarios. Challenges arise from the fact that overestimation of the critically hypoperfused tissue occurs by using ASL. There are many parameters that may affect the measurement of hypoperfusion on ASL.2 The influence of post-labeling delay (PLD), a key parameter for cerebral blood flow (CBF) quantification, has not been investigated. In the present study, we aimed to assess the impact of ASL at different post-labeling delays in penumbral tissue quantification, and compare their performances in patients’ selection for endovascular treatment with DSC as reference.METHODS
Twenty consecutive patients with acute ischemic stroke due to middle cerebral artery or internal carotid artery occlusion with symptom onset to imaging within 24 hours between January 2019 to December 2019 were selected from a prospective multicenter study. Both ASL at PLD of 1500ms, 2500ms, and DSC along with routine head MRI were conducted in one scan. Hypoperfusion volume on the CBF map generated from ASL was segmented and measured by applying adaptive thresholds and seed growing methods using in-house developed software. Hypoperfusion volume on parameter maps from DSC defined as volume of time to maximum of the residue function (Tmax) > 6s by using software PMA (Version 5.05, available at http://asist.umin.jp/) which applied delay-sensitive standard singular-value decomposition method. Leaner regression, intraclass correlation (ICC), and Bland-Altman plot were used to depict the correlation and the agreement of quantitative measures obtained from ASL and DSC. Patients eligible for endovascular treatment were identified according to imaging criteria of The Endovascular Therapy Following Imaging Evaluation for Ischemic Stroke (DEFUSE 3) trial.3 Kappa was calculated to evaluate the agreement between ASL at each PLD and DSC in patients’ selection.RESULTS
The mean age of the patients was 57.3 ± 15.57 years, and there were 14 males. Patients’ demographics were listed in Figure 1. The mean infarct core volume was 41.99 ± 48.86 ml. The mean hypoperfusion volume was 173.2 ± 91.4 on 1500ms ASL, 80.58 ± 59.66 on 2500ms ASL and 66.14 ± 40.17 ml on Tmax > 6s. There was no significant difference between hypoperfusion volume on 2500ms ASL and Tmax > 6s, while a significant difference was shown between hypoperfusion volume on 1500ms ASL and Tmax > 6s (Figure 2). Hypoperfusion volume on 1500ms ASL was weakly correlated with volume of Tmax > 6s (r=0.249) while hypoperfusion volume on 2500ms ASL was moderately correlated with volume of Tmax > 6s (r=0.463). ICC was 0.371 (95% confidence interval [CI] -0.074 to 0.693) for hypoperfusion volume on 1500ms ASL and Tmax > 6s, and was 0.651 (95% CI 0.304 to 0.846) for hypoperfusion volume on 2500ms ASL and Tmax > 6s which indicated good measurements agreement. The Bland-Altman plots showed that the mean volumetric difference between the hypoperfusion volume measured by Tmax > 6s and 1500/2500ms ASL was 107.1 ml versus 14.44 ml. Figure 3 shows correlation and Bland-Altman plots for hypoperfusion volume on 1500/2500ms ASL and Tmax > 6s. In identifying patients eligible for endovascular treatment according to DEFUSE 3 imaging criteria, Kappa was 0.500 (95% CI 0.171 to 0.829) for DSC and 1500ms ASL and was 0.700 (95% CI 0.389 to 1.000) for DSC and 2500ms ASL which indicated substantial agreement. A representative case of a 60-year-old female with acute left middle cerebral artery occlusion was shown in Figure 4.CONCLUSION
In acute ischemic stroke, ASL appears to persistently overestimate penumbral tissue. PLD shows substantial impact on quantification of hypoperfusion volume. Long PLD, 2500ms for example, is preferable in penumbral tissue detection and patients’ selection.Acknowledgements
NoneReferences
1. Powers WJ, Rabinstein AA, Ackerson T, et al. 2018 Guidelines for the Early Management of Patients With Acute Ischemic Stroke: A Guideline for Healthcare Professionals From the American Heart Association/American Stroke Association. Stroke. 2018;49(3):e46–e110.2. Alsop DC, Detre JA, Golay X, et al. Recommended implementation of arterial spin-labeled perfusion MRI for clinical applications: A consensus of the ISMRM perfusion study group and the European consortium for ASL in dementia. Magn Reson Med. 2015;73(1):102–116.
3. Albers GW, Marks MP, Kemp S, et al. Thrombectomy for Stroke at 6 to 16 Hours with Selection by Perfusion Imaging. N Engl J Med. 2018;378(8):708–718.
Figures
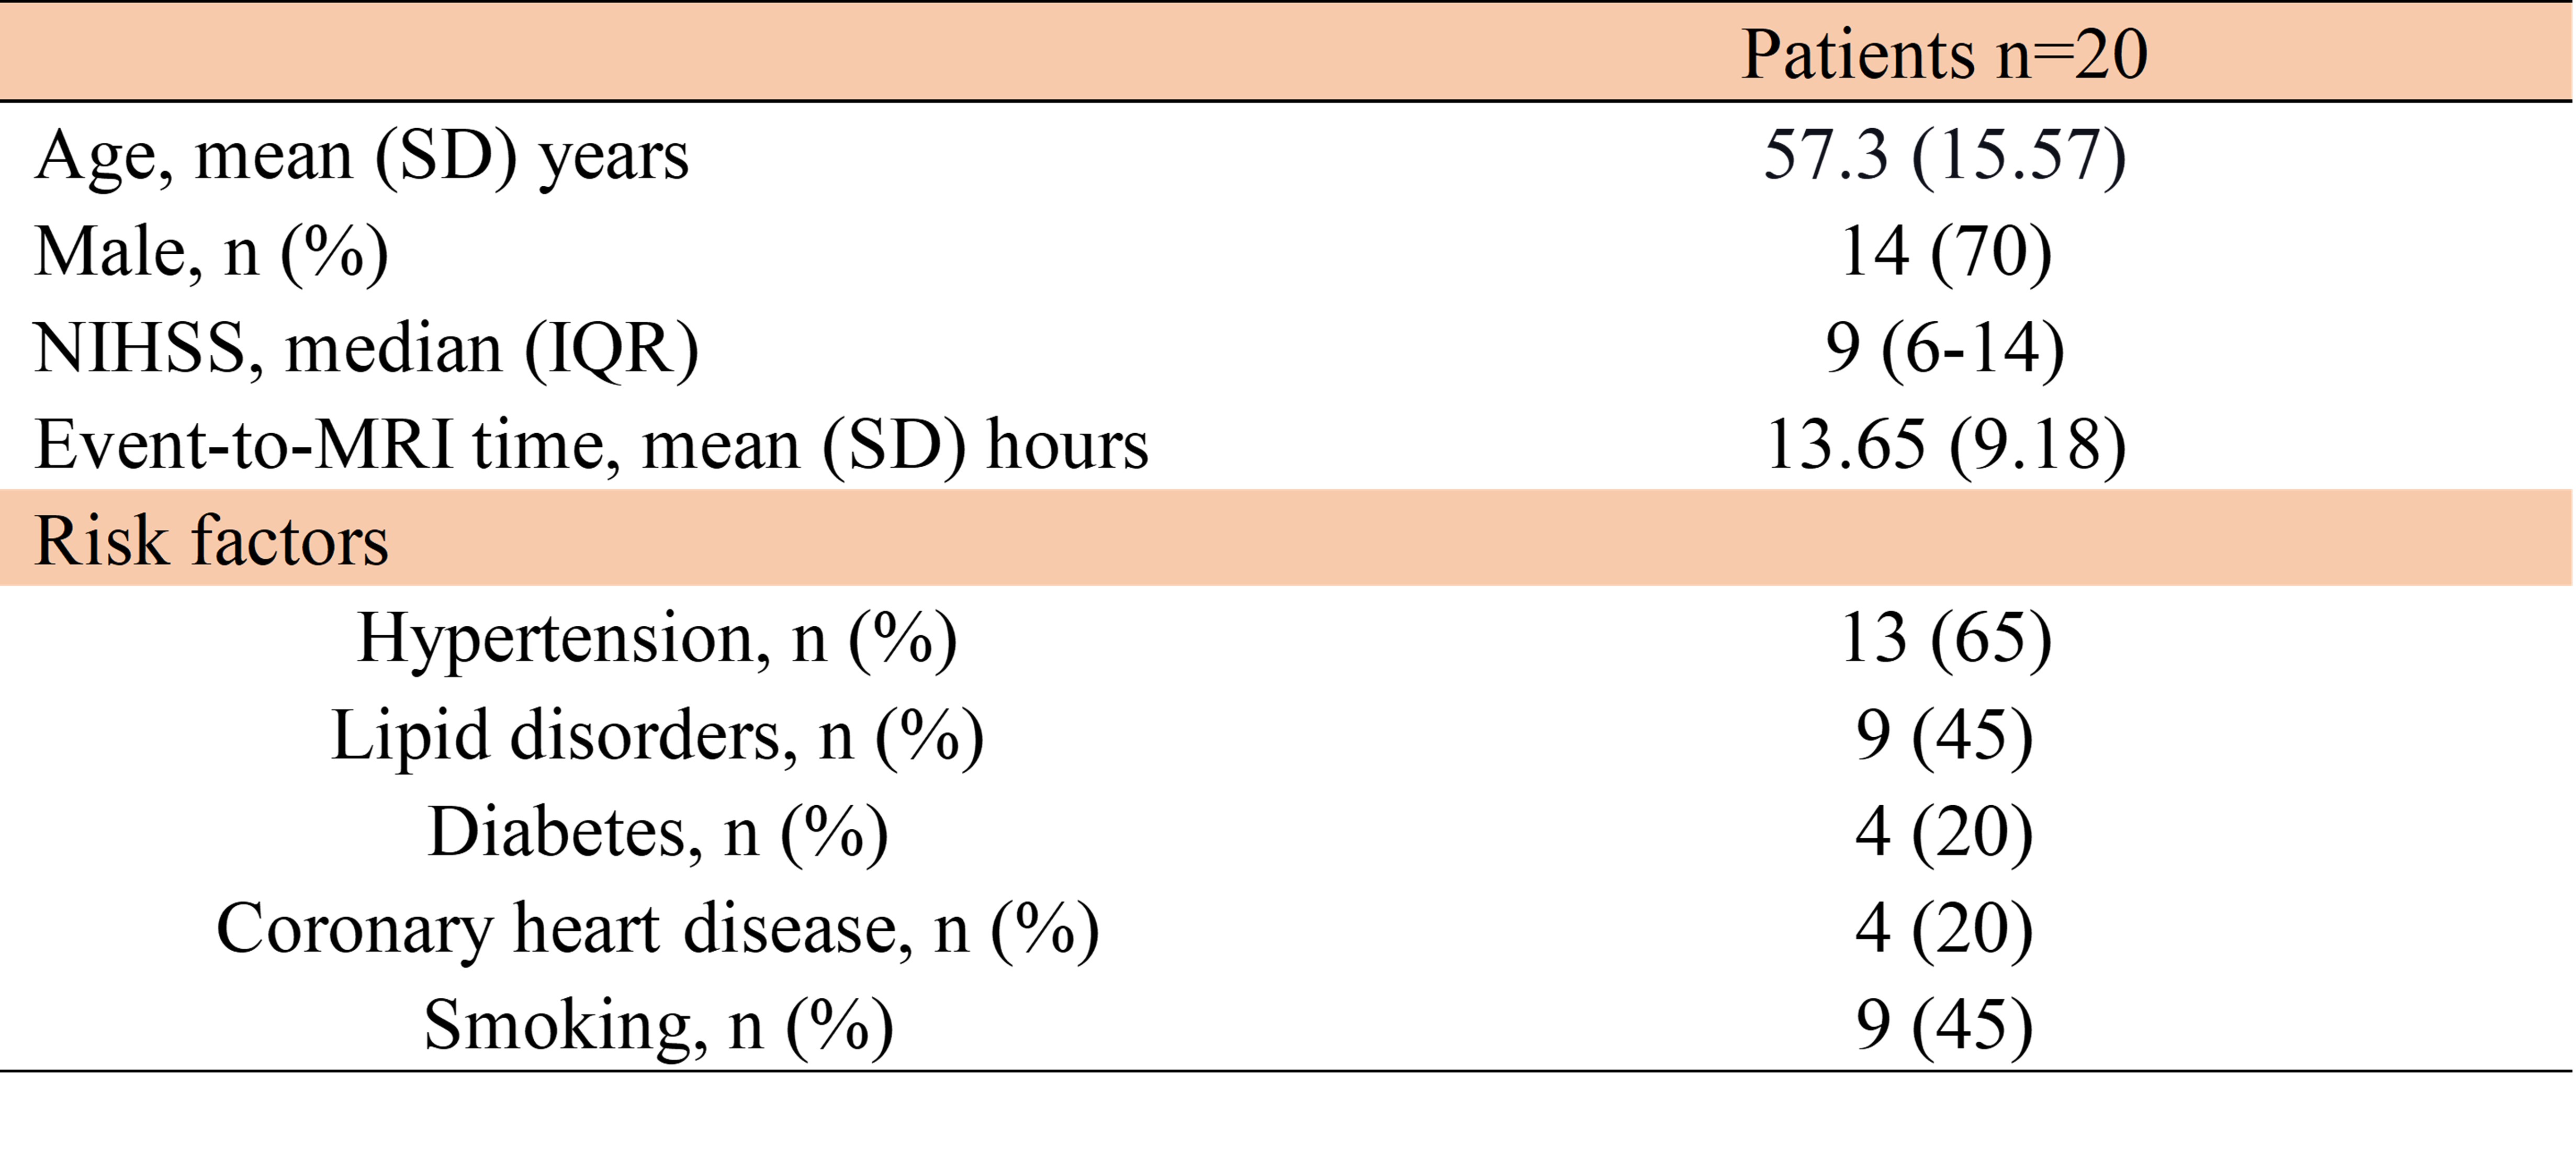
Figure 1 Patients’ demographics. NIHSS, National
Institute of Health stroke scale. SD, standard deviation. IQR, interquartile
range.
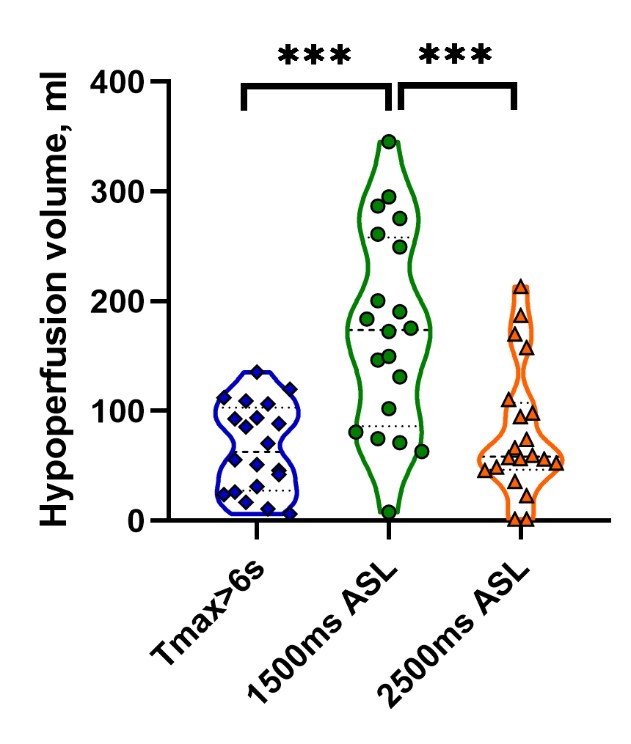
Figure 2 Violin plot of hypoperfusion volume
of different measurements. ASL, arterial spin labeling. Tmax, time to maximum
of the residue function. *** indicates p < 0.0001.
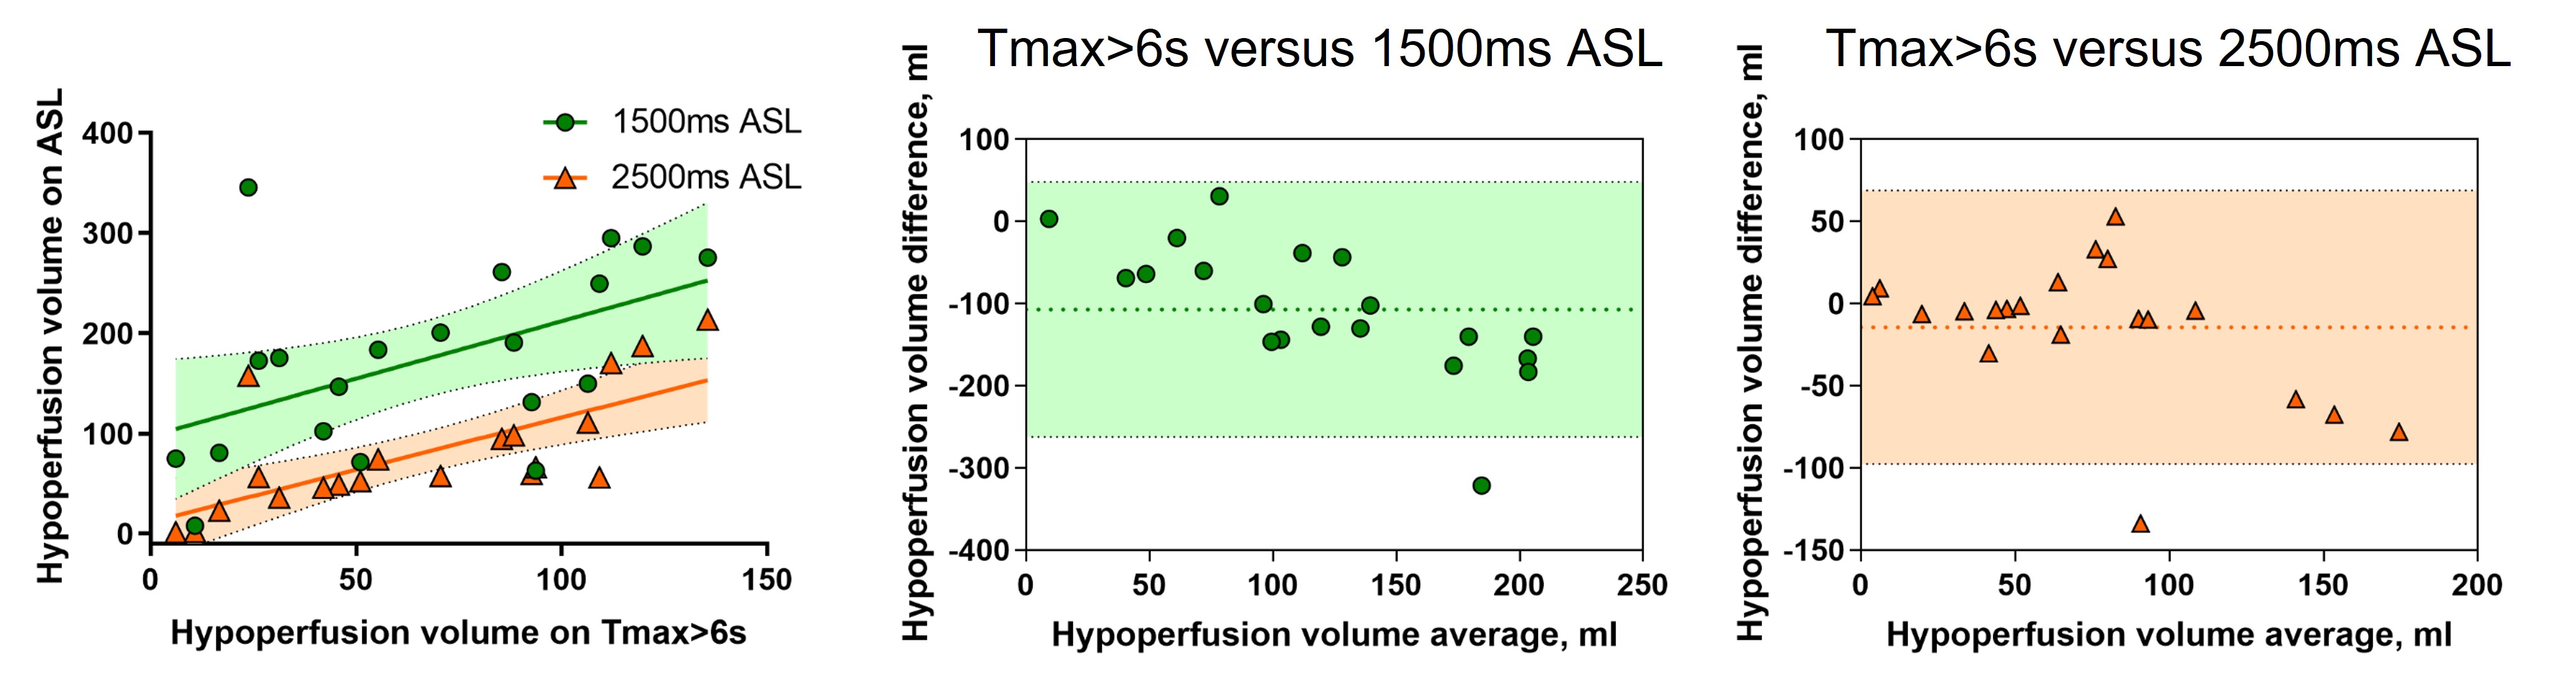
Figure 3 Correlation and Bland-Altman plots
for hypoperfusion volume on 1500/2500ms ASL and Tmax > 6s. ASL, arterial
spin labeling. Tmax, time to maximum of the residue function.
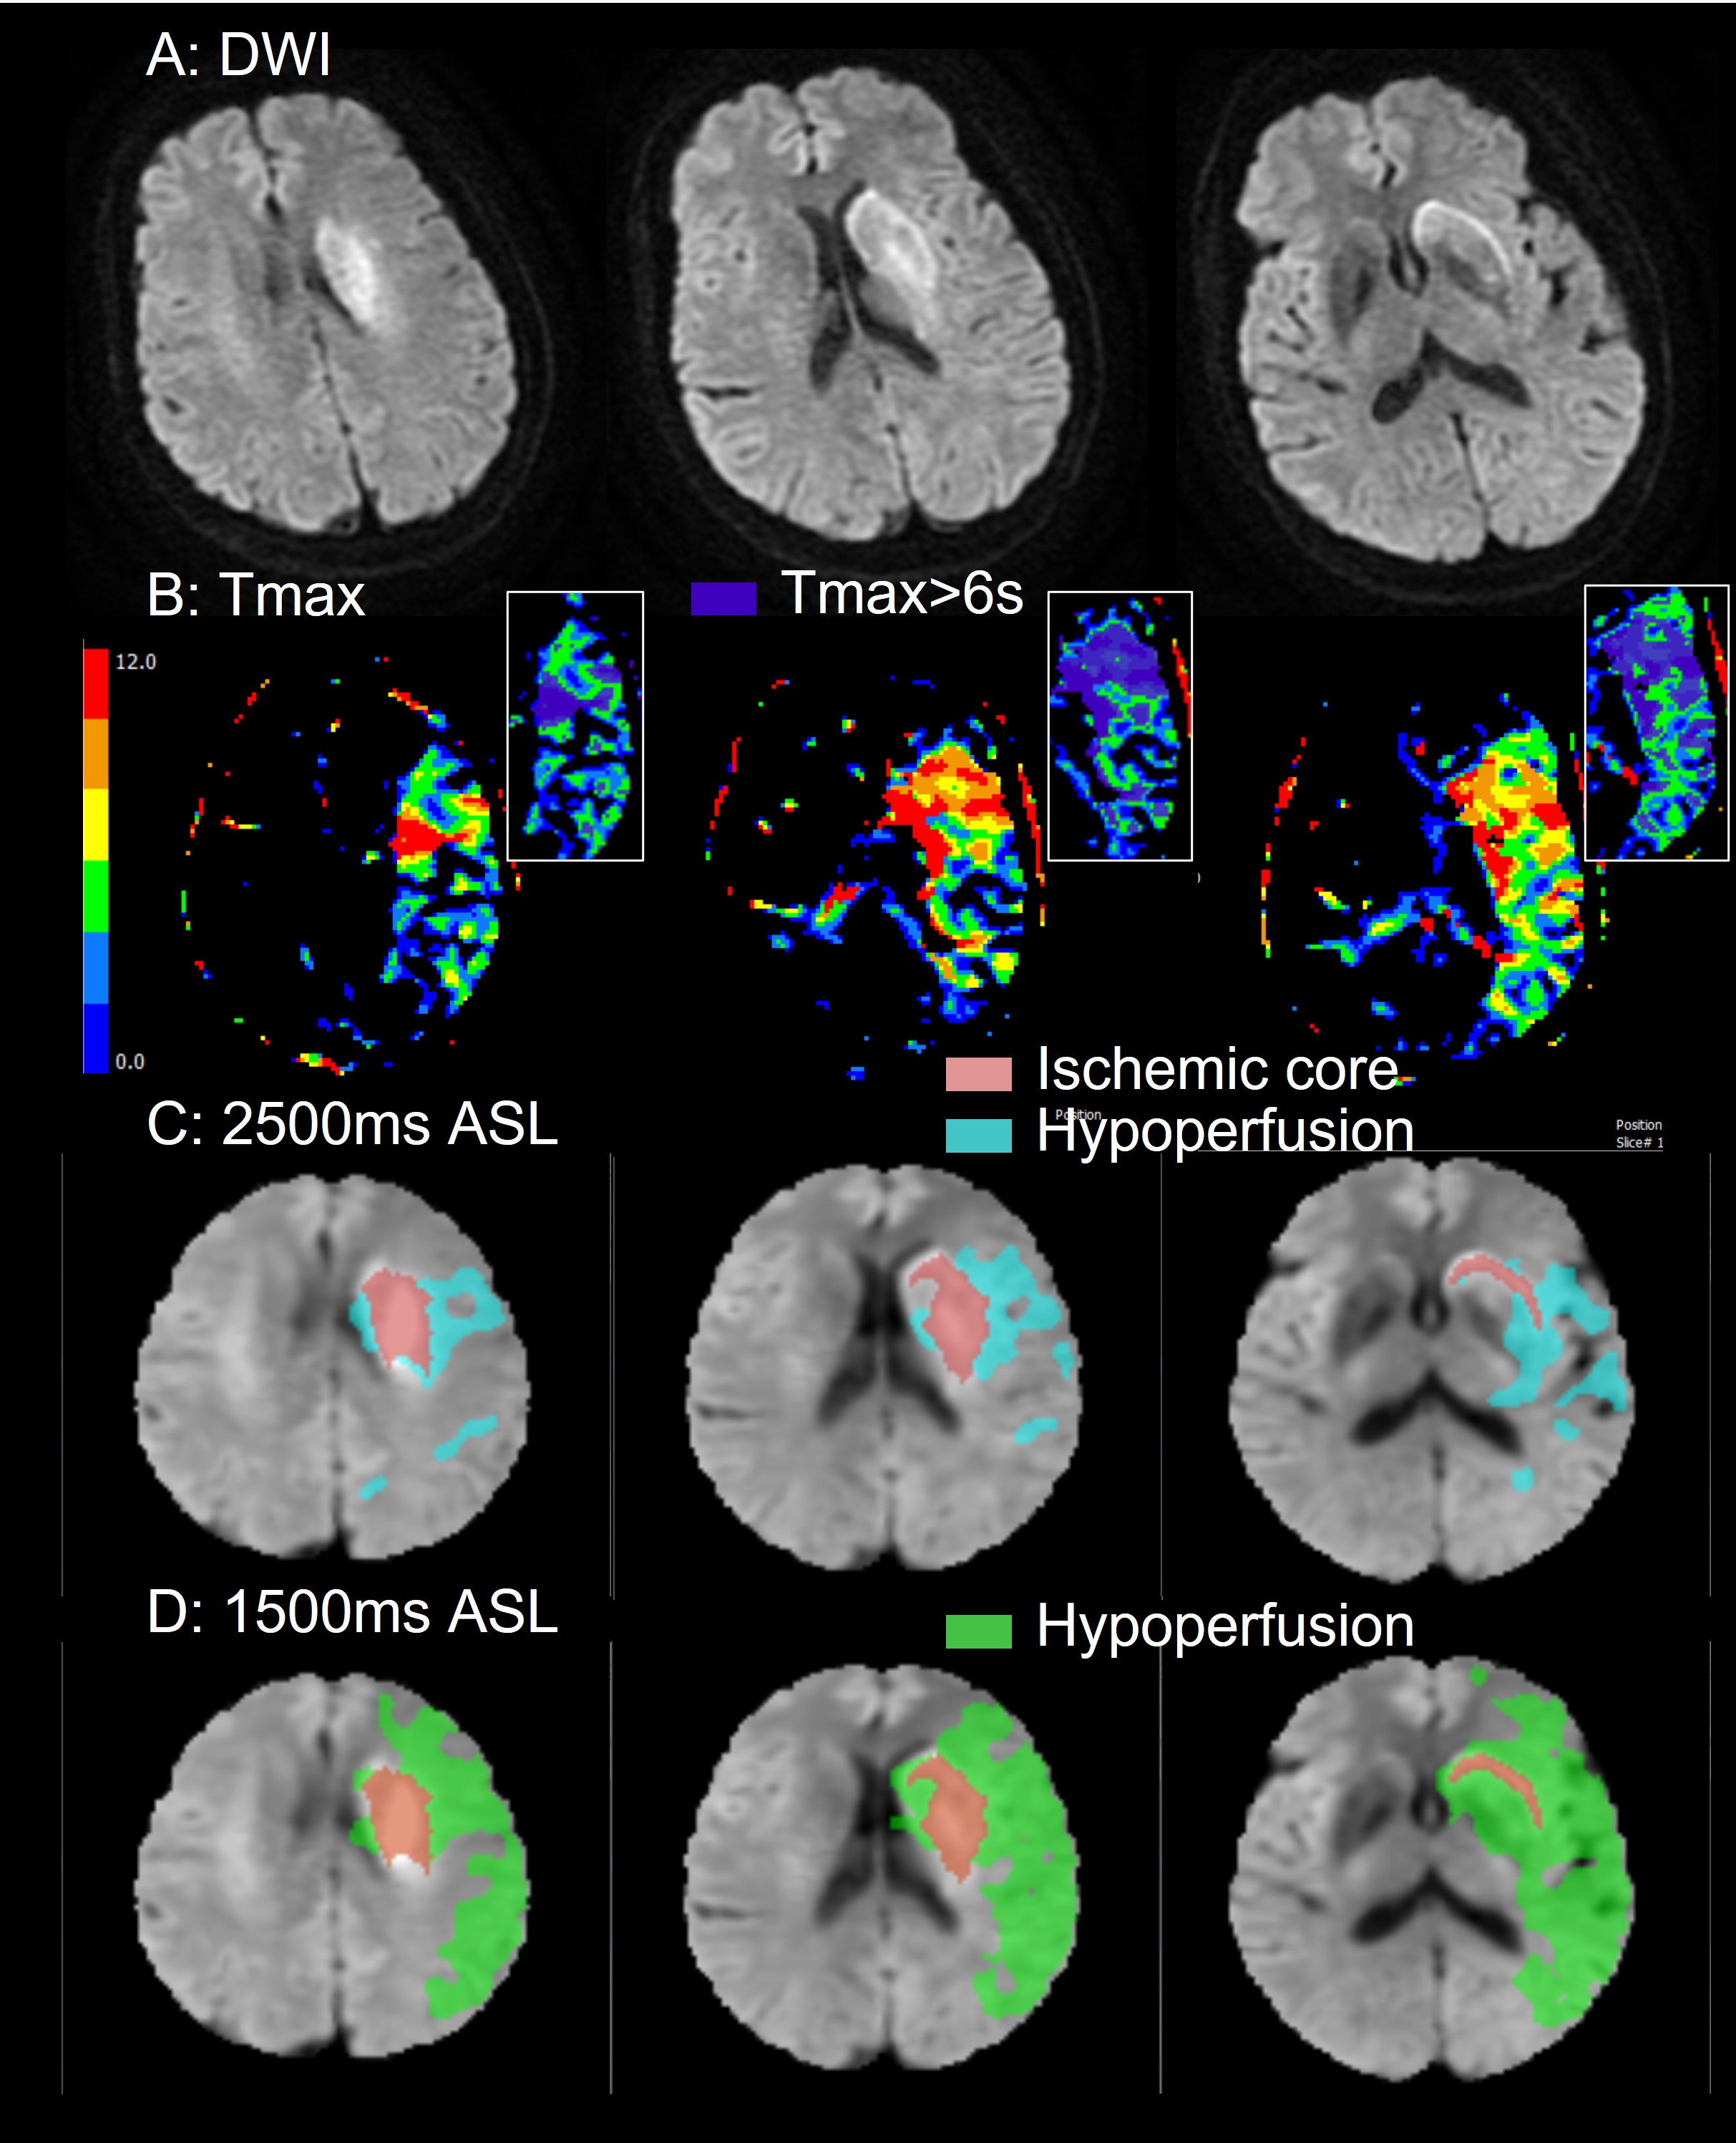
Figure 4 A representative case of a 60-year-old female with acute left middle
cerebral artery occlusion shows left basal ganglia infarction (A), the infarct
core volume was 19.85ml. The volume of hypoperfusion on Tmax>6s (B), 2500ms ASL (C), and 1500ms ASL (D) were measured as 85.44ml, 261.17ml, and 94.66ml,
respectively. Hypoperfusion mask in cyan on 2500ms ASL (C) shows good agreement in
location and extent with the region with Tmax>6s in blue(B). DWI,
diffusion-weighted imaging. ASL, arterial spin labeling. Tmax, time to maximum of the residue
function.
DOI: https://doi.org/10.58530/2022/4572