4569
Prediction of the changes in myocardial of patients with cardiomyopathy using T1rho mapping1Medical Imaging Center, People's Hospital of Ningxia Hui Autonomous Region, Yinchuan, China, 2Philips Healthcare, Beijing, China
Synopsis
The study is to determine clinical utility of T1rho to detect patients with cardiomyopathy. In the LGE positive group, the T1 mapping values and ECV values in the lesion area were significantly higher than those in the LGE negative group and the normal control group, while the T1rho values in the lesion area were significantly lower than those in the LGE negative and normal groups, and the display range of lesions was in good consistency with LGE and ECV. It can be used as an endogenous diagnostic index when myocardial structure changes.
Introduction
The current reference standard for detection of myocardial scar tissue is late gadolinium enhancement (LGE). It is a validated method with a high sensitivity to discriminate infarcted from health myocardium. Cardiac magnetic resonance (CMR) T 1 mapping is a technique that enables quantification of extracellular volume fraction (ECV)[2]. However, calculating ECV mapping need to inject gadolinium contrast agent, which may be contraindicated in some patients. For those patients, T1 rho contrast may help them find the changes in myocardial because T1rho MRI has been used to detect early myocardial infarction in swine model.[3] T1rho relaxation time is sensitive to changes in macromolecular. In this study, we propose to use T1rho mapping to assess the changes in myocardial of patients with cardiomyopathy comparing with T1 mapping and ECV values.Methods
All CMR data were acquired on a 3.0T scanner (Ingenia CX, Best, The Netherlands). 6 patients with cardiomyopathy with obvious LGE high signals, 5 patients with cardiomyopathy without obvious LGE high signals and 5 health volunteers were recruited between Feb 2021 to Oct 2021. The study was approved by the IRB of Ningxia Hui Autonomous Region Hospital and written informed consent was obtained from all the patients. The CMR imaging protocol consisted of routine sequences (CINE, native T1, after 10 min, LGE and, enhanced T1) and a T1rho mapping before injecting contrast. The T1rho images were obtained using an electrocardiogram (ECG)-gated T1rho prepared gradient echo sequence in three short-axis slices from the base to the apex. Each slice can obtain four T1rho images with different time of spin locking (TSL) within a single breath-hold. Imaging parameters were: repetition time (TR) 2.5 ms, echo time (TE) 1.09 ms, flip angle 35, bandwidth 606 Hz/Px, field-of-view (FOV) 360 mm* 297 mm, voxel size 2.0mm * 2.0 mm * 8.0 mm, TSL 0, 13.3, 26.7, 40 ms.Data analysis
All CMR analysis was performed by the same CMR technician using commercial software CVI42 version 5.2 (Circle Cardiovascular Imaging Inc., Calgary, Canada). The T1rho mapping was calculated by using different TSLs automatically. 8 regions of interest (ROIs) were draw on each slice of T1rho by a radiologist with 10 years of experience, referring to the LGE images, especially myocardial fibrosis tissues. The diagnostic performances to differentiate cardiomyopathy and health myocardial by using T1 mapping, ECV mapping and T1rho mapping. Statistical analysis was performed using SPSS 26.0 software. Native T1 value, ECV and T1rho at the end of diastole were measured data, which were in accordance with normal distribution, represented by mean ± SD. The differences of Native T1 values, ECV values and T1rho values among all myocardium segments of LGE positive myocardium, non-enhanced myocardium and normal control group were analyzed by one-way ANOVA and LSD comparison. Relationships between variables were determined by Pearson correlation. All the comparisons and correlations were two-tailed, P<0.05 was considered statistically significant.
Results
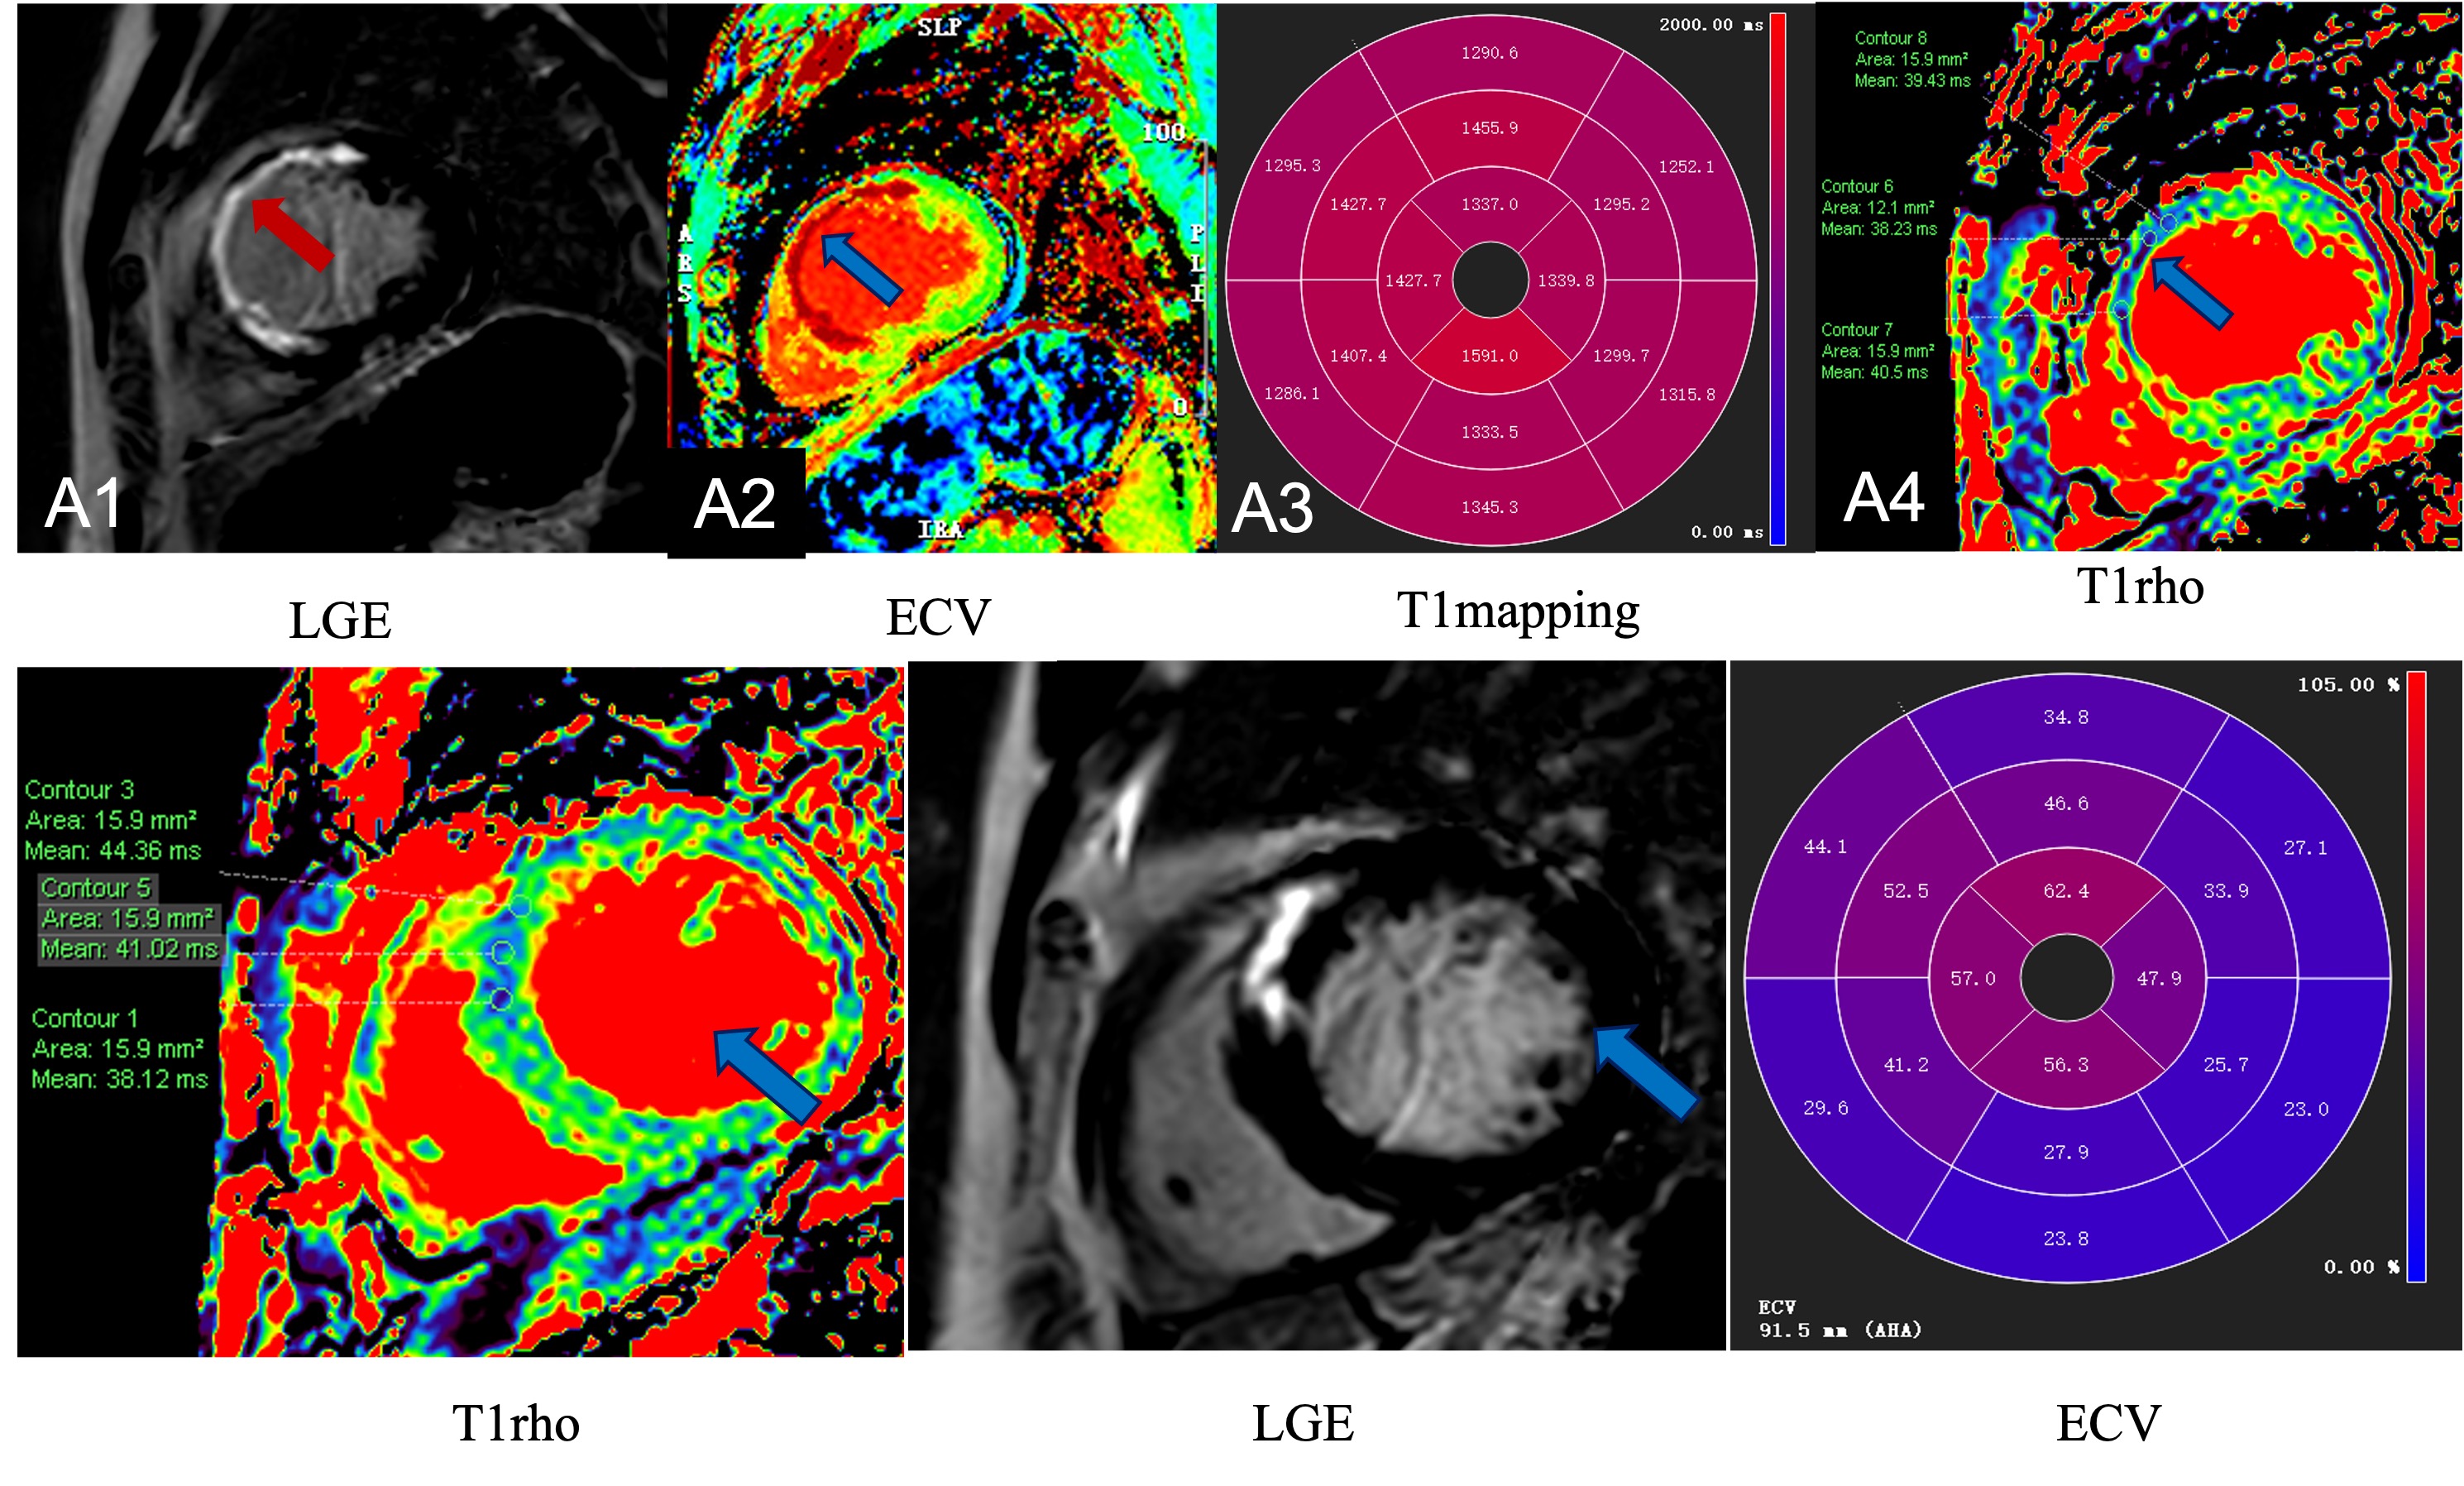
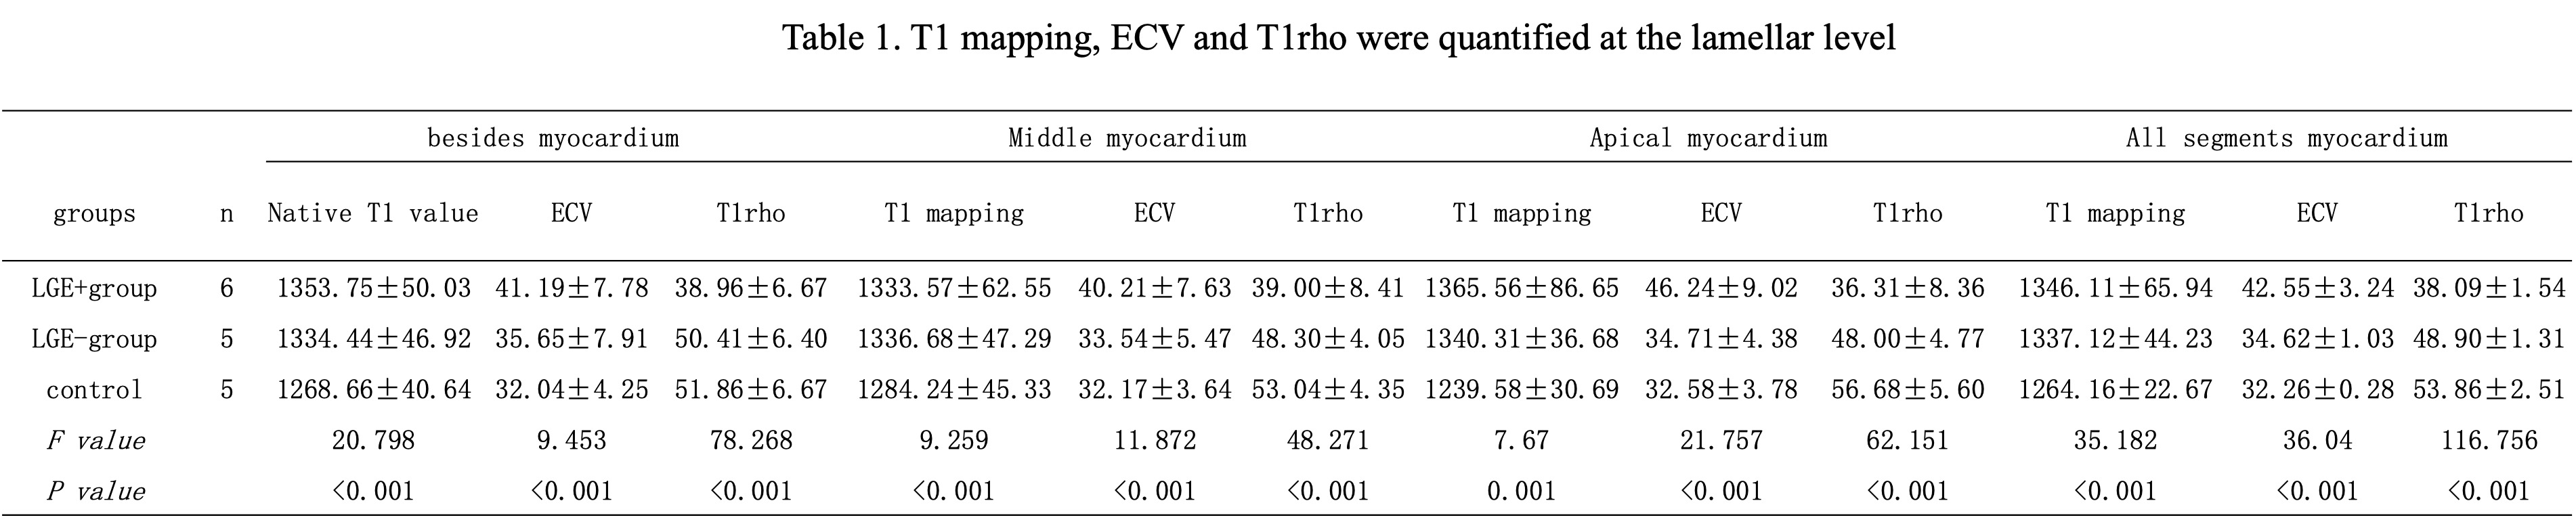
The ROI placement and mean T1rho of one patient was shown in Figure 1. The T1rho values of health volunteers, patients with LGE-group and LGE+group were 53.86±2.51, 48.90±1.31, 38.09±1.54, respectively. T1 mapping values of health volunteers, patients with LGE-group and LGE+group were 1264.16±22.67, 1337.12±44.24, 1346.11±65.93, respectively. ECV values of health volunteers, patients were 32.26±0.28, 34.62±1.03, 42.55±3.24, respectively. The correlation of them were shown in Table 1. LGE (+) group had a higher T1 mapping value(1337.12±44.24ms for LGE (+) group VS 1346.11±65.93ms for LGE (-) group,P=0.117)and significant higher ECV (42.55±3.24ms for LGE (+) group VS 34.62±1.03ms for LGE (-) group,P<0.001).The T1rho value of LGE (+) group was significant lower (38.09±1.54ms for LGE (+) group vs for 48.90±1.31ms LGE (-) group,P<0.001).The T1rho value and ECV for health volunteers, patients were all Significant statistical difference(P<0.001,P<0.001,P=0.019, P<0.001, P<0.001, P<0.001).The fibrosis tissues by T1rho correlated significantly with that assessed by ECV(R=0.463,P<0.001)Discussion
This study shown a sensitive index can detect for the change of cardiomyopathy without contrast agent. LGE-MRI is the gold standard for in vivo detection of localized myocardial fibrosis, and ECV can be used for quantitative assessment of localized and diffuse fibrosis. However, both techniques rely on gadolinium contrast agents, which have a risk for inducing nephrogenic systemic fibrosis. T1rho can evaluate myocardial fibrosis without contrast agent. In this study, in the LGE positive group, the T1 mapping values and ECV values in the lesion area were significantly higher than those in the LGE negative group and the normal control group, while the T1rho values in the lesion area was significantly lower than those in the LGE negative and normal groups, and the display range of lesions were in good consistency with LGE and ECV. It can be used as an endogenous diagnostic index when myocardial structure changes.Conclusion
In conclusion, the changes of myocardial assessed by T1rho CMR was in good correlation with LGE. It is a potential predictor to detect cardiomyopathy for patients and provides an option for cardiomyopathy with contrast agent contraindications.Acknowledgements
NoneReferences
[1] Nacif MS, Arai AE, Lima JAC, Bluemke DA. Gadolinium-enhanced cardiovascular magnetic resonance: administered dose in relationship to United States Food and Drug Administration (FDA) guidelines. J Cardiovasc Magn Reson. 2012; 14:18.
[2] Broberg CS, Chugh SS, Conklin C, Sahn DJ, Jerosch-Herold M. Quantification of diffuse myocardial fibrosis and its association with myocardial dysfunction in congenital heart disease. Circ Cardiovasc Imaging 2010;3:727–34
[3] Witschey W, Pilla J, Kevin FG, Koomalsingh. Rotating frame spin lattice relaxation in a swine model of chronic, left ventricular myocardial infarction. Magn Reson Med. 2010; 64:1453–60
Figures