4565
Simultaneous late-gadolinium enhancement and T1 mapping to detect diffuse myocardial fibrosis in 1K/DOCA/salt-induced mice using MP2RAGE1Monash Biomedical Imaging, Monash University, Clayton, Australia, 2Monash Biomedicine Discovery Institute and Department of Pharmacology, Monash University, Clayton, Australia
Synopsis
The detection and localization of diffuse myocardial fibrosis is for the non-invasive evaluation of therapeutic strategies in murine cardiac disease models. Cardiac late-gadolinium enhancement (LGE) and T1 mapping are two techniques for non-invasive cardiovascular magnetic resonance (CMR) imaging. This abstract demonstrates that the magnetization prepared 2 rapid acquisition gradient echo (MP2RAGE) can simultaneously acquire LGE and T1 maps for the detection of diffuse myocardial fibrosis in a 1K/DOCA/salt-induced murine model of hypertensive disease.
Introduction
Late-gadolinium enhancement (LGE) is the gold standard in assessing myocardial fibrosis in clinical CMR1. A T1-weighted inversion recovery sequence is normally applied in LGE for nulling normal tissue, thereby generating high contrast between viable and nonviable myocardium, and is predominantly used to detect focal fibrosis rather than diffuse fibrosis. Myocardial T1 mapping can establish a quantitative threshold allowing the detection of diffuse fibrosis2. However, LGE and T1 mapping are generally scanned using two separate sequences which takes additional time and requires registration to combine the results. MP2RAGE sequence can generate two T1-weighted images with different inversion times (TIs), which can be further used to compute T1 maps3. Our aim was to use the MP2RAGE sequence to achieve LGE and T1 mapping simultaneously for the detection of diffuse myocardial fibrosis in 1K/DOCA/salt-induced hypertensive mouse model4.Materials and Methods
All MRI experiments were performed on a Bruker BioSpec 9.4T scanner (Bruker BioSpin GmbH, Ettlingen, Germany) with a Bruker 86 mm volume transmitter coil and 4-array mouse heart receiver coil. Two 1K/DOCA/salt-induced mice 4 were scanned in this study. Simultaneous respiration and ECG triggering (SA Instruments, Stony Brook, NY) were used to monitor the cardiac cycle and respiratory motion. LGE CMR imaging using MP2RAGE was performed 36 mins after intraperitoneal injection of a bolus of Gd-DPTA (Magnevist, Schering Healthcare, UK). The mice were maintained on 1-1.5% isoflurane anaesthesia throughout the imaging session.Data Acquisition
A 3D MP2RAGE sequence was used with the following parameters: inversion pulse =180°, TI1= 410 ms, TI2=1280 ms, MP2RAGE TR=1500 ms, α1 = α2 = 8°, Inter-echo repetition time = 5 ms, echo time TE = 1.8 ms, FOV =19.2*19.2*7.2 mm3, matrix = 96*96*12, resolution = 0.2*0.2*0.6 mm3, segments = 4. T1 maps were computed by qMRLab5.Results and Discussion
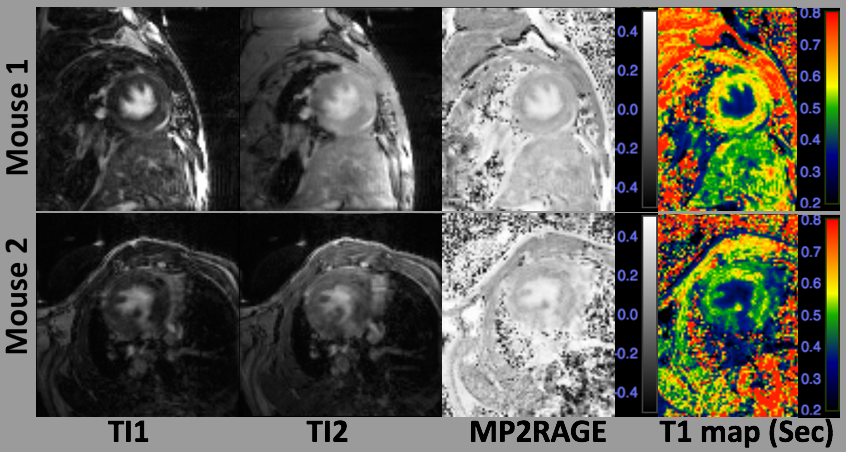
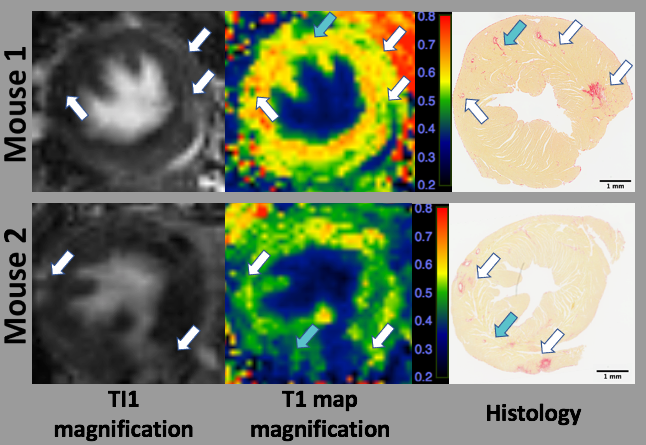
Figure 1 shows the magnitude images of TI1 and TI2, MP2RAGE images, and the corresponding T1 maps for two 1K/DOCA/salt-induced mice. Widespread high intensities were found in the TI1 images in both mice (first column of Figure 1). Similar high intensities can also be observed in the TI2 images (second column of Figure 1), while the normal tissues were not nulled. MP2RAGE images were combined by the magnitude and phase images of both TIs (third column of Figure 1). T1 maps were computed based on MP2RAGE images (Fourth column of Figure 1). The areas with low T1 values on T1 maps were larger than those found in the T1-weighted images of the individual TIs. Interestingly, fibrosis was found to be distributed as punctate areas throughout the left ventricular walls in both mice.Figure 2 shows the magnifications of TI1, T1 maps and the results from picrosirius red-stained interstitial fibrosis. The punctate high intensity areas found in the TI1 images were consistent with the T1 map and appeared to correspond to fibrotic areas (red-stained) identified by histology (white arrows in Figure 2). Some of the fibrosis detected by histology was consistent with the low T1 areas in the T1 map (blue arrows in Figure 2), but these did not always correlate with areas of high intensity in the corresponding TI1 image.
Diffuse fibrosis was detected by both TIs of the MP2RAGE sequence in 1K/DOCA/salt-injured mice. Generating the MP2RAGE images by nulling the normal tissue in the TI1 provided more contrast and enhanced detection of cardiac fibrosis, similar to traditional LGE imaging. The T1 maps computed from the MP2RAGE data can provide quantification of diffuse fibrosis which are more reliable and sensitive compared with the MP2RAGE T1-weighted images. No image registration was needed for LGE and T1 mapping using MP2RAGE.
Conclusions
LGE and T1 mapping can be achieved simultaneously using a single MP2RAGE sequence to provide increased contrast to detect diffuse cardiac fibrosis in the 1K/DOCA/salt-induced hypertensive mouse model.Acknowledgements
We would like to acknowledge the support of the Australian National Imaging Facility Fellowship.References
1. Schelbert EB, Hsu LY, Anderson SA, et al. Late gadolinium-enhancement cardiac magnetic resonance identifies postinfarction myocardial fibrosis and the border zone at the near cellular level in ex vivo rat heart. Circ Cardiovasc Imaging. 2010;3(6):743-52.
2. Haaf P, Garg P, Messroghli DR, et al. Cardiac T1 Mapping and Extracellular Volume (ECV) in clinical practice: a comprehensive review. J Cardiovasc Magn Reson. 2016;18(1):89.
3. Marques JP, Kober T, Krueger G, et al. MP2RAGE, a self bias-field corrected sequence for improved segmentation and T1-mapping at high field. Neuroimage. 2010;49(2):1271-81.
4. Li Y, Shen M, Ferens D, et al. Combining mesenchymal stem cells with serelaxin provides enhanced renoprotection against 1K/DOCA/salt-induced hypertension. Br J Pharmacol. 2021;178(5):1164-1181.
5. Karakuzu A, Boudreau M, Duval T, et al. qMRLab: Quantitative MRI analysis, under one umbrella. 2020. 10.21105/joss.02343.
Figures