4563
Feasibility of fractal analysis in the diagnosis of hypertrophic cardiomyopathy patients using strain analysis as reference1The Second Affiliated Hospital of Nanchang University, Nanchang, China, 2MR Research, GE Healthcare, Beijing, China
Synopsis
Pathological changes vary in the morphology and function during the process of hypertrophic cardiomyopathy. In this study, we compared the diagnostic value of fractal analysis and tissue tracking on cardiovascular magnetic resonance images to characterize the trabecular complexity as myocardial strain alteration for HCM.
Introduction
Abnormal myocardial motion and deformation occur in the course of hypertrophic cardiomyopathy (HCM) [1] and myocardial hyper-trabecular [2-4]. Many documents show that Ttissue tracking plays an important role in the diagnosis and evaluation of hypertrophic cardiomyopathy [5]. CMR tissue tracking has been proposed to quantitatively assess myocardial strain in reflection of global and regional LV function. Fractal analysis can determine the degree of myocardial hyper-trabecular in also provision ofde an early assessment of on hypertrophic cardiomyopathy ,by judging the degree of myocardial hyper-trabecular [2, 6]. As far as we know, there is no study investigate the difference of trabecularization in HCM patients and gender- and age-matched healthy volunteers.Clinically, which of the two imaging techniques has higher diagnostic value? In this study, we aimed to explore the feasibility of compared the diagnostic value of fractal analysis in trabecularization using and tissue strain analysis tracking as reference.Materials and methods
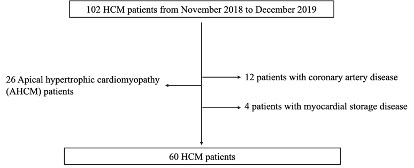
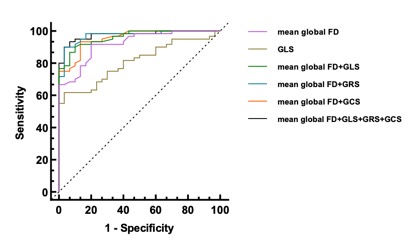
60 patients with HCM and 30 healthy controls were studied.Fractal analysis was performed on the end-diastolic frames of each short-axis slice in the LV stacks. The global and regional LV fractional dimensions (FDs) and LV myocardial deformation were compared between the two groups. CMR tissue tracking has been proposed to quantitatively assess myocardial strain in reflection of global and regional LV function. The global radial, circumferential, longitudinal strain (GRS, GCS and GLS) for LV were measured. Receiver operating characteristics (ROC) curve was used to derive the cutoff to distinguish HCM from the controls.Results
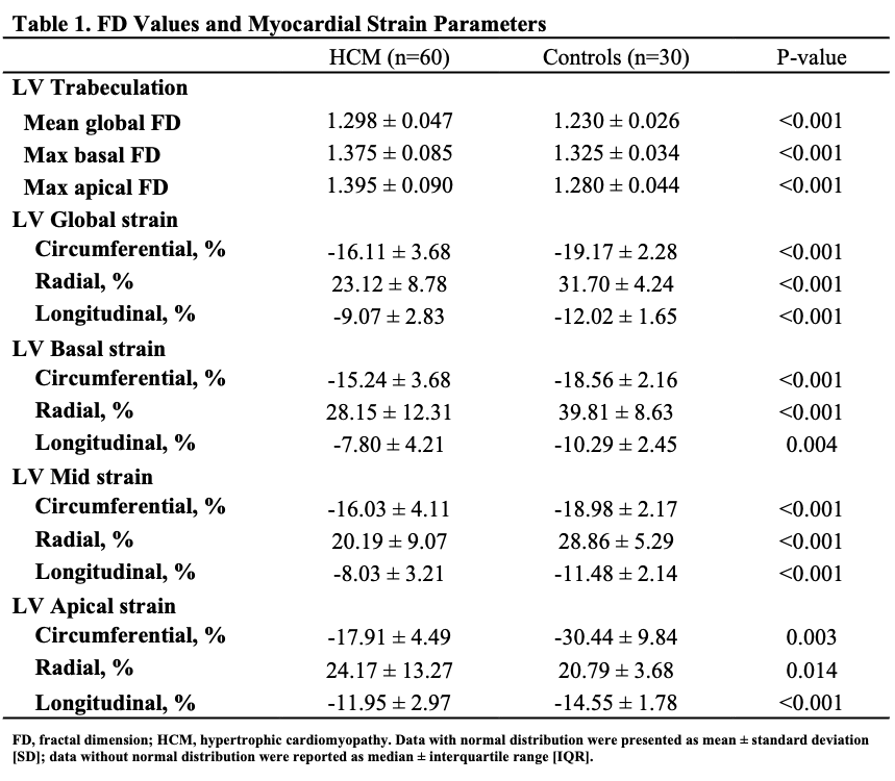
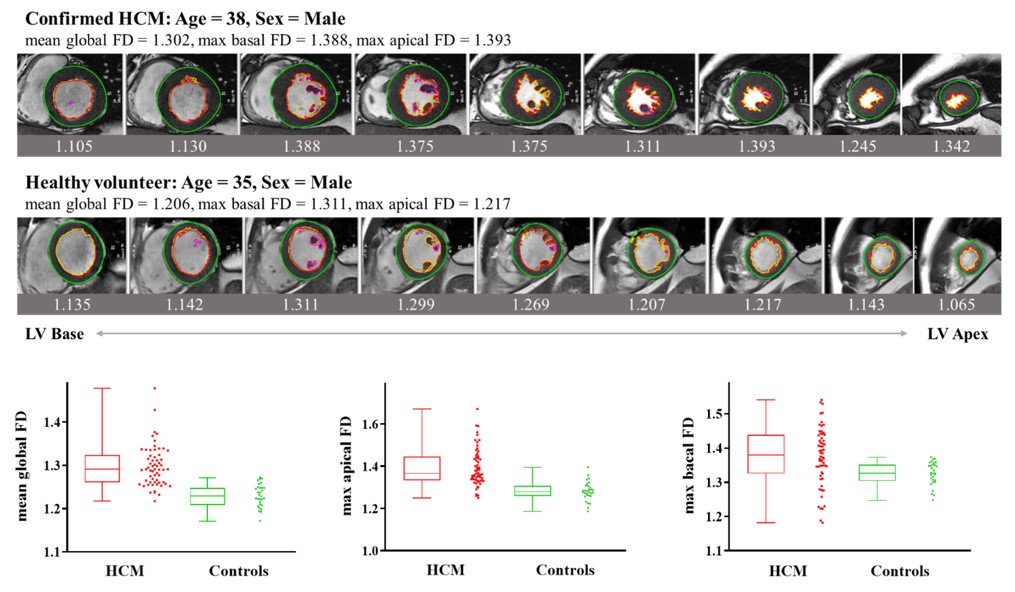
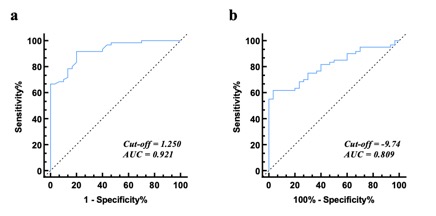
Mean global FD was higher in HCM patients than healthy controls (1.298 ± 0.047 vs 1.230 ± 0.026, p < 0.001). The global strain (GS) including circumferential (GCS), radial (GRS) and longitudinal (GLS) of LV were significantly higher in the patient group than in the control group (P < 0.001).The optimal threshold of the mean global FD to differentiate HCM patients from the healthy was 1.25 with a sensitivity of 91.7% and a specificity of 98% (AUC = 0.921; 95% CI: 0.868–0.975).Discussion
This study firstly applied fractal analysis on CMR images to examine the correlation of LV trabeculation and the strain changes in HCM patients with hypertrophic cardiomyopathy compared to the controls and determine patients with hypertrophic cardiomyopathy have hyper-trabecularization. The mean global, maximum basal, and maximum apical FD was were significantly higher in HCM patients than in healthy individuals, indicating that more pronounced and widespread trabeculation grew averagely in LV of the HCM patients. In contrast, at the same time, we found normal to higher or normal LVEF and significantly higher mean global FD was also found in the patients' group compared with to the healthy group. Therefore, the FDs could more sensitively reflect the myocardial dysfunction alteration in HCM more sensitively than LVEF. For strain analysis, all strain values were significantly different between HCM patients and controls, indicating that cardiac muscle systematically suffered more loading and increased the strength to pump out the blood in the left ventricle. With the assumption of the cardiac segment with hyper-trabecularizaton in reflection of a lower strain, we found the opposite difference between the patients and controls of radial strain in apical segment compared to global, basal and mid radial strains. This might hint us apical trabecularization caused apical radial strain different to other segments. Alteration of myocadiac muscle structure and function should be carefully addressed when using strain analysis. Therefore, to sum up, fractal analysis could accurately assist clinicians to evaluate increased LV trabeculationfunction via trabeculation degree in reflection of myocadiac strain and might be an important role method in the description of the early cardiomyopathy [7, 8]. In addition, the results of the ROC diagnostic curve indicated that the diagnostic value of fractal analysis in differentiation of hypertrophic cardiomyopathy and the controls was higher than tissue tracking such as strain parameters.Conclusion
Fractal analysis might have an early diagnostic value for myocardial hyper-trabeculae in patients with hypertrophic cardiomyopathy. And fractal analysis may be a novel method to better differentiate HCM patients and healthy subjects than tissue tracking.Acknowledgements
No acknowledgement found.References
1. Xu, H.Y., J. Chen, Z.G. Yang, et al. Early marker of regional left ventricular deformation in patients with hypertrophic cardiomyopathy evaluated by MRI tissue tracking: The effects of myocardial hypertrophy and fibrosis. Journal of Magnetic Resonance Imaging, 2017.2.
2. Captur, G., L.R. Lopes, V. Patel, et al. Abnormal cardiac formation in hypertrophic cardiomyopathy: fractal analysis of trabeculae and preclinical gene expression. Circ Cardiovasc Genet, 2014. 7(3): p. 241-8.3.
3.Marian, A.J. and E. Braunwald Hypertrophic Cardiomyopathy: Genetics, Pathogenesis, Clinical Manifestations, Diagnosis, and Therapy. Circ Res, 2017. 121(7): p. 749-770.4.
4.Captur, G., C.Y. Ho, S. Schlossarek, et al. The embryological basis of subclinical hypertrophic cardiomyopathy. Sci Rep, 2016. 6: p. 27714.5.
5.Vigneault, D.M., E. Yang, P.J. Jensen, et al. Left Ventricular Strain Is Abnormal in Preclinical and Overt Hypertrophic Cardiomyopathy: Cardiac MR Feature Tracking. Radiology, 2019. 290(3): p. 640-648.6.
6.Captur, G., A.L. Karperien, A.D. Hughes, et al. The fractal heart - embracing mathematics in the cardiology clinic. Nat Rev Cardiol, 2017. 14(1): p. 56-64.7.
7.Cai, J., J.A. Bryant, T.T. Le, et al. Fractal analysis of left ventricular trabeculations is associated with impaired myocardial deformation in healthy Chinese. J Cardiovasc Magn Reson, 2017. 19(1): p. 102.8.
8.Zheng, T., X. Ma, S. Li, et al. Value of Cardiac Magnetic Resonance Fractal Analysis Combined With Myocardial Strain in Discriminating Isolated Left Ventricular Noncompaction and Dilated Cardiomyopathy. J Magn Reson Imaging, 2019. 50(1): p. 153-163.
Figures