4560
Native T1 mapping texture analysis discriminates hypertensive heart disease vs non-apical hypertrophic cardiomyopathy1Department of Radiology, Union Hospital, Tongji Medical College, Huazhong University of Science and Technology, Wuhan, China, 2GE Healthcare, Shanghai, China, 3Siemens Healthineers Ltd., Shanghai, China
Synopsis
本研究探索了原生T1映射的纹理分析(TA),以便检测非apic肥大性心肌病(HCM)、心肌梗塞和高血压心脏病(HHD)的特定模式,具有良好的诊断效果,可反映心肌纤维化。结果表明,TA能够有效地区分和显示与心脏功能相媲美的诊断精度,并结合菌株分析。TA、心脏功能和应变分析的结合,使非 apical HCM 或 apical HCM 与 HHD 的区分具有最佳诊断精度。这表明,将 TA 与心脏功能和应变参数相结合,比单独使用 TA 具有增量值。
Introduction
Approximately 13-31% of patients with hypertrophic cardiomyopathy (HCM) manifest symmetrical hypertrophy. The non-apical subtype of HCM is more difficult to distinguish from hypertensive heart disease (HHD) in morphology[1-2]. Texture analysis (TA) based on native T1 mapping can identify differences in fibrosis spatial localization by measuring associated spatial distributions of pixel intensity levels without gadolinium-based contrast agents[3-5]. The goal of this study was to assess the potential of TA applied in T1 maps obtained using cardiac magnetic resonance (CMR) in the diagnosis of non-apical HCM , apical HCM and HHD compared with cardiac function combined with strain analysis.Methods
This retrospective study included 32 patients with non-apical HCM, 18 patients with apical HCM, and 44 patients with HHD who had undergone cardiovascular magnetic resonance (CMR) plain scan with native T1 mapping in three short-axis slices (basal, middle, apical) using a 1.5T scanner (MAGNETOM Aera, Siemens Healthcare, Erlangen, Germany). The contours of three short-axis slices were semi-automatically generated and manually corrected using a 3D slicer (version 4.11), and then the contour file was imported into a commercially available software (A.K, version version 3.1.0.R, Artificial Intelligence Kit, GE Healthcare, US) for TA. Six TA methods (replace outliers by quantiles, standardization, Mann Whitney U test, correlation analysis, gradient boosting decision tree, and logistic regression with five-fold cross validation) were performed for step-wise dimension reduction and feature selection. Cardiac function and strain parameters were analyzed based on a stack of short-axis slices and three long-axis slices. The global T1 value was calculated by measuring the septal myocardial sampling within the mid-ventricular short-axis slice.Results
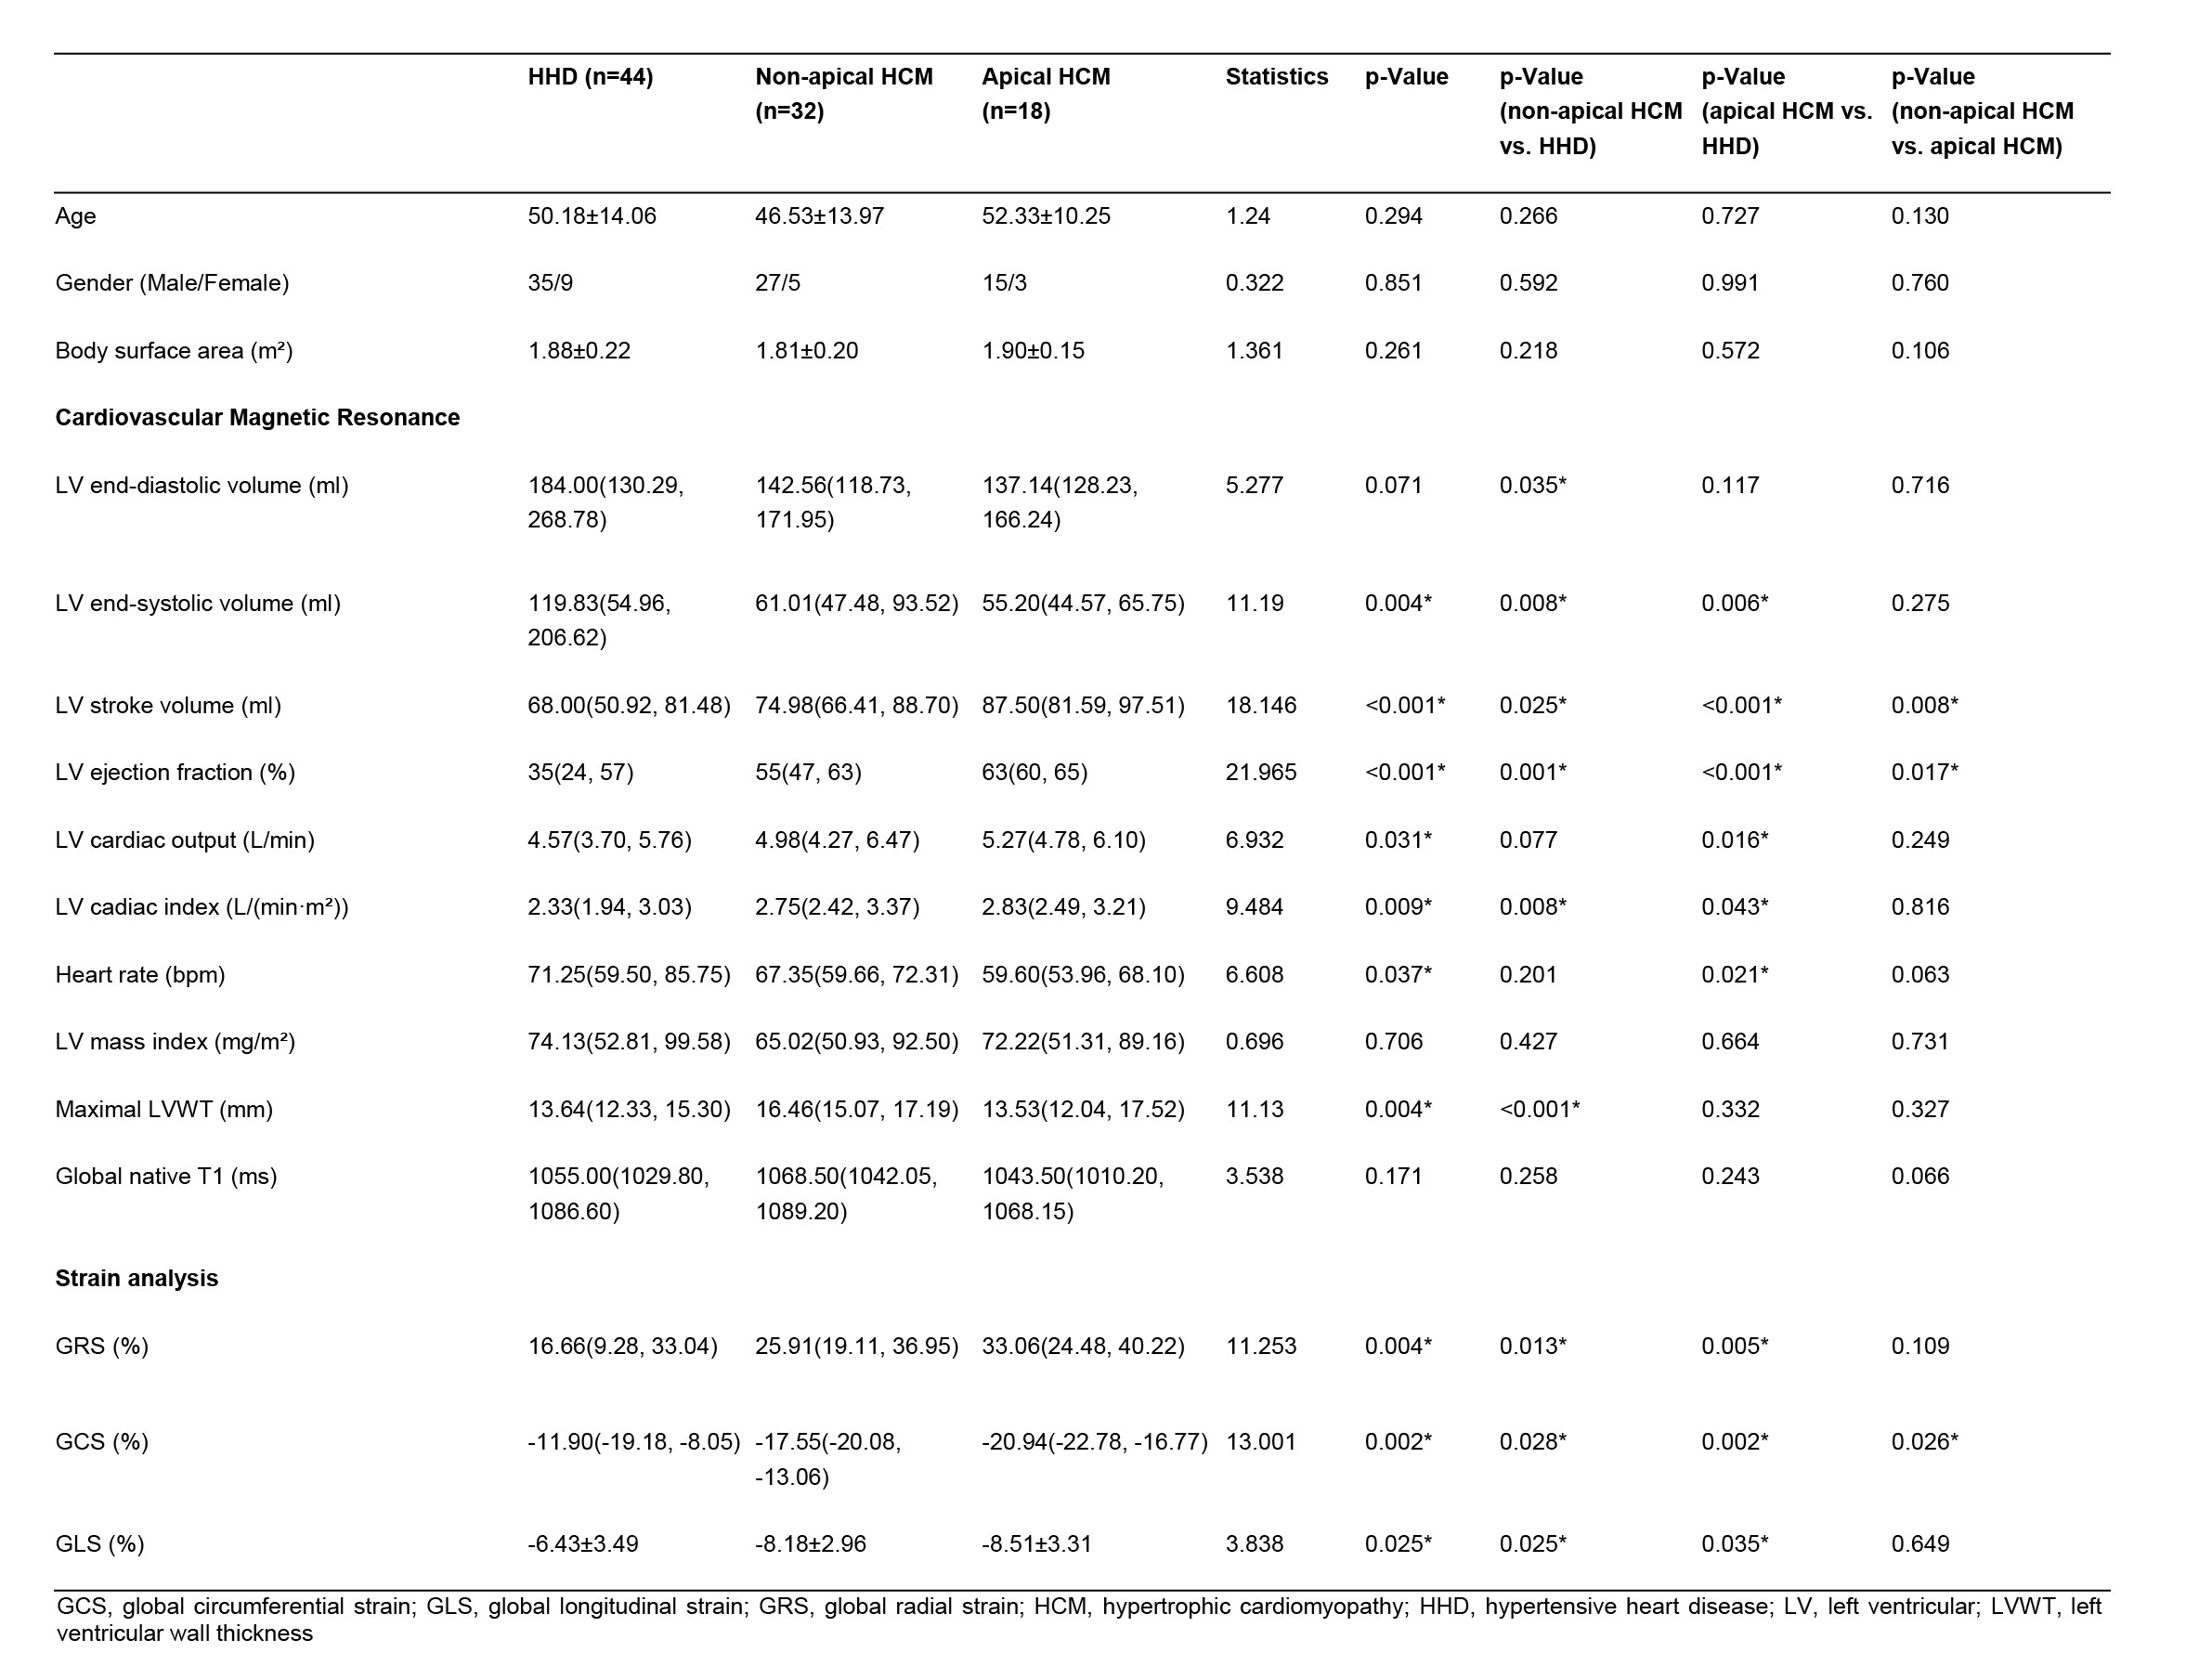
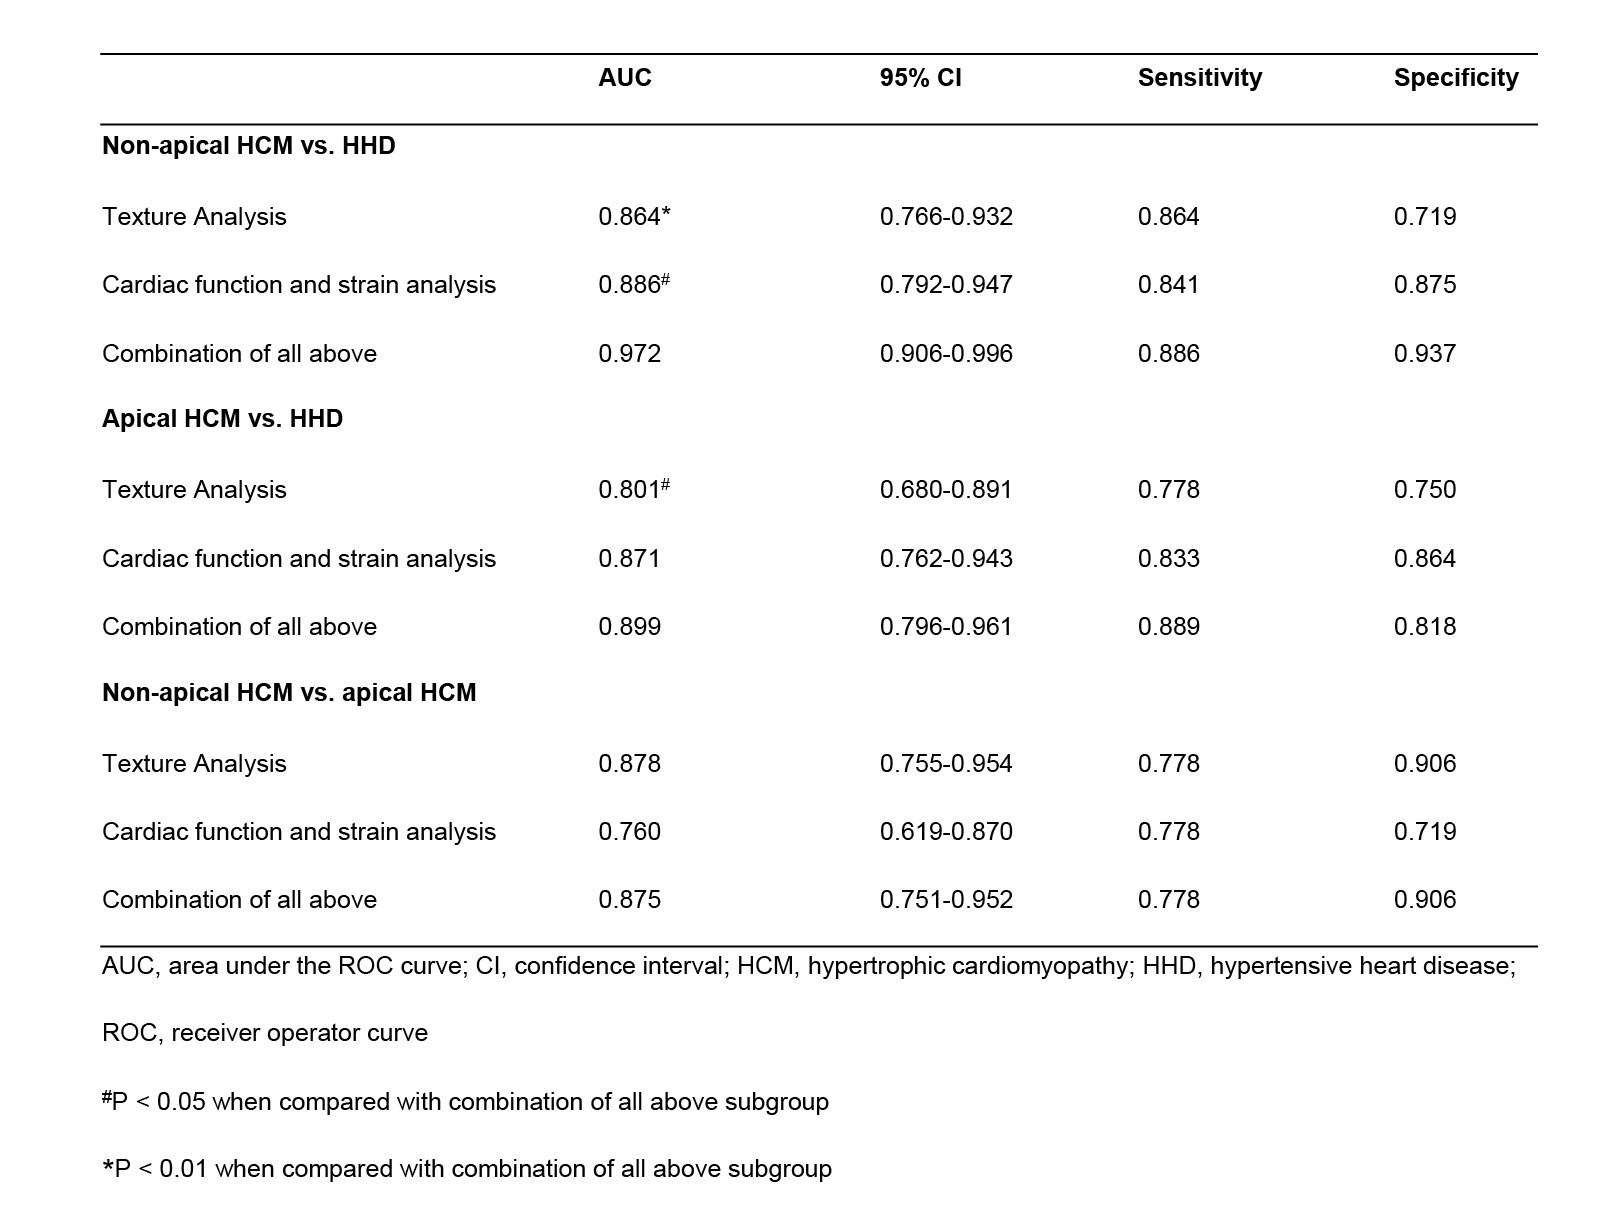
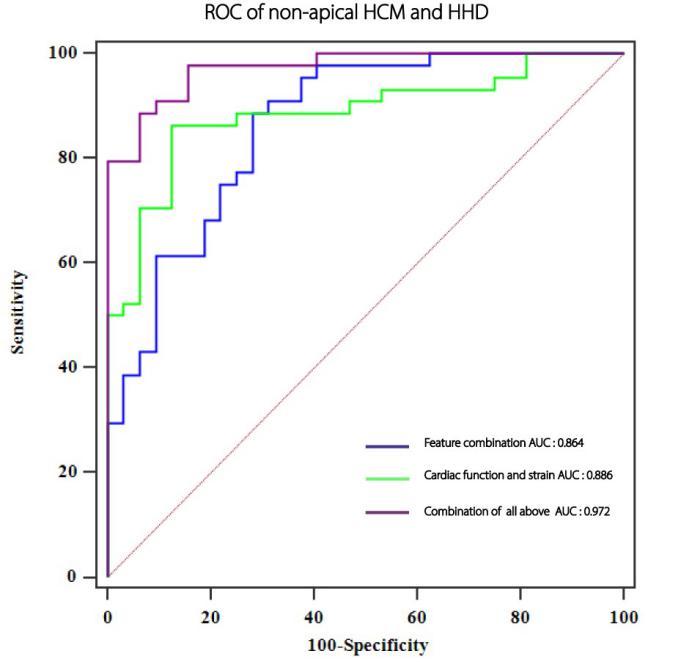
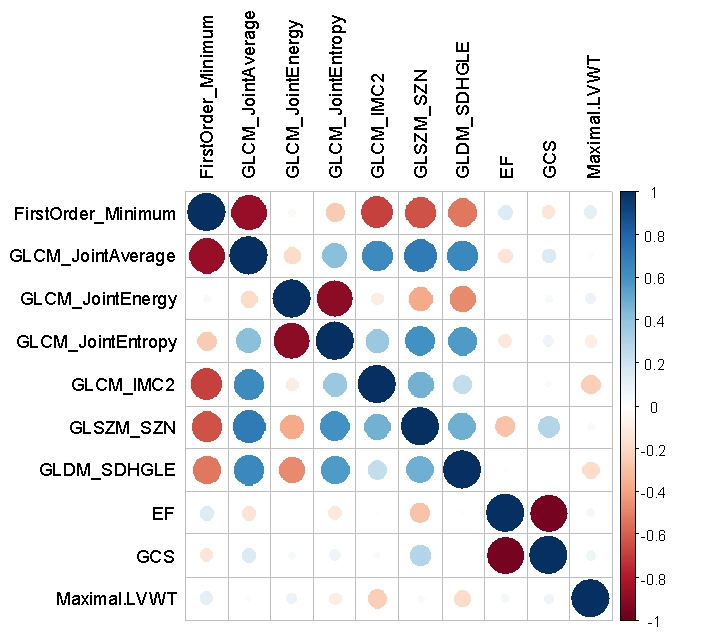
Subject characteristics of cardiac function and strain analysis are presented in Table 1. The selected texture features, consisting of four gray level co-occurrence matrix (GLCM) features (joint average, joint energy, joint entropy, imc2), first order feature (minimum), gray level size zone matrix (GLSZM) feature (size zone non-uniformity), and gray level dependence matrix (GLDM) feature (small dependence high gray level emphasis), provided a diagnostic accuracy of 80.3% [confidence interval (CI): 0.766-0.932] to differentiate non-apical HCM from HHD patients. The combination of these texture features with cardiac function and strain parameters [left ventricular ejection fraction (LVEF), left ventricular wall thickness, and global circumferential strain (GCS)] showed greater area under the curve (AUC) compared with using texture features alone (0.972 vs. 0.864, p<0.01). The detailed results are shown in Figure 1 and Table 2. There was week correlation between the texture features and cardiac function combined with strain parameters (Figure 2). For distinguishing between apical HCM and HHD patients, the AUCs were as follows: 0.801 for TA and 0.899 for TA adding in cardiac function and strain analysis (p<0.05). Two of these TA features, GLCM feature (joint entropy) and GLDM feature (small dependence high gray level emphasis) also work for differentiating apical HCM and HHD.Discussion
This study focused on conducting a differential diagnosis between non-apical HCM and HHD to achieve more clinical practicability. The results suggest that heart function combined with stress analysis and TA both can be used to differentiate among non-apical HCM, apical HCM and HHD. The combination TA model of native T1 mapping was equivalent to heart function combined with stress analysis in distinguishing HHD from non-apical or apical HCM patients, and it performed better in distinguishing non-apical HCM from HHD. The combination of the TA, heart function and stress analysis can get a highest diagnostic accuracy. However, the correlation analysis revealed weak correlation among texture features, cardiac function and strain parameters in all groups, which may suggest that the tissue changes demonstrated by texture features may not be the explanation for strain alterations in non-apical HCM, apical HCM and HHD.Conclusion
TA of native T1 mapping shows high accuracy in differentiating non-apical HCM from HHD. Combining TA with cardiac function and strain parameters could provide significant value over TA alone.Acknowledgements
This work is supported by National Natural Science Foundation of China (Grant No. 82071921) and the Fundamental Research Funds for the Central Universities (Grant No. 2021yjsCXCY107).References
[1]. Shapiro LM, McKenna WJ. Distribution of left ventricular hypertrophy in hypertrophic cardiomyopathy: a two-dimensional echocardiographic study. J Am Coll Cardiol 1983;2:437e44.
[2]. Nakamura T, Sugihara H, Kinoshita N, et al. Can serum carnitine levels distinguish hypertrophic cardiomyopathy from hypertensive hearts? Hypertension 2000;36:215e9.
[3]. Gillies RJ, Kinahan PE, Hricak H Radiomics: Images are more than pictures, They are data. Radiology 2016;278(2):563-77.
[4]. Baessler B, Mannil M, Oebel S, Maintz D, Alkadhi H, Manka R Subacute and chronic left ventricular myocardial scar: Accuracy of texture analysis on nonenhanced cine MR images. Radiology 2018;286(1):103-12.
[5]. Baeßler B, Mannil M, Maintz D, Alkadhi H, Manka R Texture analysis and machine learning of non-contrast T1-weighted MR images in patients with hypertrophic cardiomyopathy—Preliminary results. Eur J Radiol 2018;102(November 2017):61-7.
Figures