4542
Aortic hemodynamics with accelerated dual-venc 4D fow MRI in patients with type B aortic dissection1Department of Radiology, Feinberg School of Medicine, Northwestern University, Chicago, IL, United States, 2Department of Biomedical Engineering, Northwestern University, Chicago, IL, United States, 3Cardiovascular MR R&D, Siemens Medical Solutions USA, Inc., Cleveland, OH, United States, 4Cardiovascular MR R&D, Siemens Medical Solutions USA, Inc., Chicago, IL, United States, 5Division of Cardiac Surgery, Feinberg School of Medicine, Northwestern University, Chicago, IL, United States, 6Division of Vascular Surgery, Feinberg School of Medicine, Northwestern University, Chicago, IL, United States
Synopsis
4D flow MRI is a well-validated imaging technique for quantitative assessment of blood flow hemodynamics and has shown promise in evaluation of type B aortic dissection (TBAD). However, single velocity encoding (venc) 4D flow MRI is limited by its inability to fully capture wide range of velocities related to variable pathologic hemodynamic patterns such as true lumen and false lumen flow range of velocities in TBAD. We hypothesize that dual-venc acquisition improves velocity-to-noise ratio, better captures full dynamic range of velocities in TBAD and provides improved characterization of flow hemodynamics relative to single-venc acquisitions.
INTRODUCTION
Noninvasive imaging based rapid evaluation is a key tool for diagnosis, risk stratification and treatment plan of type B aortic dissection (TBAD) patients. 4D flow MRI has demonstrated potential value in quantitative characterization of flow hemodynamics in TBAD. However, the current standard 4D flow MRI technique assesses the blood flow velocity based on a single velocity encoding (venc) which has poorer noise performance when there is a high dynamic range of velocities such as in the true lumen (TL) and false lumen (FL) in TBAD. Dual-venc (DV) 4D flow MRI allows the acquisition of both low-venc (LV) and high-venc (HV) data within a single scan and the resulting HV data can be used to correct the aliasing in the LV data while preserving the favorable velocity-to-noise ratio (VNR) of the LV data. In this ongoing study we assess applicability and reproducibility of the DV 4D flow MRI for comprehensive quantitative flow pattern assessment in healthy volunteers and TBAD patients.METHODS
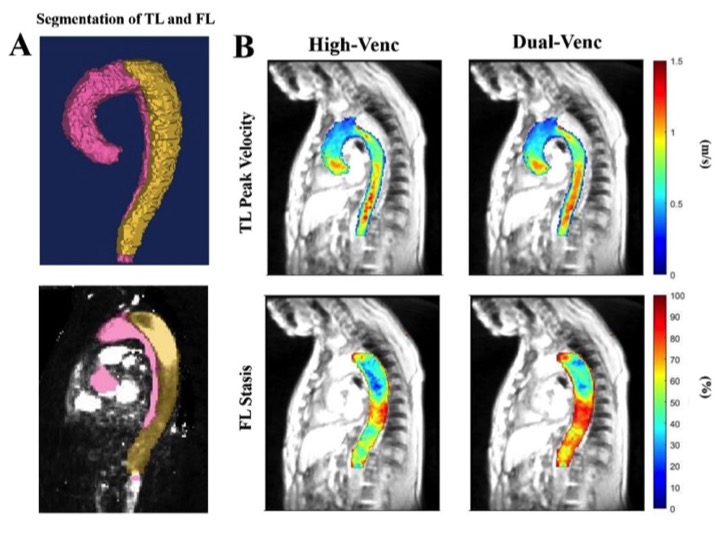
A total of 7 TBAD patients (57.5 ± 8 years-old; 2 female) including 3 medically managed chronic (>90 days since presentation) TBAD cases and 4 stable residual TBAD cases following type A aortic dissection repair were prospectively recruited. Two volunteers (28-year-old male, 21-year-old female) were also included. Subjects were scanned with 2 non-contrast, free-breathing 4D flow MRI scans including conventional single-venc GRAPPA-accelerated (R=2) and compressed-sensing accelerated (R=7.7) DV prototype 4D flow MRI on a 1.5T MRI system (MAGNETOM Sola, Siemens Healthcare, Erlangen, Germany) using retrospective ECG-gating, the same spatial (~2.5 mm3) and temporal (40 ms) resolution. Single venc (160 cm/s) was used for GRAPPA, 80 cm/s low venc and 160 cm/s high venc were used for DV acquisitions. The DV data was reconstructed by combining LV and HV data using a model-based Bayesian unfolding algorithm. Second scan was performed for all subjects 5-10 days after the first scan for interscan reliability assessment. Preprocessing of 4D flow data and manual segmentation of the TL and FL were followed by voxelwise calculation of the flow parameters including total kinetic energy (KE), mean 5th percentile peak velocity (PV) over the entire volume through cardiac cycle in TL and FL (patients) and in entire aorta (volunteers) as well as mean flow stasis in FL in patients (Fig. 1). Groupwise comparisons were performed using paired t-test or Wilcoxon signed-rank test as appropriate. Pearson correlation coefficients and Bland-Altman analysis were also used for the assessment of variability between acquisition types and reproducibility of each acquisition type between scan 1 and 2. VNR was calculated as mean velocity in entire aorta divided by velocity noise estimated by standard deviation of measured velocities in the static spine. The obtained VNR values were compared between HV and DV acquisitions.RESULTS
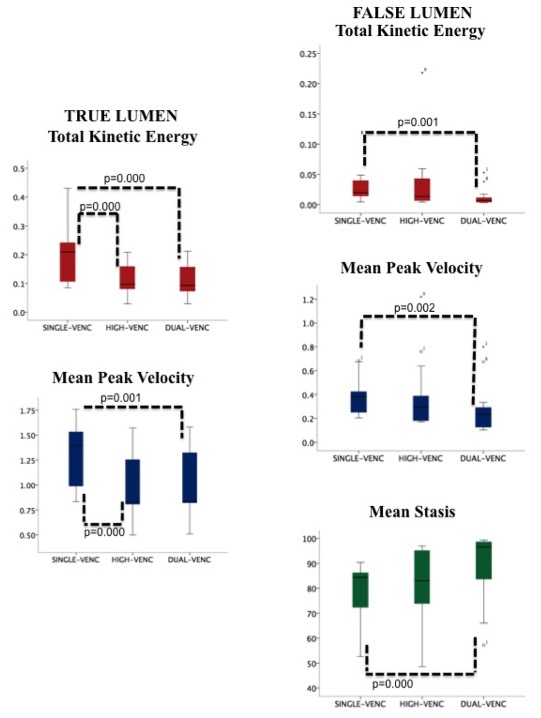
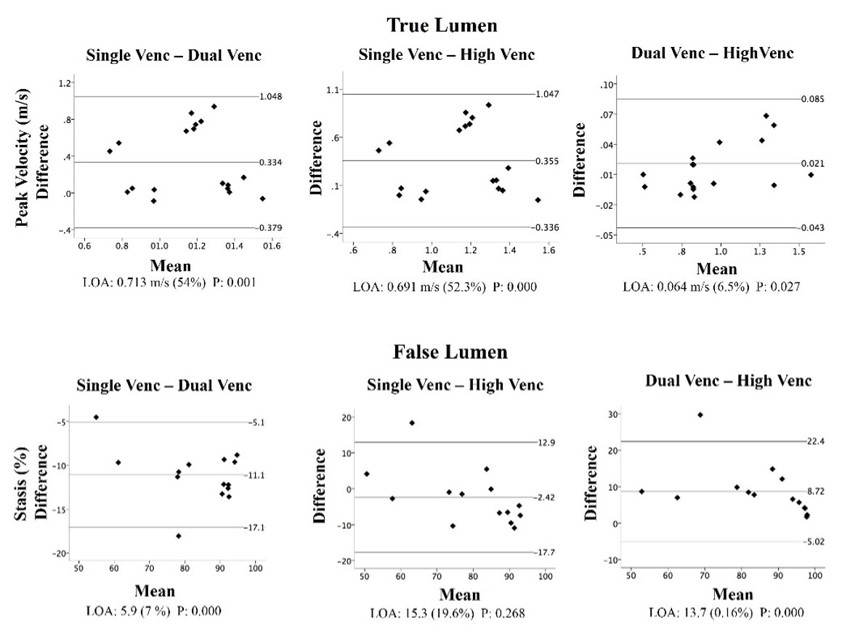
The KE and PV were higher in single-venc GRAPPA acquisition compared to HV and DV in the TL (p<0.01). In FL, KE and PV showed statistically significant higher values in GRAPPA compared to DV (p<0.01) whereas stasis values were significantly lower in GRAPPA in the same pairwise comparison (p<0.01). None of the parameters showed statistically significant differences in the FL between GRAPPA and HV. In the FL, total KE and PV were significantly lower in DV compared to HV and stasis was significantly higher in DV compared to HV (p<0.01). Groupwise sequence comparisons for flow parameters are represented in figure 2 boxplots. All parameters in TL were significantly positively correlated between DV and HV (r=0.995 and r=0.996 for KE and PV respectively, p<0.01 for both) and all parameters in FL were significantly positively correlated between GRAPPA and DV (r=0.761 for KE, 0,975 for stasis, 0.922 for PV, all p<0.01). GRAPPA to HV comparisons showed positive correlation in FL for stasis (r=0.892, p<0.01) and PV (r=0.555, p<0.05). DV to HV correlations in FL showed significance for PV (r=0.573, p<0.05) and stasis (r=0.909, p<0.01). Bland Altman plots showed low limits of agreements and percentage levels only for FL stasis values in all groupwise comparisons (Fig. 3). Reliability assessments in TL showed nonsignificant differences between first and second scans for all sequences. Correlations in TL comparisons were all significantly positive between first and second scans for all sequence types (p<0.01). FL comparisons showed no significant differences for any parameter between scans of any sequence type; correlations were significantly strong for all parameters for GRAPPA and DV (p<0.01) and for stasis only for HV (p<0.05). There was an average 18% increase to VNR in the whole lumen for the DV compared to HV (p<0.01).DISCUSSION
In this study we investigate the feasibility of compressed sensing accelerated DV 4D flow MRI in patients with TBAD. Our results suggest that DV and HV acquisitions significantly impact the KE and velocity values of the TL and FL in TBAD. While the reliability assessments show that DV and HV 4D flow MR image acquisitions provide reproducible results, the accuracy of the results should be investigated with ongoing patient recruitment and larger sample size.CONCLUSION
Our results suggest that DV and HV 4D flow MR image acquisitions provide reproducible results based on the interscan reliability assessment, while also significantly impacting the hemodynamic flow parameter values of the TL and FL in TBAD.Acknowledgements
No acknowledgement found.References
1. Jarvis. K., et al., Parametric hemodynamic 4D Flow MRI maps for the characterization of chronic thoracic descending aortic dissection. J Mag Reson Imaging, 2020. 51(5): p.1357-1368.
2. Binter. C., et al., Bayesian multipoint velocity encoding for concurrent flow and turbulence mapping. Magn Reason Med. 2013. 69(5): p.1337-1345.
3. Schnell. S., et al., Accelerated Dual-Venc 4D flow MRI for neurovascular applications. J Magn Reson Imaging, 2017. 46(1): p.102–114.
4. Schnell, S., et al., Improved assessment of aortic hemodynamics by kt accelerated dual-venc 4D flow MRI in pediatric patients. Journal of Cardiovascular Magnetic Resonance, 2016. 18(1): p.1.
Figures