4539
White matter hyperintensities and brain volume changes in Cushing disease and related risk factors1Department of Radiology, Huashan Hospital, Shanghai Medical College, Fudan University, Shanghai, China, 2MR Collaborations, Siemens Healthineers Ltd., Shanghai, China, 3Department of Neurosurgery, National Center for Neurological Disorders (NCND), Shanghai Pituitary Tumor Center, Huashan Hospital, Shanghai Medical College, Fudan University, Shanghai, China
Synopsis
Cushing's disease(CD) has significantly more white matter hyperintensities and enlarged perivascular spaces, compare to same-aged healthy subjects. Age, diabetes, hypokalemia was significantly related with white matter hyperintensities in CD. The gray matter volume of CD patients was significantly smaller than the healthy subjects. Compared with patients with type 2 diabetes alone, the mean age of CD with diabetes were younger with shorter course of disease, but with more severe white matter damage. the severity of white matter hyperintensities were ranked as belowed: CD with type 2 diabetes, CD without type 2 diabetes, type 2 diabetes.
Purpose
White matter hyperintensities (WMH) and damaged integrity of white matter are often observed on MRI of patients with Cushing's disease (CD), but the pathogenesis or related risk factors is not fully understood. Also, it is unknown what is the difference between cerebral small vessel disease (CSVD) caused by Cushing’s disease and other diseases that are highly related to cardiovascular and cerebrovascular complications (such as diabetes). In this study, we aimed to explore the WMH in CD and related clinical factors, as well as brain volume changes, in order to explore the signficant risk factors and predictive imaging clinical features leading to high cortisol-induced brain microstructure changes.Materials and Methods
All subjects were prospectively collected. The subjects were divided into one experimental group of patients with CD (62 cases, clinically confirmed), and two control groups of healthy subjects(40 cases, age matched with experimental group) and patients with type II diabetes(45 cases). MRI protocol for experimental group included T1-MPRAGE、T2-flair(2mm)、T2WI、SWI, and for two control group T1WI、T2WI、T2-flair、DWI . Clinical indexes were collected: age, gender, body mass index (BMI), course of disease, complications, Cushing's disease-related hormone levels and CSVD baseline risk factors. Deep and periventricular WMH were coded from 0 to 3 according to the Fazekas scale(1). Enlarged perivascular spaces (EPVS)(2) and the cSVD burden(3) was assessed as previously described. Lacunes and cerebral microbleeds were recorded for each patient.Results
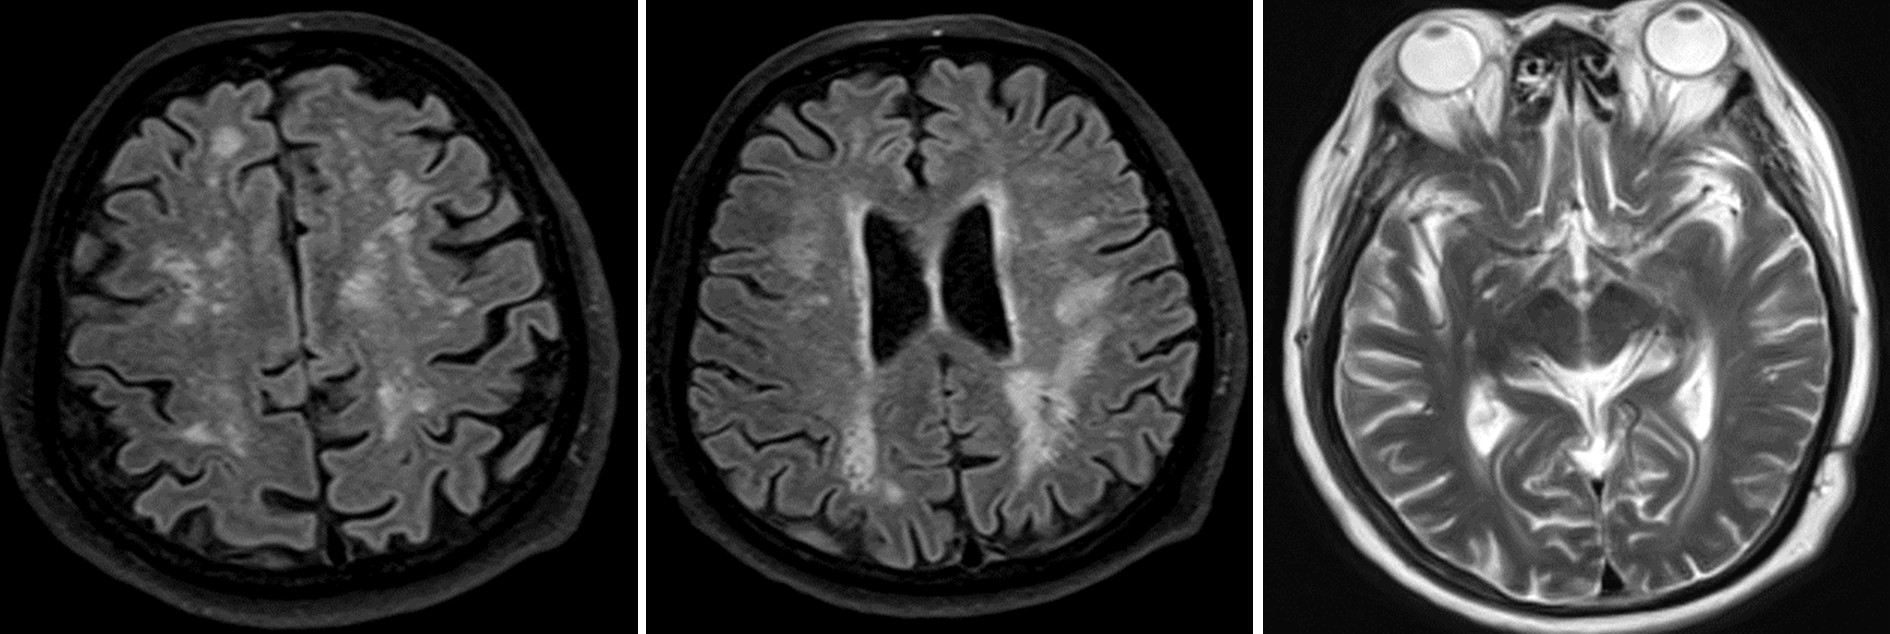
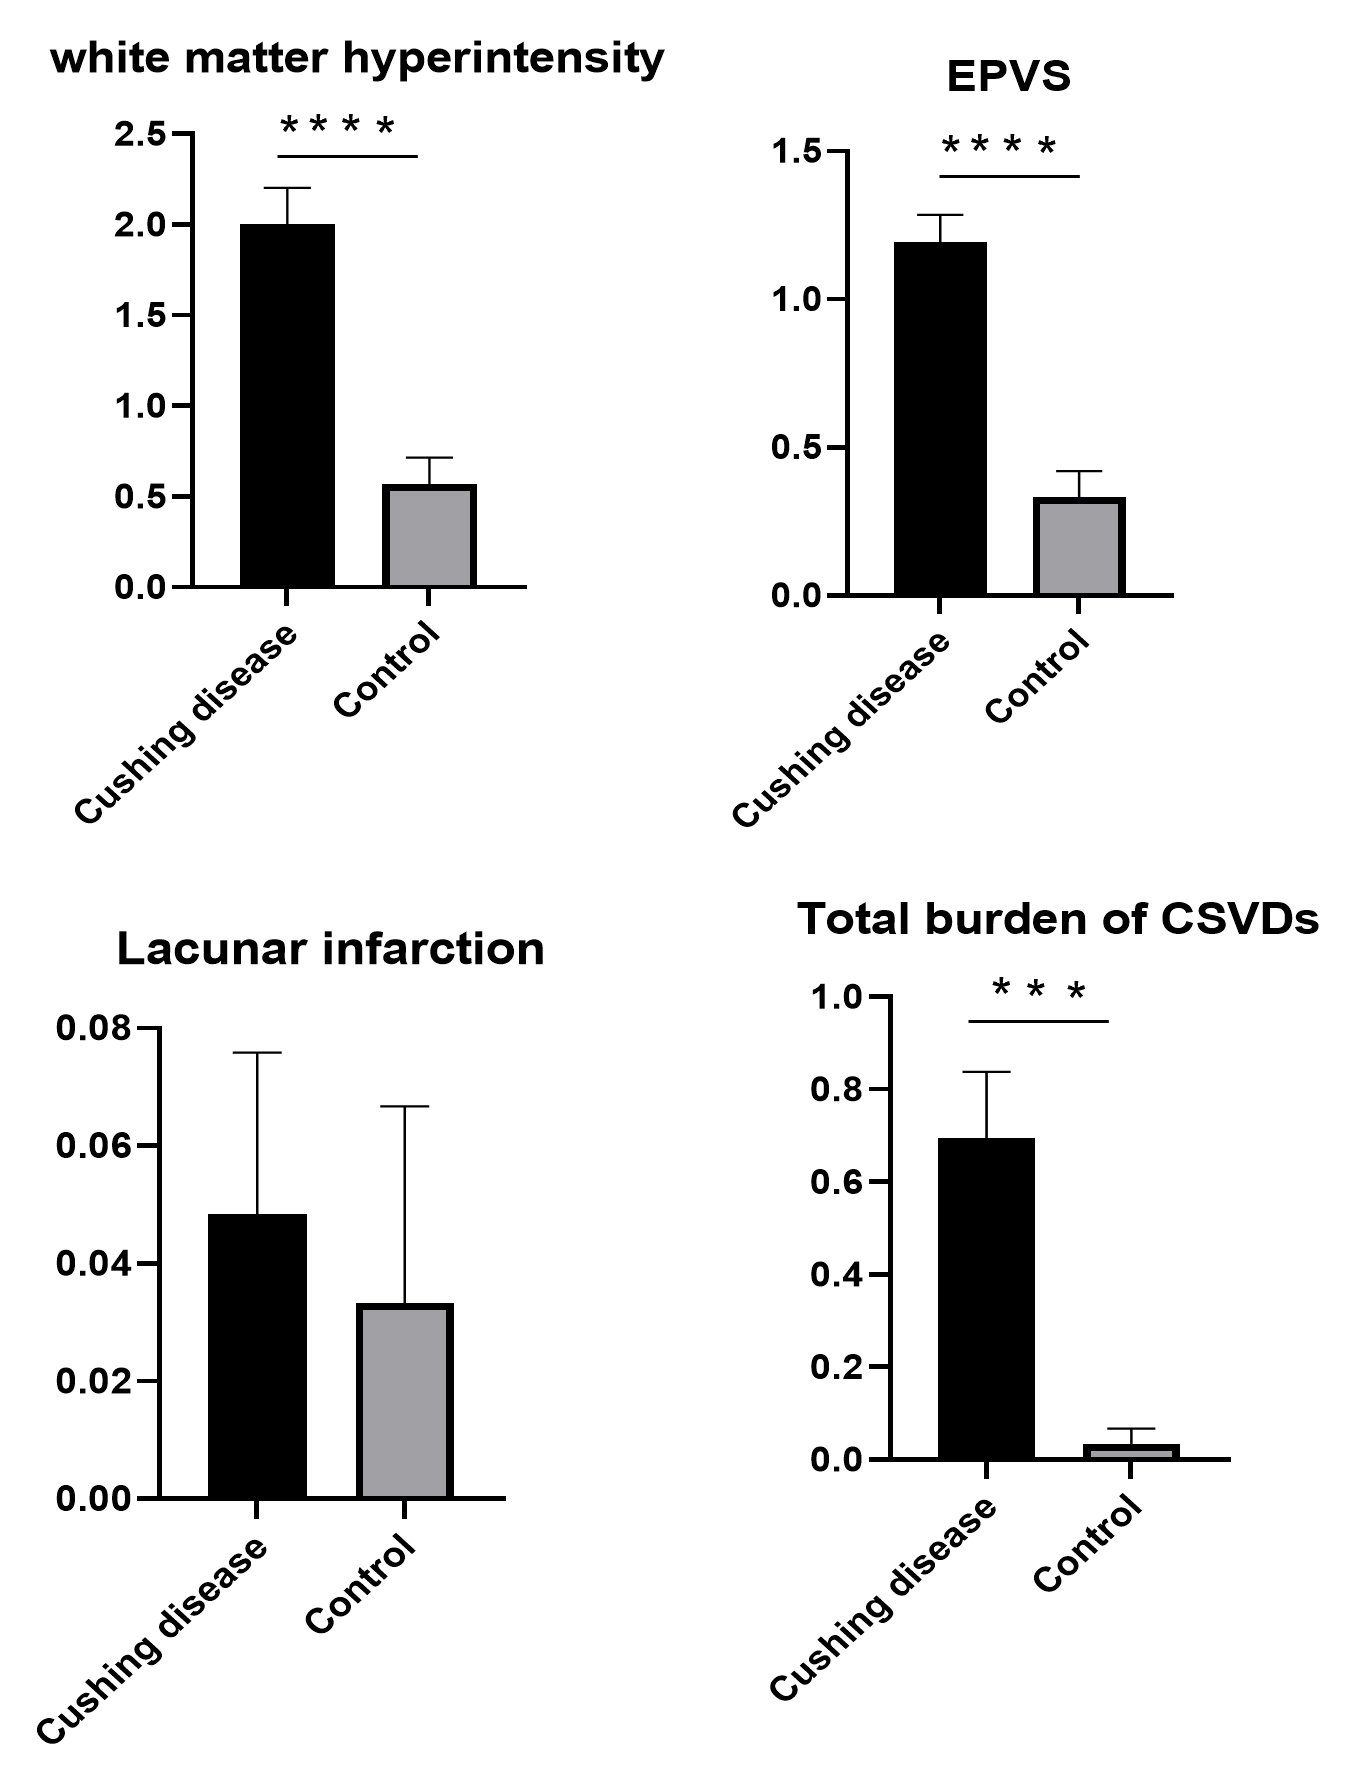
A typical example of MRI images of the WMH in CD is provided in Figure 1. Deep white matter hyperintensities lesions were found in centrum semiovale and adjacent to the lateral ventricles bilaterally on T2-weighted images. Compared with the control group of healthy patients, CD has significantly more WMH and EPVS(Figure 2). There was no significant difference in the amount of Lacunes and cerebral microbleeds.The univariate regression analysis was initially performed to identify risk factors with P < 0.2. Univariate analysis results revealed that age (P<0.0001), present of diabetes (P<0.05), hypokalemia (P<0.01) and fasting blood glucose(P<0.0001) were associated with Fazekas score. Next, risk factors with significance levels of P < 0.2 in the ordinal regression analysis were included in a logistic regression analysis. The ordinal logistic regression analysis revealed that age 30-50 (unadjusted OR [uOR]: 0.96, P<0.05), age ≥50 (uOR:14.693, P<0.0001), diabetes (uOR:3.871, P<0.01), hypokalemia(uOR:4.400, P<0.01) were significantly related with Fazekas score in CD. Furthermore, Spearman rank correlation analysis was used to determine the correlation between Fazekas score and three risk factors(age, diabetes, hypokalemia) described above. The results suggested Fazekas score to be positively associated with age (r = 0.65, P <0.0001), diabetes (r =0.52, P <0.0001) and hypokalemia (r = 0.3934, P = 0.0016).
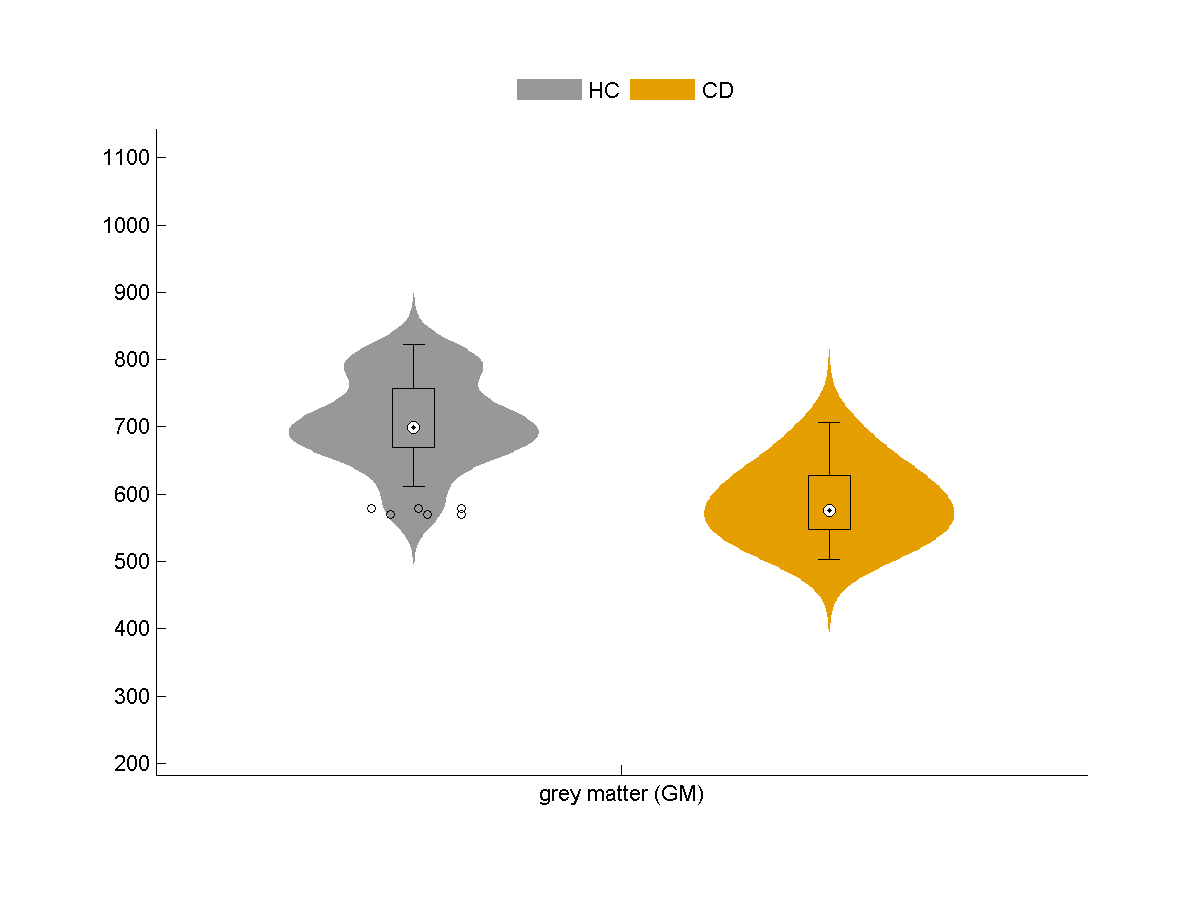
Furthermore, the gray matter volume between CD group and healthy control group were compared(Figure 3). The gray matter volume of CD patients were significantly smaller than the healthy subjects (P<0.05).
Compared with patients with type 2 diabetes alone, the mean age of CD with diabetes were younger with shorter course of disease, but with more severe white matter damage. After correction for age, the severity of white matter hyperintensity were ranked as belowed: CD with type 2diabetes, Cushing's disease without type 2 diabetes, type 2 diabetes.
Discussion
Although blood glucose levels are correlated with changes in the white matter of CD patients, underlying factors that can lead to more severe white matter damage and CSVD remained unknown and needed to explore further.Conclusions
High cortisol state combined with hyperglycemia and hypokalemia are more likely to cause white matter damage in patients with CD. The the mechanism(s) of the synergy among cortisol blood sugar, potassium is of great significance for investigating the brain microstructure changes chronically exposed to high cortisol.Acknowledgements
The research was supported by National Natural Science Foundation of China (81702467).References
1. Fazekas F, Chawluk JB, Alavi A: MR signal abnormalities at 1.5 T in Alzheimer’s dementia and normal aging. Am J Neuroradiol 1987; 8:421–426.
2. Doubal FN, MacLullich AMJ, Ferguson KJ, Dennis MS, Wardlaw JM: Enlarged Perivascular Spaces on MRI Are a Feature of Cerebral Small Vessel Disease. Stroke 2010; 41:450–454.
3. Staals J, Makin SDJ, Doubal FN, Dennis MS, Wardlaw JM: Stroke subtype, vascular risk factors, and total MRI brain small-vessel disease burden. Neurology 2014; 83:1228–1234.
Figures