4538
Visible "Butterfly" of the Cervical Spinal Cord: A Pilot Study Using 3D and 2D m-FFE with Inhomogeneous Magnetization Transfer Pulse1Department of Radiology, Chiba University Hospital, Chiba, Japan, 2Department of Diagnostic Radiology and Radiation Oncology, Graduate School of Medicine, Chiba University, Chiba, Japan, 3Philips Japan, Tokyo, Japan, 4Philips Canada, Mississauga, ON, Canada
Synopsis
The purpose of this study is to find the parameters that provide the optimal trade-off in Signal-to-noise-ratio (SNR) and contrast-to-noise ratio (CNR) for 3D ihMT m-FFE (3D-ihMT) and to explore the feasibility of that for the segmentability of gray and white matters in the cervical spinal cord compared with 2D ihMT m-FFE (2D-ihMT). We recommend a Flip angle of 7 and TFE factor of 5 as an optimal trade-off between segmentability and artifact level, at least 16 nr repetitions are required for robust segmentation. The segmentability of 3D-ihMT could be increased to a level close to that of 2D-ihMT.
Introduction
The development of myelin-specific MR imaging techniques remains an active and highly focused area of research in which novel approaches are being sought. One promising example is the recently described inhomogeneous magnetization transfer (ihMT) technique1). Discrimination of gray (GM) and white matters (WM) on spinal cord MRI remains a challenge, due to the small structure size and motion artifacts from such as swallowing and blood flow. It has been reported that 3D multi-echo fast field echo (3D m-FFE) is useful for delineating spinal cord structures because it provides good contrast2). In addition, it is known that the application of ihMT to 2D m-FFE can improve the delineation of spinal cord structures too3). However, there have been no reports on the ability of 3D m-FFE combined with ihMT pulses to delineate spinal cord structures and there is no consensus on the sequence parameters to be used in the 3D ihMT m-FFE (3D-ihMT).The purpose of this study was to find the number of repetitions (Rep), flip angle (FA), and TFE factor (TFE-f) providing an optimal trade-off between Signal-to-noise-ratio (SNR) and contrast-to-noise ratio (CNR), and imaging time on 3D-ihMT. We explored the feasibility of 3D-ihMT for the discrimination ability of GM and WM in the cervical spinal cord compared with 2D ihMT m-FFE (2D-ihMT).Materials and Methods
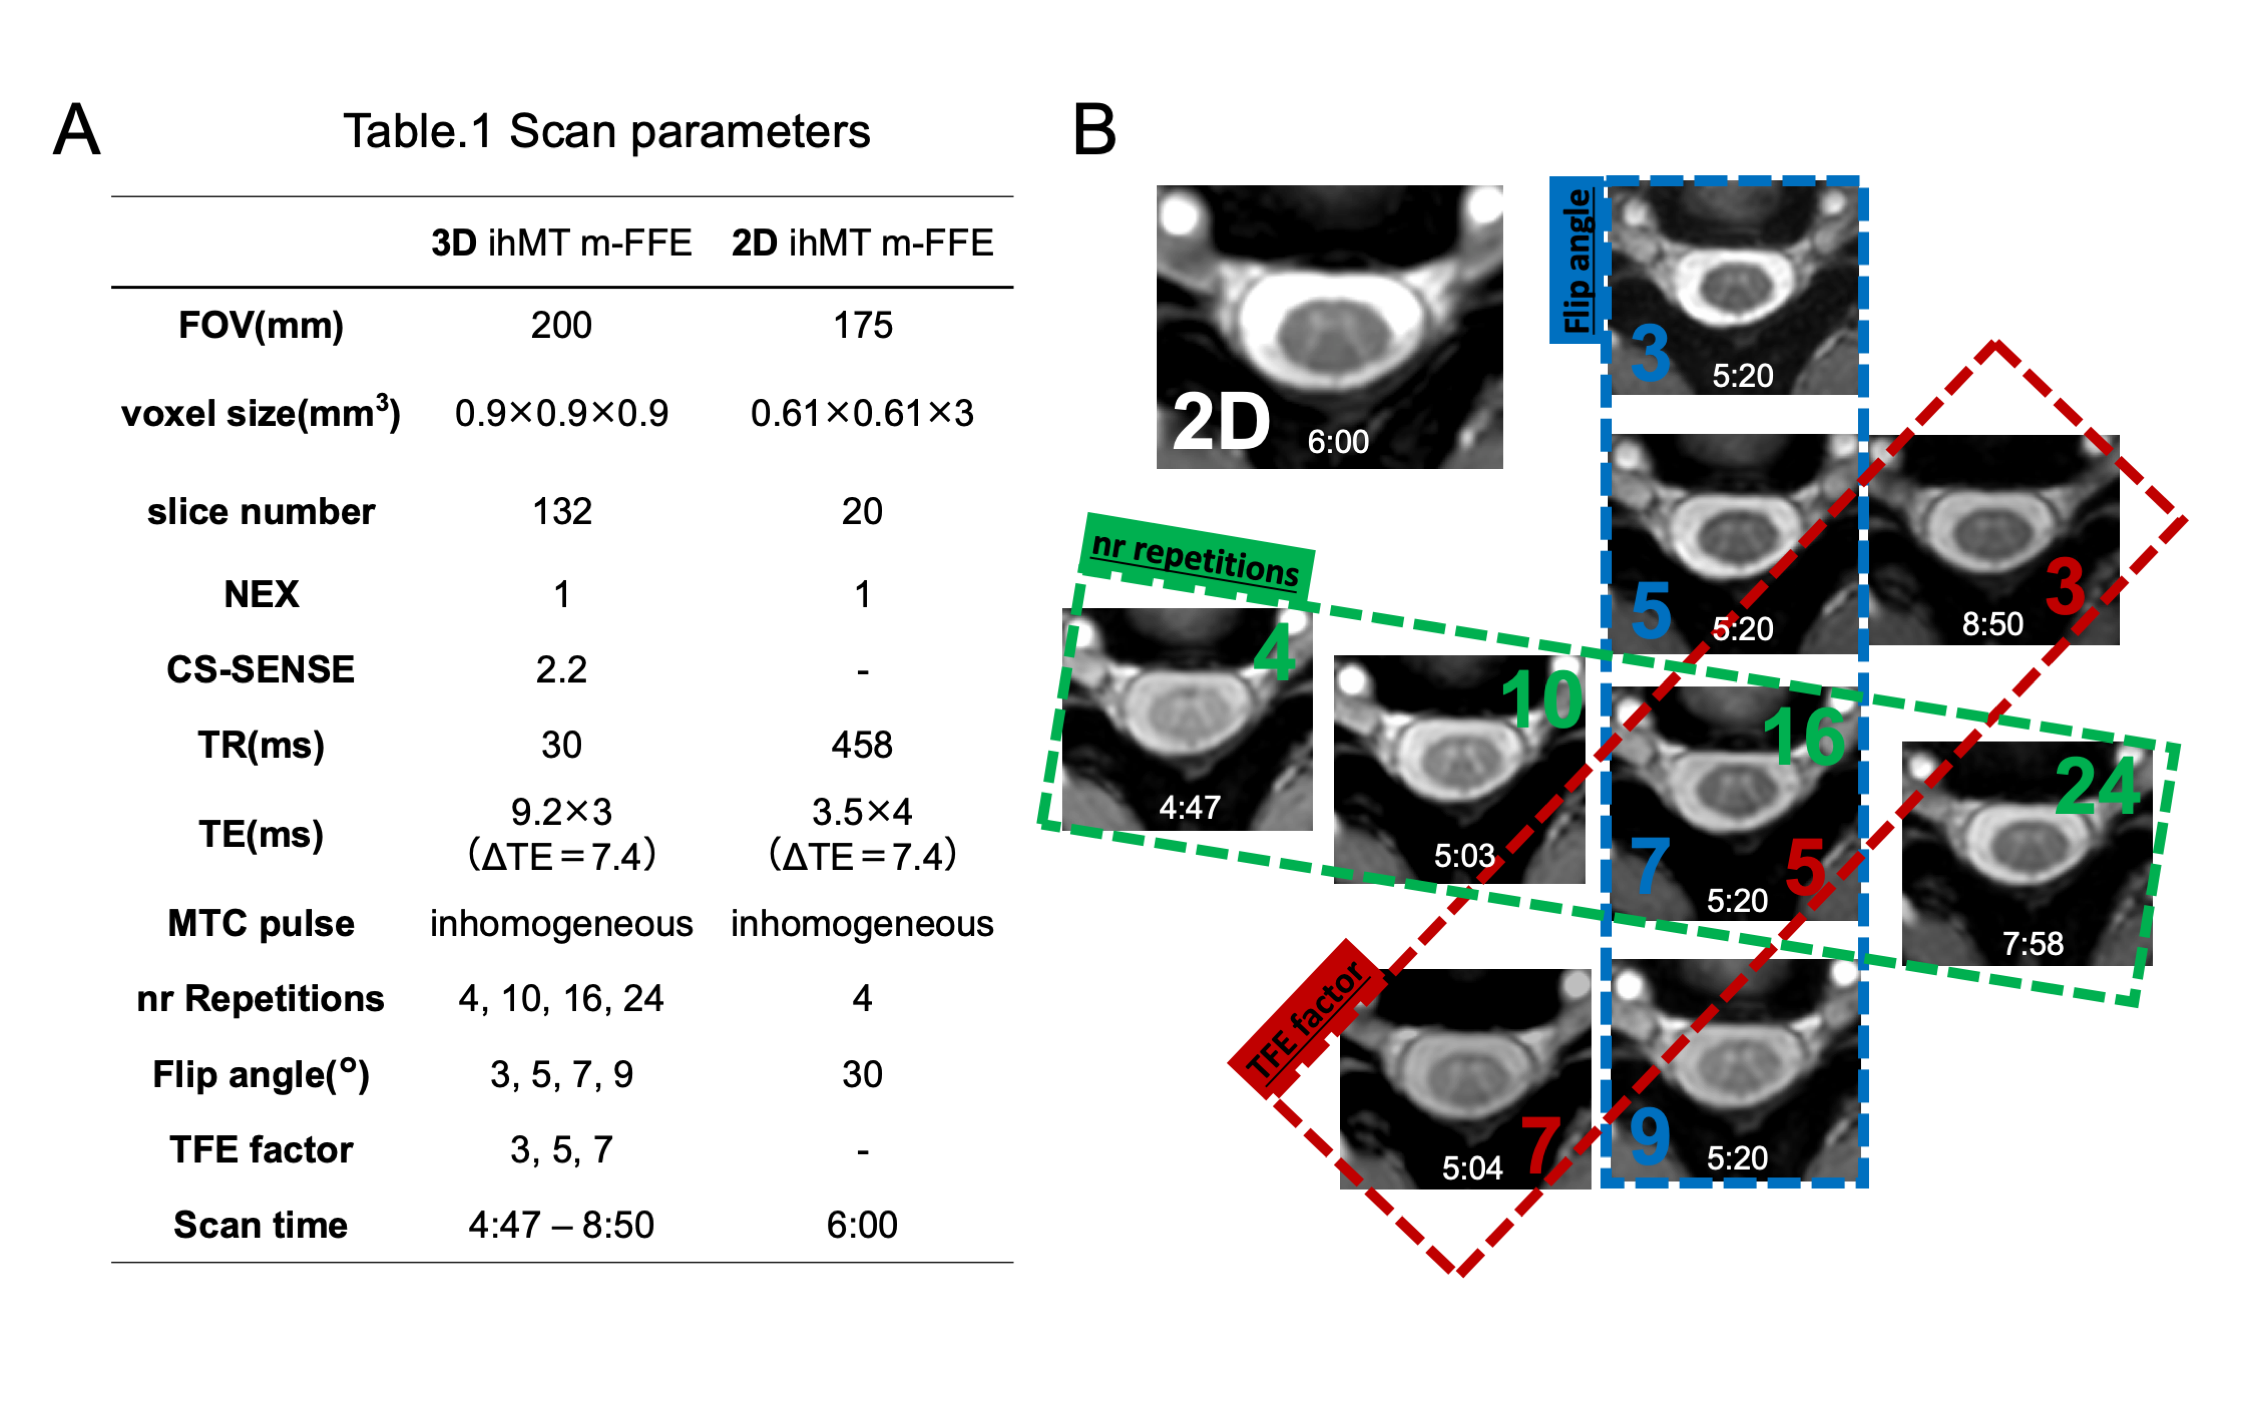
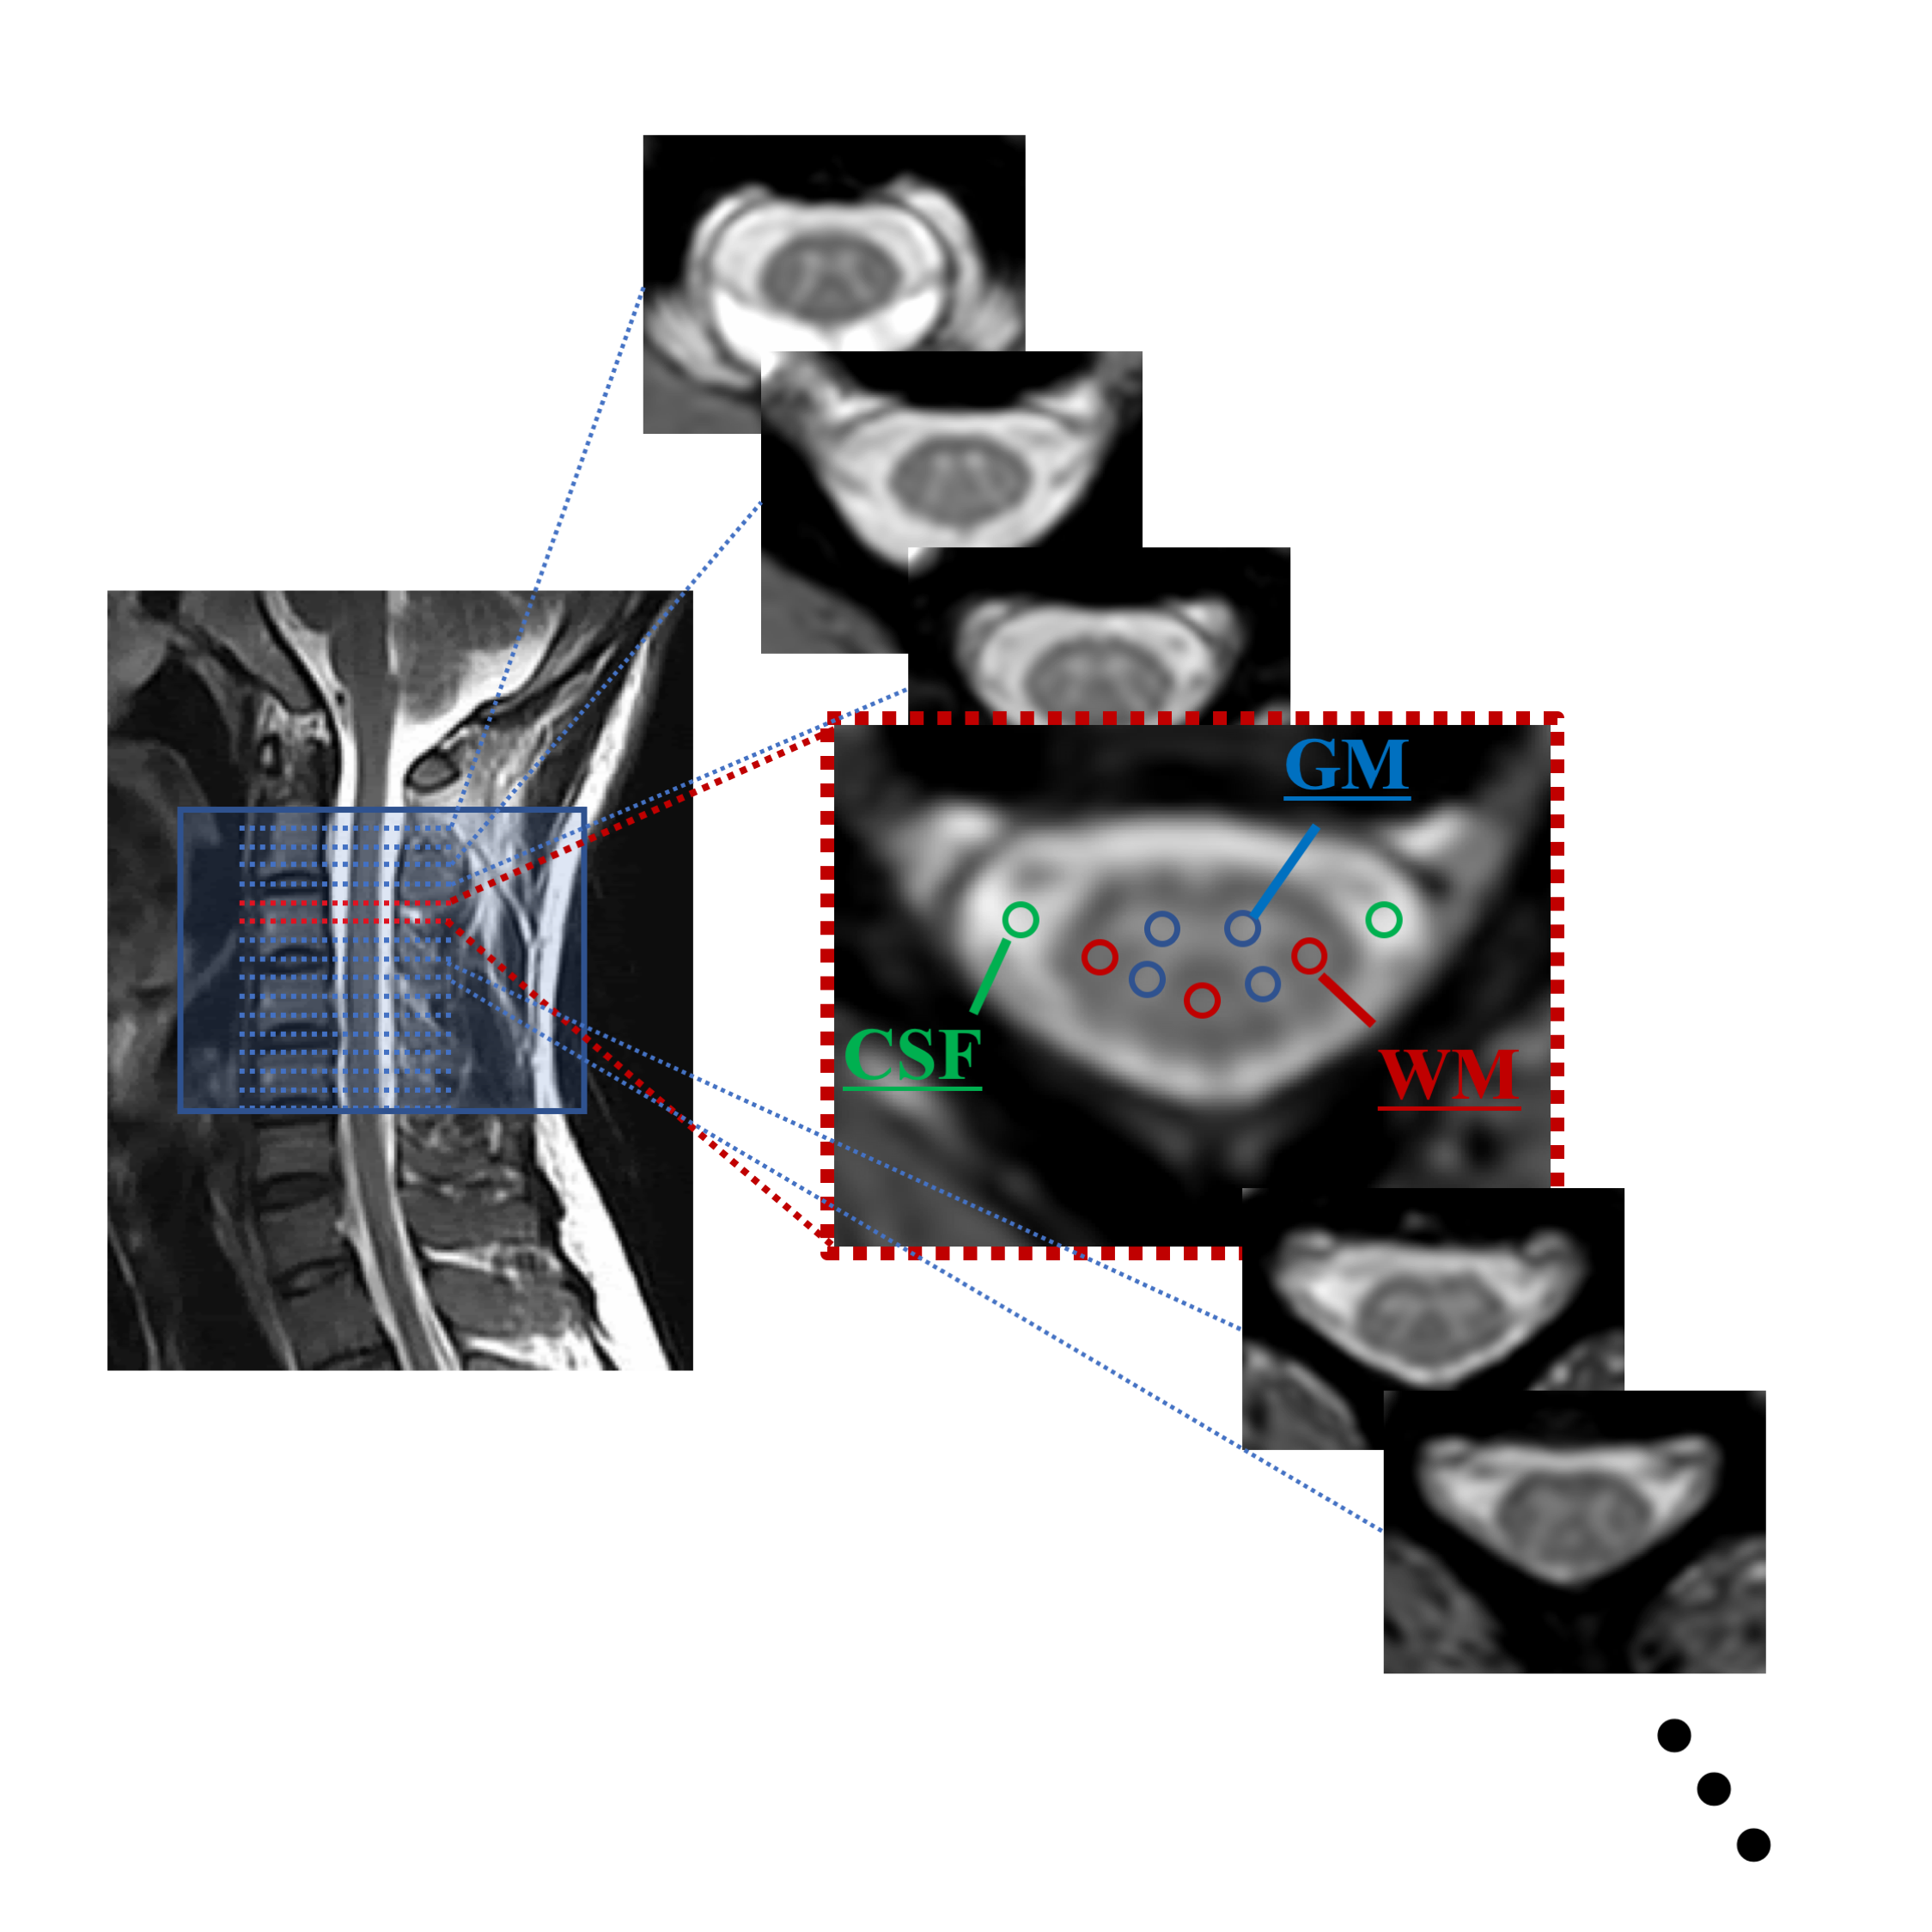
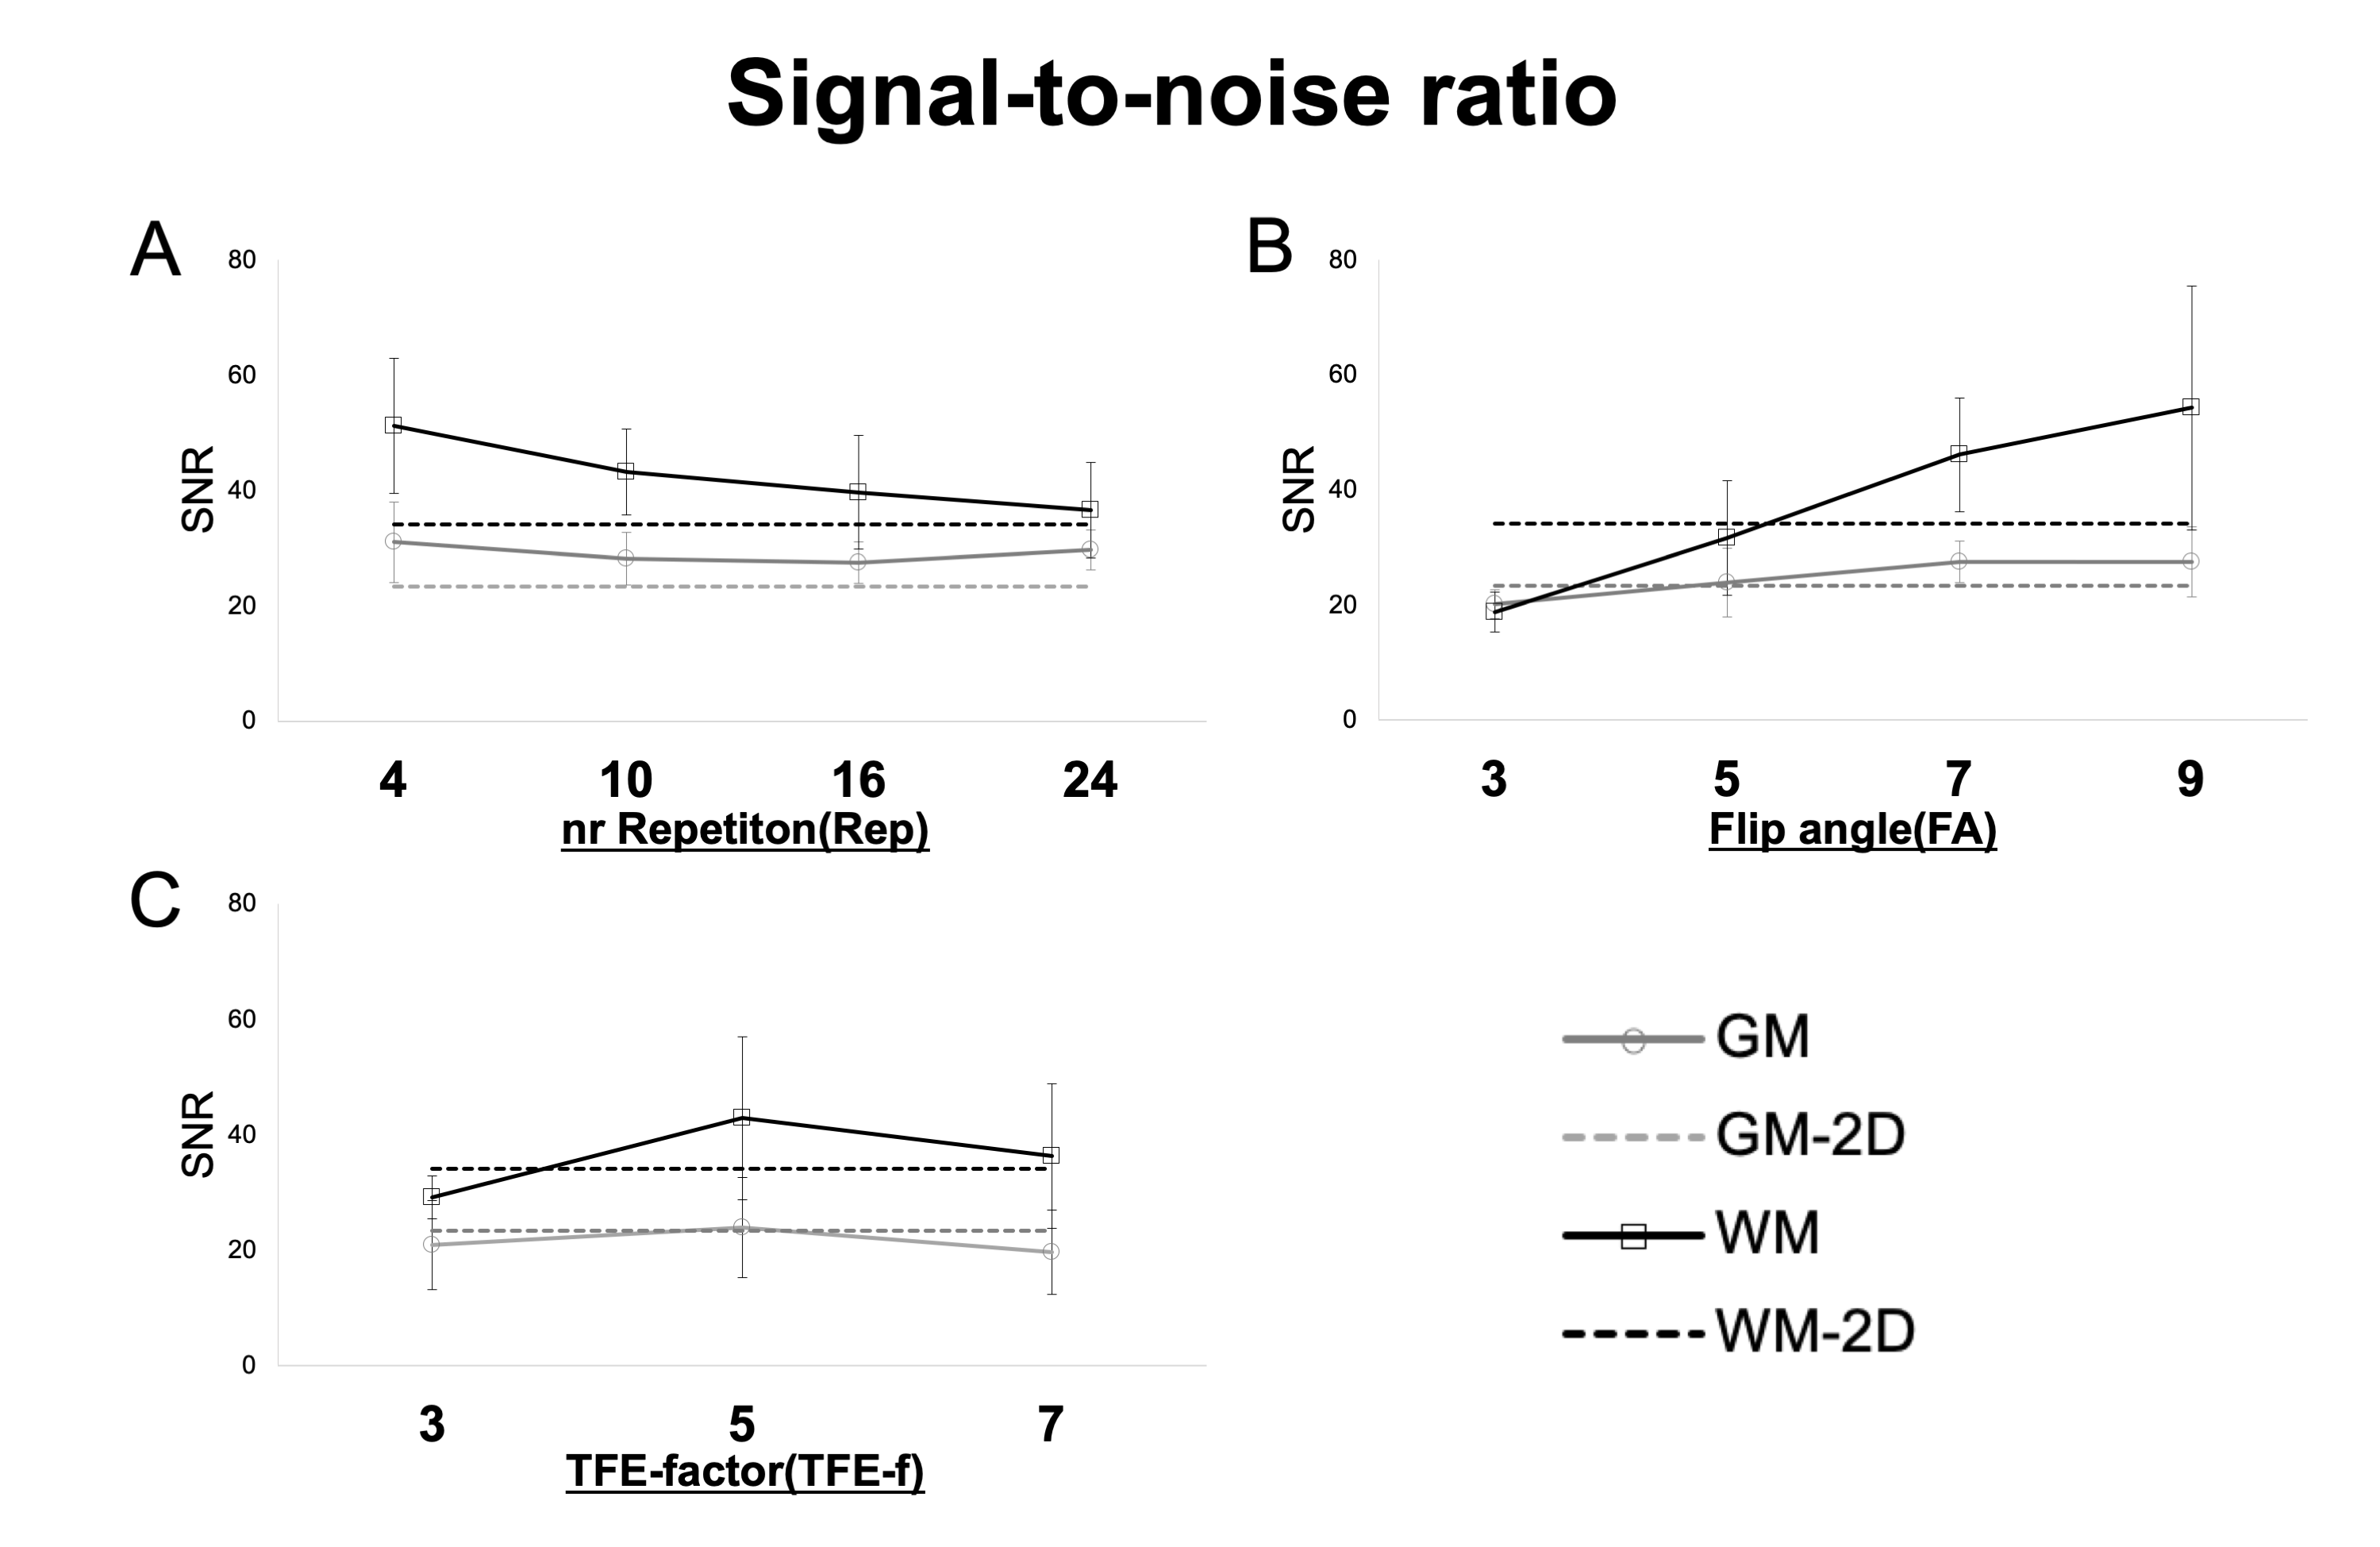
Five healthy subjects (mean age 28.9±2.4 years; three males) underwent an MRI of the cervical cord on a 3.0T scanner (Ingenia, Philips Healthcare) using m-FFE + ihMT. Rep (4,10,16,24) which is the number of times the applied ihMT pulse, Flip angle (FA) (3,5,7,9), and TFE factor (TFE-f) (3,5,7), were changed, and imaging was performed respectively (The imaging conditions are shown in Fig. 1A). When changing each parameter, the other parameters were kept constant at Rep=16, FA=7, and TFE-f=5. The m-FFE were performed in the range of segments C1 to C5 refer to individuals based on a sagittal T2-weighted image. For each healthy subject, two slices (C2 to C3) at the superior cervical spinal cord were selected and used for analysis (n=10). Regions of interest (ROIs) were set in the GM (4 points), WM (3 points), and CSF (2 points) in the acquired images manually, and the average value of each was used (Fig. 2). For each image, the SNR within GM and WM was computed according to: SNR = SI / SD. where SI and SD represent the mean and standard deviation of the voxel intensities within the GM or WM ROI. CNR between tissues x-y was computed as: CNRx-y = |SIx - SIy| / SDx2+SDy2. x-y represents GM/WM and WM/CSF.Results
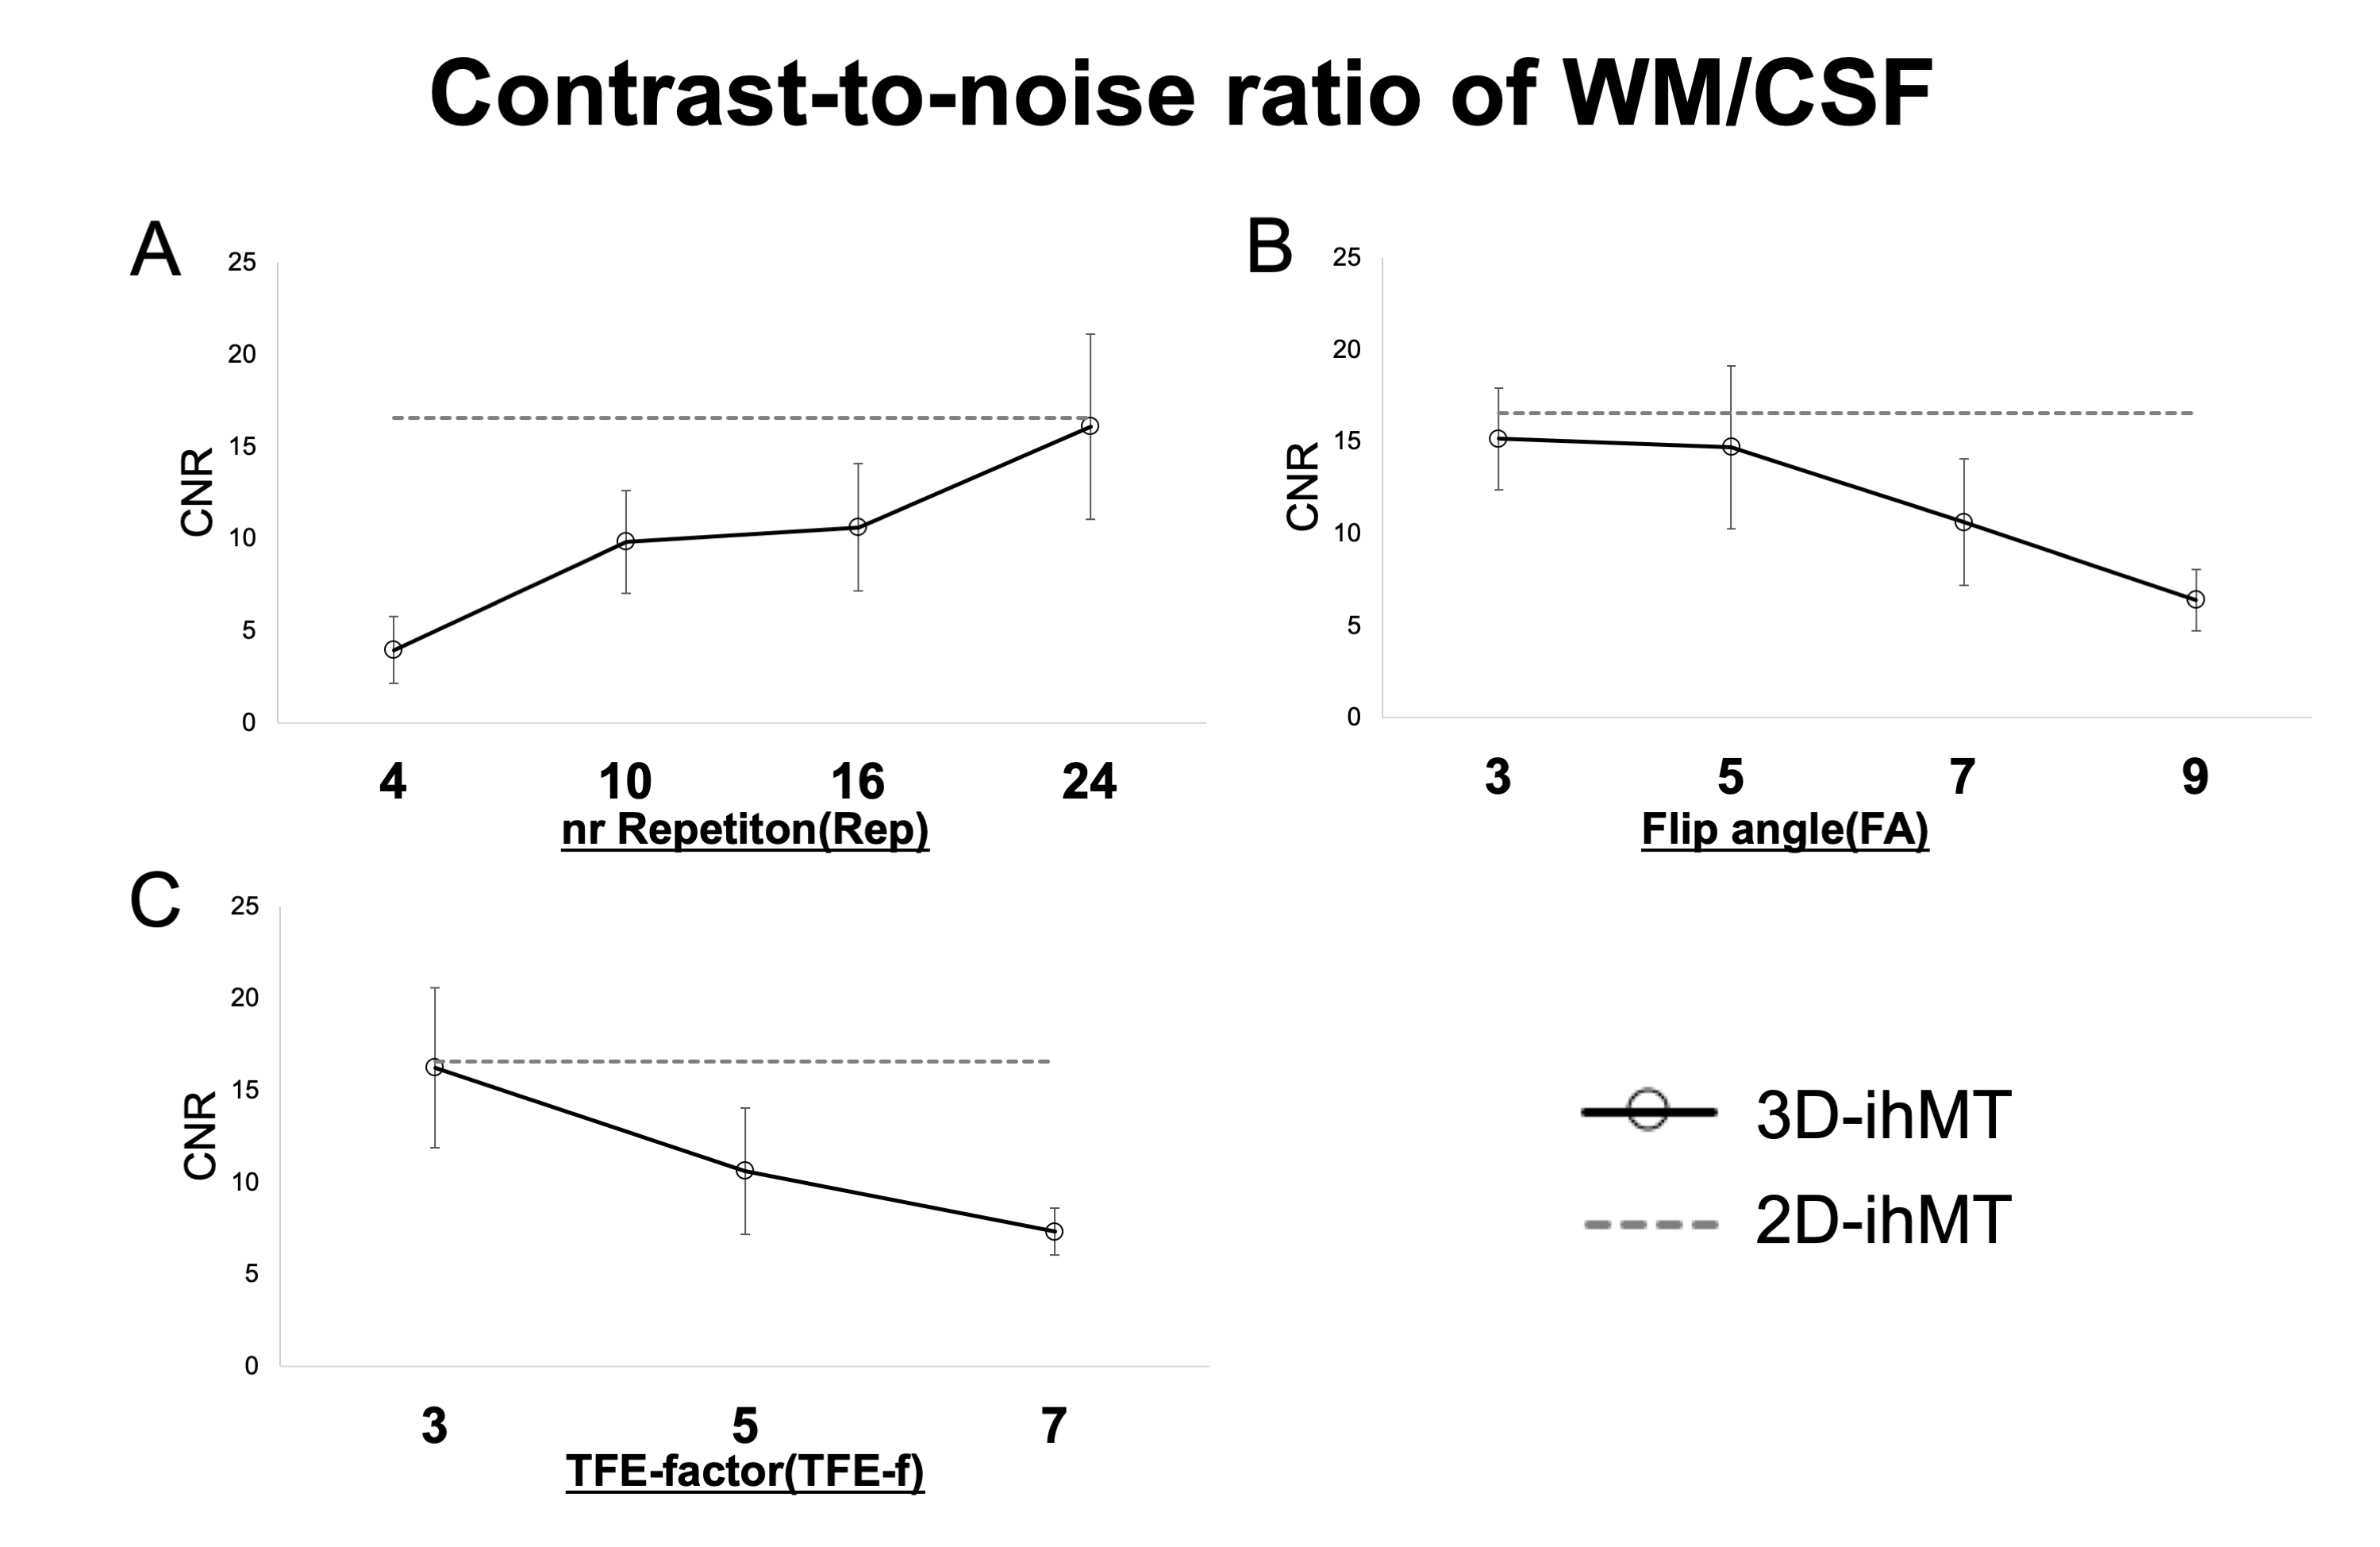
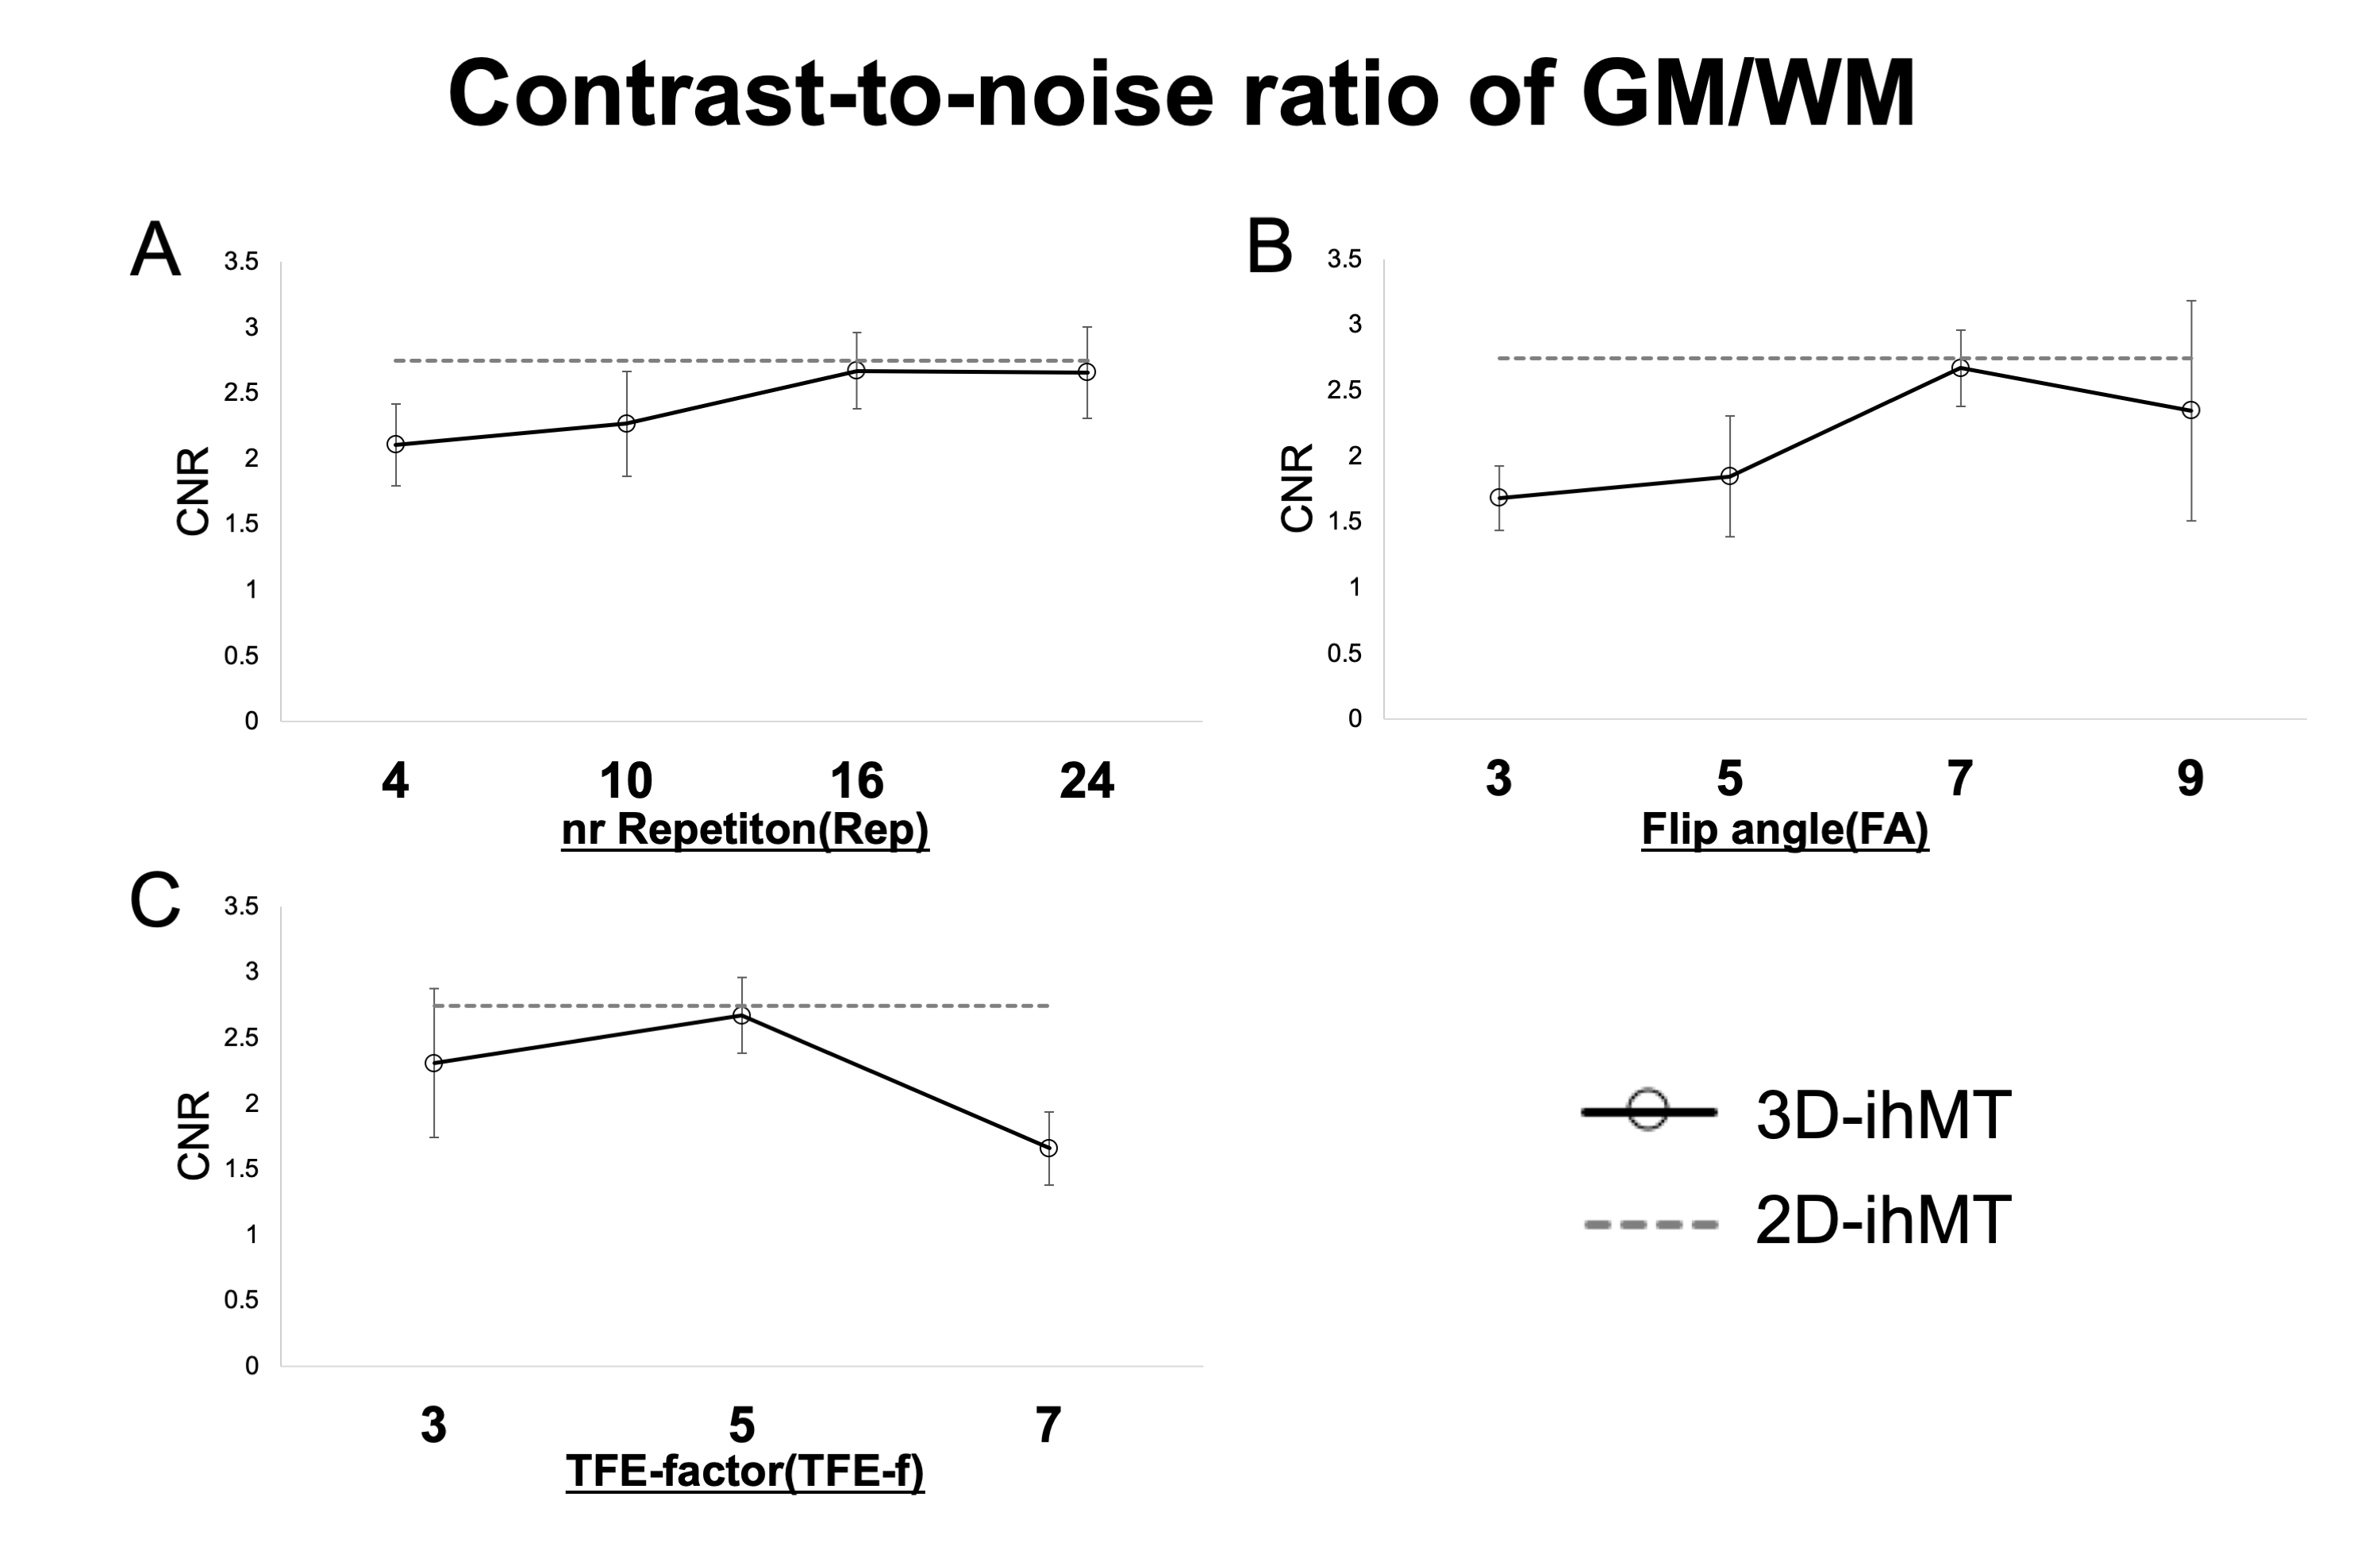
Quantitatively, the CNR between WM/CSF keeps increasing at an incrementally higher rate with each additional Rep, reaching a value close to 2D at 24. It also continues to decrease incrementally with FA and TFE-f (Fig. 3). The CNR between GM/WM keeps increasing at an incrementally higher rate with each additional Rep, reaching a value close to 2D at 16 and It shows a higher value at FA=7 and TFE-f=5 (Fig. 4). By lowering FA, the SNR of GM and WM will decrease. As Rep is increased, SNR tends to decrease only for WM (Fig. 5). The CNR characteristics of each of the 10 images in the series can be qualitatively appreciated in an example subject (Fig. 1B). A smaller FA decreases the overall signal intensity, while an increase in Rep increases the contrast of spinal cord structures.Discussion
The ability of 3D-ihMT to discriminate between GM and WM evaluated by CNR could be increased to a level close to that of 2D-ihMT. To our knowledge, this is the first study to examine the feasibility of 3D-ihMT for the segmentability of GM and WM of the cervical spinal cord. Rep has a strong effect on myelin-rich WMs and improves CNR. We observed that 4 times in 2D-ihMT is enough to improve contrast, but at least 16 times is needed for 3D-ihMT. Lower FA decreases SNR and higher FA decreases the contrast of WM/CSF. FA of 7 was feasible in this study. In terms of TFE-f, we propose a practical optimum of 5, When it is smaller than 5, the improvement in SNR and CNR cannot justify the increasing imaging time. Although 3D imaging has been reported in the past to provide higher CNR than 2D imaging4), in this study, we were not able to obtain CNR higher than 2D, because we used iso voxel. However, we believe that the ability to reconstruct images in arbitrary cross-sections is a great advantage because it greatly affects the detection of lesions5). One of the disadvantages of 3D imaging is that it is susceptible to the effects of motion6). But in this study, the results were obtained in young healthy subjects, and the effects of motion were considered to be minimal, so there is concern that CNR may be reduced in actual clinical practice compared with 2D-ihMT. It is necessary to evaluate the ability to detect lesions in actual clinical practice by adjusting the imaging time and the resolution.Conclusion
This study and the proposed sequence parameters are a step towards a good visualization of the cervical cord "butterfly" in 3D-ihMT.Acknowledgements
No acknowledgement found.References
1. Van Obberghen E, et al. Evaluation of the sensitivity of inhomogeneous magnetization transfer (ihMT) MRI for multiple sclerosis. Am J Neuroradiol 2018;39:634–41.
2. Ozturk A, et al. Axial 3D gradient-echo imaging for improved multiple sclerosis lesion detection in the cervical spinal cord at 3T. Neuroradiology 2013;55:431–9.
3. Rasoanandrianina H, et al. Sensitivity of the inhomogeneous magnetization transfer imaging technique to spinal cord damage in multiple sclerosis. Am J Neuroradiol 2020;41:929–37.
4. Asiri A, et al. Comparison between 2D and 3D MEDIC for human cervical spinal cord MRI at 3T. J Med Radiat Sci 2021;68:4–12.Varma G, et al. Three-dimensional inhomogeneous magnetization transfer with rapid gradient-echo (3D ihMTRAGE) imaging. Magn Reson Med 2020;84:2964–80.
5. Varma G, et al. Three-dimensional inhomogeneous magnetization transfer with rapid gradient-echo (3D ihMTRAGE) imaging. Magn Reson Med 2020;84:2964–80.
6. Li G, et al. Improving the robustness of 3D turbo spin echo imaging to involuntary motion. Magn Reson Mater Physics, Biol Med 2015;28:329–45.
Figures