4537
High-spatial assessment of low-level permeability within normal-appearing brain tissue using dual-temporal resolution DCE-MRI1Division of Informatics, Imaging and Data Sciences, University of Manchester, Manchester, United Kingdom, 2Department of Neurosurgery, Salford Royal NHS Foundation Trust, Manchester, United Kingdom
Synopsis
Quantifying blood-brain barrier permeability in normal-appearing brain through dynamic contrast-enhanced MRI (DCE-MRI) is challenging. We evaluated a new method, which combines the hybrid first-pass Patlak-plot (FP-PP) model with a high spatiotemporal resolution DCE approach termed LEGATOS. Dual-temporal resolution DCE-MRI data in twelve patients with neurofibromatosis type II (NF2) imaged at 1.5T were analyzed, and estimates of Ktrans within normal-appearing grey matter (NAGM) and white matter (NAWM) were compared. This new method permitted high-spatial resolution assessment of low-level permeability in normal-appearing brain and in our NF2 patient cohort a significant positive correlation between tumor volume and NAGM/NAWM Ktrans values was observed.
Introduction
Tumor and treatment-related changes in the vascular integrity of normal-appearing brain is of increasing importance in neuro-oncology and may help predict both prognosis and treatment response1–3. Dynamic contrast-enhanced MRI (DCE-MRI) is a widely used quantitative imaging method for assessing microvascular integrity but imaging of low-level blood-brain barrier (BBB) permeability using this technique is challenging due to low signal-to-noise and requirement for high-temporal resolution during data acquisition2. Previous studies have shown that analysis of high-temporal resolution DCE-MRI data using a “hybrid FP-PP” method, that combines the first-pass (FP) analytical approach with the Patlak plot (PP) is able to address some of these challenges, but at the expense of limited spatial resolution and/or volume coverage2. In this study we therefore sought to evaluate a new method, which integrates the hybrid FP-PP model with a recently published technique for providing high spatiotemporal resolution DCE data from dual-temporal resolution (DTR) DCE-MRI4. We hypothesized that integration of the hybrid FP-PP model with the LEGATOS (LEvel and rescale the Gadolinium contrast concentrations curves of high-temporal TO high-spatial DCE-MRI) technique would permit high-spatial resolution assessment of subtle BBB leakage, and this was evaluated through an in vivo study of patients with neurofibromatosis type 2 (NF2) related vestibular schwannoma (VS).Methods
PatientsPreviously acquired dual-injection, DTR DCE-MRI data in twelve patients with NF2-related VS was analyzed. Across all patients there were twenty VSs, with four patients having undergone previous resection of a VS.
MRI
All patients were imaged at 1.5T (Philips Achieva) and DCE-MRI data were collected using dual-injection DTR DCE-MRI, as described previously2,4,5. A macrocylic gadolinium-based contrast agent (GBCA; gadoterate meglumine; Dotarem, Guerbet S.A.) was administered by power injector as an intravenous bolus at a rate of 3 mL/s, followed by a chaser of 20 mL/s of 0.9% saline at the same rate. For VIF estimation a high-temporal resolution (1 s) sequence with a low-dose fixed-volume (3mls) of GBCA was performed (LDHT-DCE) using a 3D spoiled gradient-recalled echo (GRE) sequence. Subsequently, a full GBCA dose (0.1 mmol/kg), high- spatial resolution (voxel size = 1 × 1 × 2 mm) acquisition (FDHS-DCE) was performed to provide high-spatial resolution data. Variable flip angle (VFA; a = 2°, 8°, 15° and 20°) acquisitions were performed prior to the LDHT and FDHS DCE series for baseline longitudinal relaxation rate (R10) estimation.
Image Processing
High spatiotemporal resolution DCE data were generated using the LEGATOS technique, as described previously2. A two-part 4D GBCA concentration volume (HTHS-merged) with a HT arterial phase followed by a HS parenchymal tissue phase was constructed by combination of the HT and HS resolution series. After rescaling the high-temporal but low-spatial resolution first-pass concentration curves to higher spatial resolution using the LEGATOS method the tissue concentration-time curves of this 4D HTHS-merged concentration volume were fitted with the hybrid FP-PP method to produce transfer constant (Ktrans) and fractional plasma volume (vp) maps.
SPM6 was used for image co-registration and segmentation of the 3D T1W MRI data into GM, WM, and cerebrospinal fluid (CSF) probability maps. After re- alignment/ re-slicing of each map to a baseline FDHS DCE frame, masks of GM and WM were generated using a probability cutoff of 0.95. Only supratentorial NAGM/NAWM regions were included in each mask for quantitative Ktrans analysis (Figure 1).
Statistical Analysis
Estimates of Ktrans within normal-appearing grey matter (NAGM) and white matter (NAWM) across the twelve patients were compared using descriptive statistics and paired t-tests. Estimates of mean Ktrans measured from the NAGM/NAWM segmentations were also compared with VS volume size using scatterplot analysis and reported as Pearson’s product-moment correlation coefficient (r). The tumor volume size used in the correlation analysis was defined as either: 1) the average size across both VSs (or the size of the single VS in patients previously having undergone a VS resection); 2) cumulative tumor volume across both/single VSs.
Results
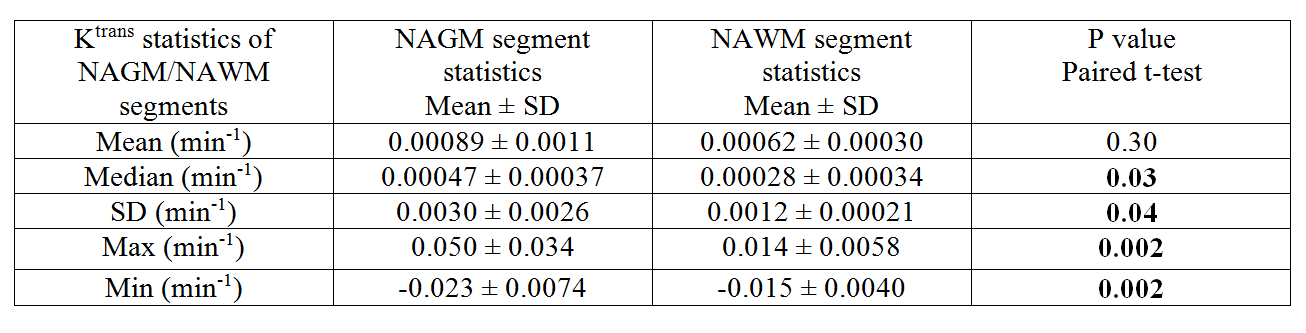
Figure 2 shows that incorporating the LEGATOS technique and hybrid FP-PP model can provide high-spatial resolution maps of the pharmacokinetic parameter Ktrans within normal-appearing brain tissue. Note, by comparison, the absence of measurable Ktrans values within normal-appearing brain tissues when using the widely used extended Tofts model7.Descriptive Ktrans statistics obtained from NAGM/NAWM in the 12 patients are shown in Table 1. Segmented NAGM displayed non-significantly higher mean (p=0.30) and significantly higher median (p=0.03) and max (0.002) Ktrans values compared to segmented NAWM (paired t-test). Mean Ktrans measured from both the NAGM or NAWM segments showed a significant correlation with both average VS volume size (p≤0.02) and total VS volume (p≤0.01, Figure 3).
Discussion and Conclusion
This in vivo study demonstrated that integration of the hybrid FP-PP model with LEGATOS permits high-spatial resolution assessment of low-level permeability in normal-appearing brain. In keeping with previous literature demonstrating higher blood volume, higher vascular surface area and higher transfer constant estimates in grey compared to white matter8–10 our study data demonstrated higher Ktrans estimates within NAGM compared to NAWM. In this NF2 patient cohort a significant positive correlation between total VS disease burden and Ktrans values in NAGM/NAWM was observed and this will be investigated further in future studies.Acknowledgements
The work was supported by funding from Cancer Research UK (CRUK) and the Engineering and Physical Sciences Research council (ESPRC) through the Cancer Imaging Centres grant (C8742/A18097).References
1. Sasi S D, Gupta RK, Patir R, et al. A comprehensive evaluation and impact of normalization of generalized tracer kinetic model parameters to characterize blood-brain-barrier permeability in normal-appearing and tumor tissue regions of patients with glioma. Magn. Reson. Imaging 83, 77–88 (2021).
2. Li KL, Zhu X, Zhao S, Jackson A. Blood–brain barrier permeability of normal-appearing white matter in patients with vestibular schwannoma: A new hybrid approach for analysis of T1-W DCE-MRI. J. Magn. Reson. Imaging (2017).
3. Sengupta A, Agarwal S, Gupta PK, et al. On differentiation between vasogenic edema and non-enhancing tumor in high-grade glioma patients using a support vector machine classifier based upon pre and post-surgery MRI images. Eur. J. Radiol. 106, 199–208 (2018).
4. Li KL, Lewis D, Coope DJ, et al. The LEGATOS technique: A new tissue-validated dynamic contrast-enhanced MRI method for whole-brain, high-spatial resolution parametric mapping. Magn. Reson. Med. (2021).
5. Li KL, Buonaccorsi G, Thompson G, et al. An improved coverage and spatial resolution-using dual injection dynamic contrast-enhanced (ICE-DICE) MRI: A novel dynamic contrast-enhanced technique for cerebral tumors. Magn. Reson. Med. 68, 452–462 (2012).
6. Ashburner J, Friston K. Multimodal Image Coregistration and Partitioning—A Unified Framework. Neuroimage (1997).
7. Tofts, P. S. Modeling tracer kinetics in dynamic Gd-DTPA MR imaging. Journal of Magnetic Resonance Imaging vol. 7 91–101 (1997).
8. Varatharaj A, Liljeroth M, Darekar A, et al. Blood-brain barrier permeability measured using dynamic contrast-enhanced magnetic resonance imaging: a validation study. J. Physiol. 597, 699–709 (2019).
9. Heye AK, Thrippleton MJ, Armitage PA, et al. Tracer kinetic modelling for DCE-MRI quantification of subtle blood-brain barrier permeability. Neuroimage 125, 446–455 (2016).
10. Cramer SP, Simonsen H, Frederiken, et al. Abnormal blood-brain barrier permeability in normal appearing white matter in multiple sclerosis investigated by MRI. NeuroImage Clin. (2014).
Figures
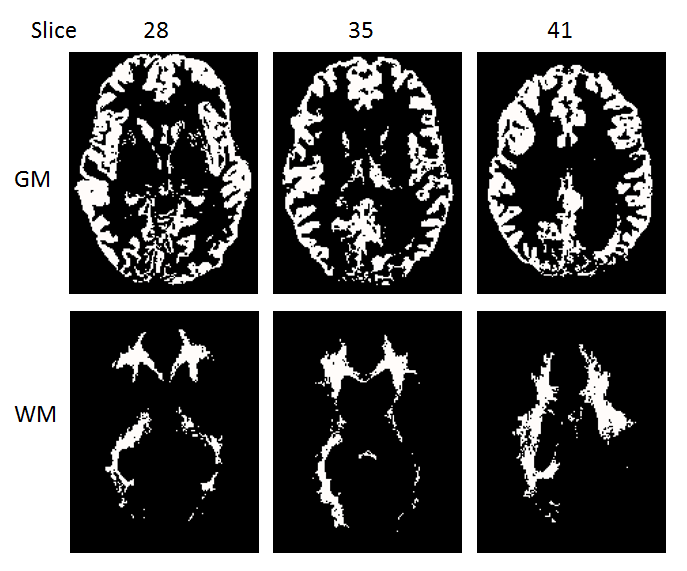
Figure 1: Representative NAGM/NAWM masks for quantitative Ktrans analysis. Each mask contains slices 28-41 in supratentorial NAGM/NAWM regions.
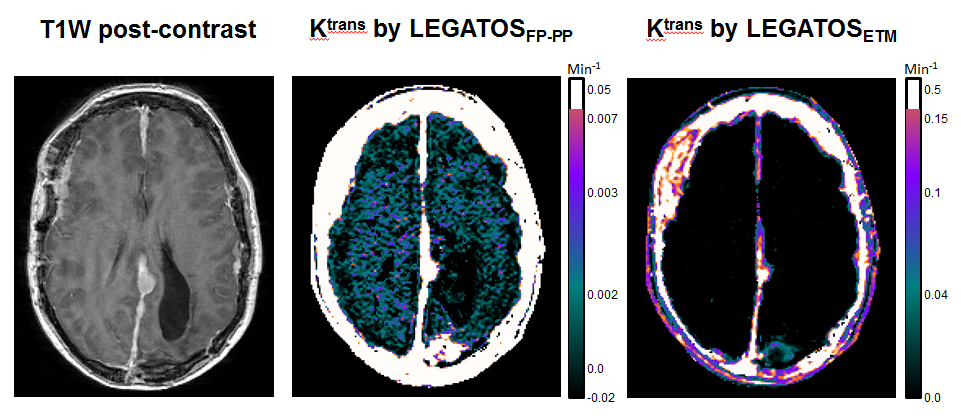
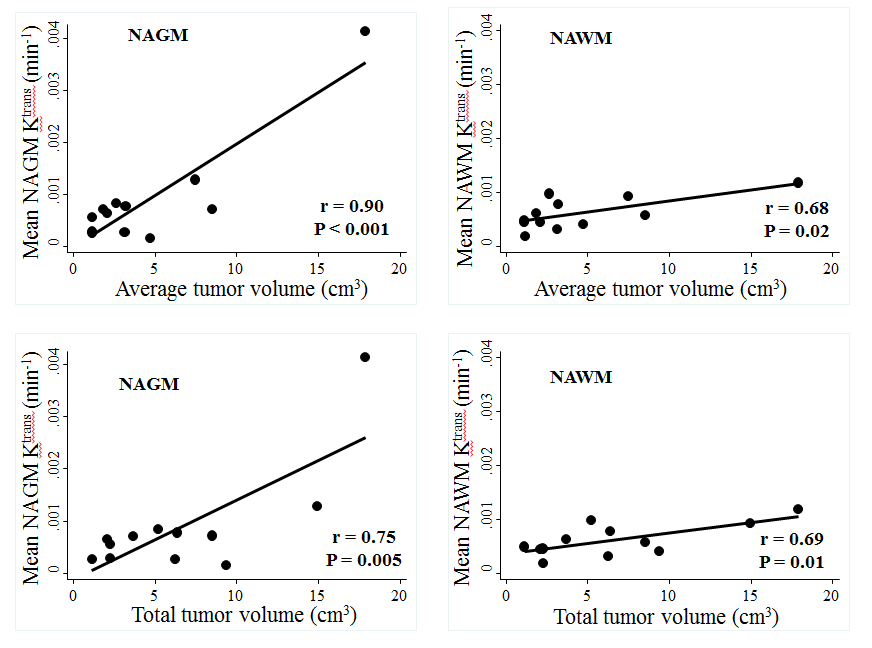
Figure 3: Correlation between mean NAGM/NAWM Ktrans and VS volume
Top row: Correlation between average VS volume and mean NAGM (left)/NAWM (right) Ktrans values.
Bottom row: Correlation between cumulative VS volume and mean NAGM (left)/NAWM (right) Ktrans values.
Correlations reported as Pearson’s product-moment correlation coefficient (r).