4536
Utility of advanced diffusion model in early detection of cervical spondylotic myelopathy: a comparison between DTI and NODDI1Peking University Third Hospital, Beijing, China, 2Engineering Research Center of Bone and Joint Precision Medicine, Beijing, China, 3Beijing Key Laboratory of Spinal Disease Research, Beijing, China, 4MR collaboration, Siemens Healthineers Ltd, Beijing, China
Synopsis
This study compared the sensitivity of diffusion tensor imaging (DTI) and neurite orientation dispersion and density imaging (NODDI) to detect cervical spondylotic myelopathy (CSM) at an early stage. The results showed that NODDI-based indicators can distinguish patients with CSM without T2-weighted increased signal intensity from healthy controls during internal validation, while DTI-based indicators cannot. These findings suggest that NODDI is a promising method to detect CSM at an early stage.
Introduction
Currently, diagnosis of cervical spondylotic myelopathy (CSM) relies on spinal cord macrostructural changes revealed by conventional MRI, such as increased signal intensity on T2-weighted images (T2WI). However, in the early stages of CSM, increased signal intensity (ISI) is often not obvious or absent making early diagnosis based on conventional MRI impracticable (1). Diffusion tensor imaging (DTI) and neurite orientation dispersion and density imaging (NODDI) are capable of reflecting spinal cord microstructural changes with quantitative parameters. Therefore, we hypothesize that DTI and NODDI may be used to detect CSM at an early stage before ISI appears on T2WI.Methods
Data AcquisitionDWI from 13 patients with CSM but without T2WI ISI and 13 age- and sex-matched healthy controls (HCs) were recruited from a prospective DWI related study and retrospectively analyzed using DTI and NODDI models, separately. Participants were scanned on a 3T MRI scanner (MAGNETOM Prisma, Siemens Healthcare, Erlangen, Germany) equipped with a 20-channel head/neck coil. The MRI sequences included turbo spin-echo (TSE) T2WI, multi-echo gradient-echo T2*WI, and DWI with zoomed imaging technique (ZOOMit). Detailed parameters for the ZOOMit-DWI sequence were as follows: axial slices; three shells with b values = 800, 1600, and 2400 s/mm2, each with 64 directions; 5 b0 images (b=0 s/mm2). TR=2000 ms, TE= 85 ms, flip angle=90°, FOV=145 × 419, slice thickness=3 mm, scanning time =13:04 mins.
DWI Image Analysis
The spinal DWI data was pre-processed using SpinalCordToolbox (SCT, version 4.0.0, https://github.com/neuropoly/spinalcordtoolbox) (2) and FSLeyes (Version: 0.34.2, https://fsl.fmrib.ox.ac.uk/fsl/fslwiki/FSLeyes) software with the following steps: pre-cropping, denoising, motion correction, and eddy current corrections. The pre-processed DWI data were fitted with NODDI and DTI models using Accelerated Microstructure Imaging via Convex Optimization (AMICO, Version 1.2.9, https://github.com/daducci/AMICO) and Dipy (Version 1.3.0, https://www.dipy.org/) software to obtain quantitative DTI based parameters (fractional anisotropy [FA] and mean diffusivity) and NODDI based parameters (isotropic volume fraction [ISOVF], intracellular volume fraction, and orientation dispersion index).
Regions of interest
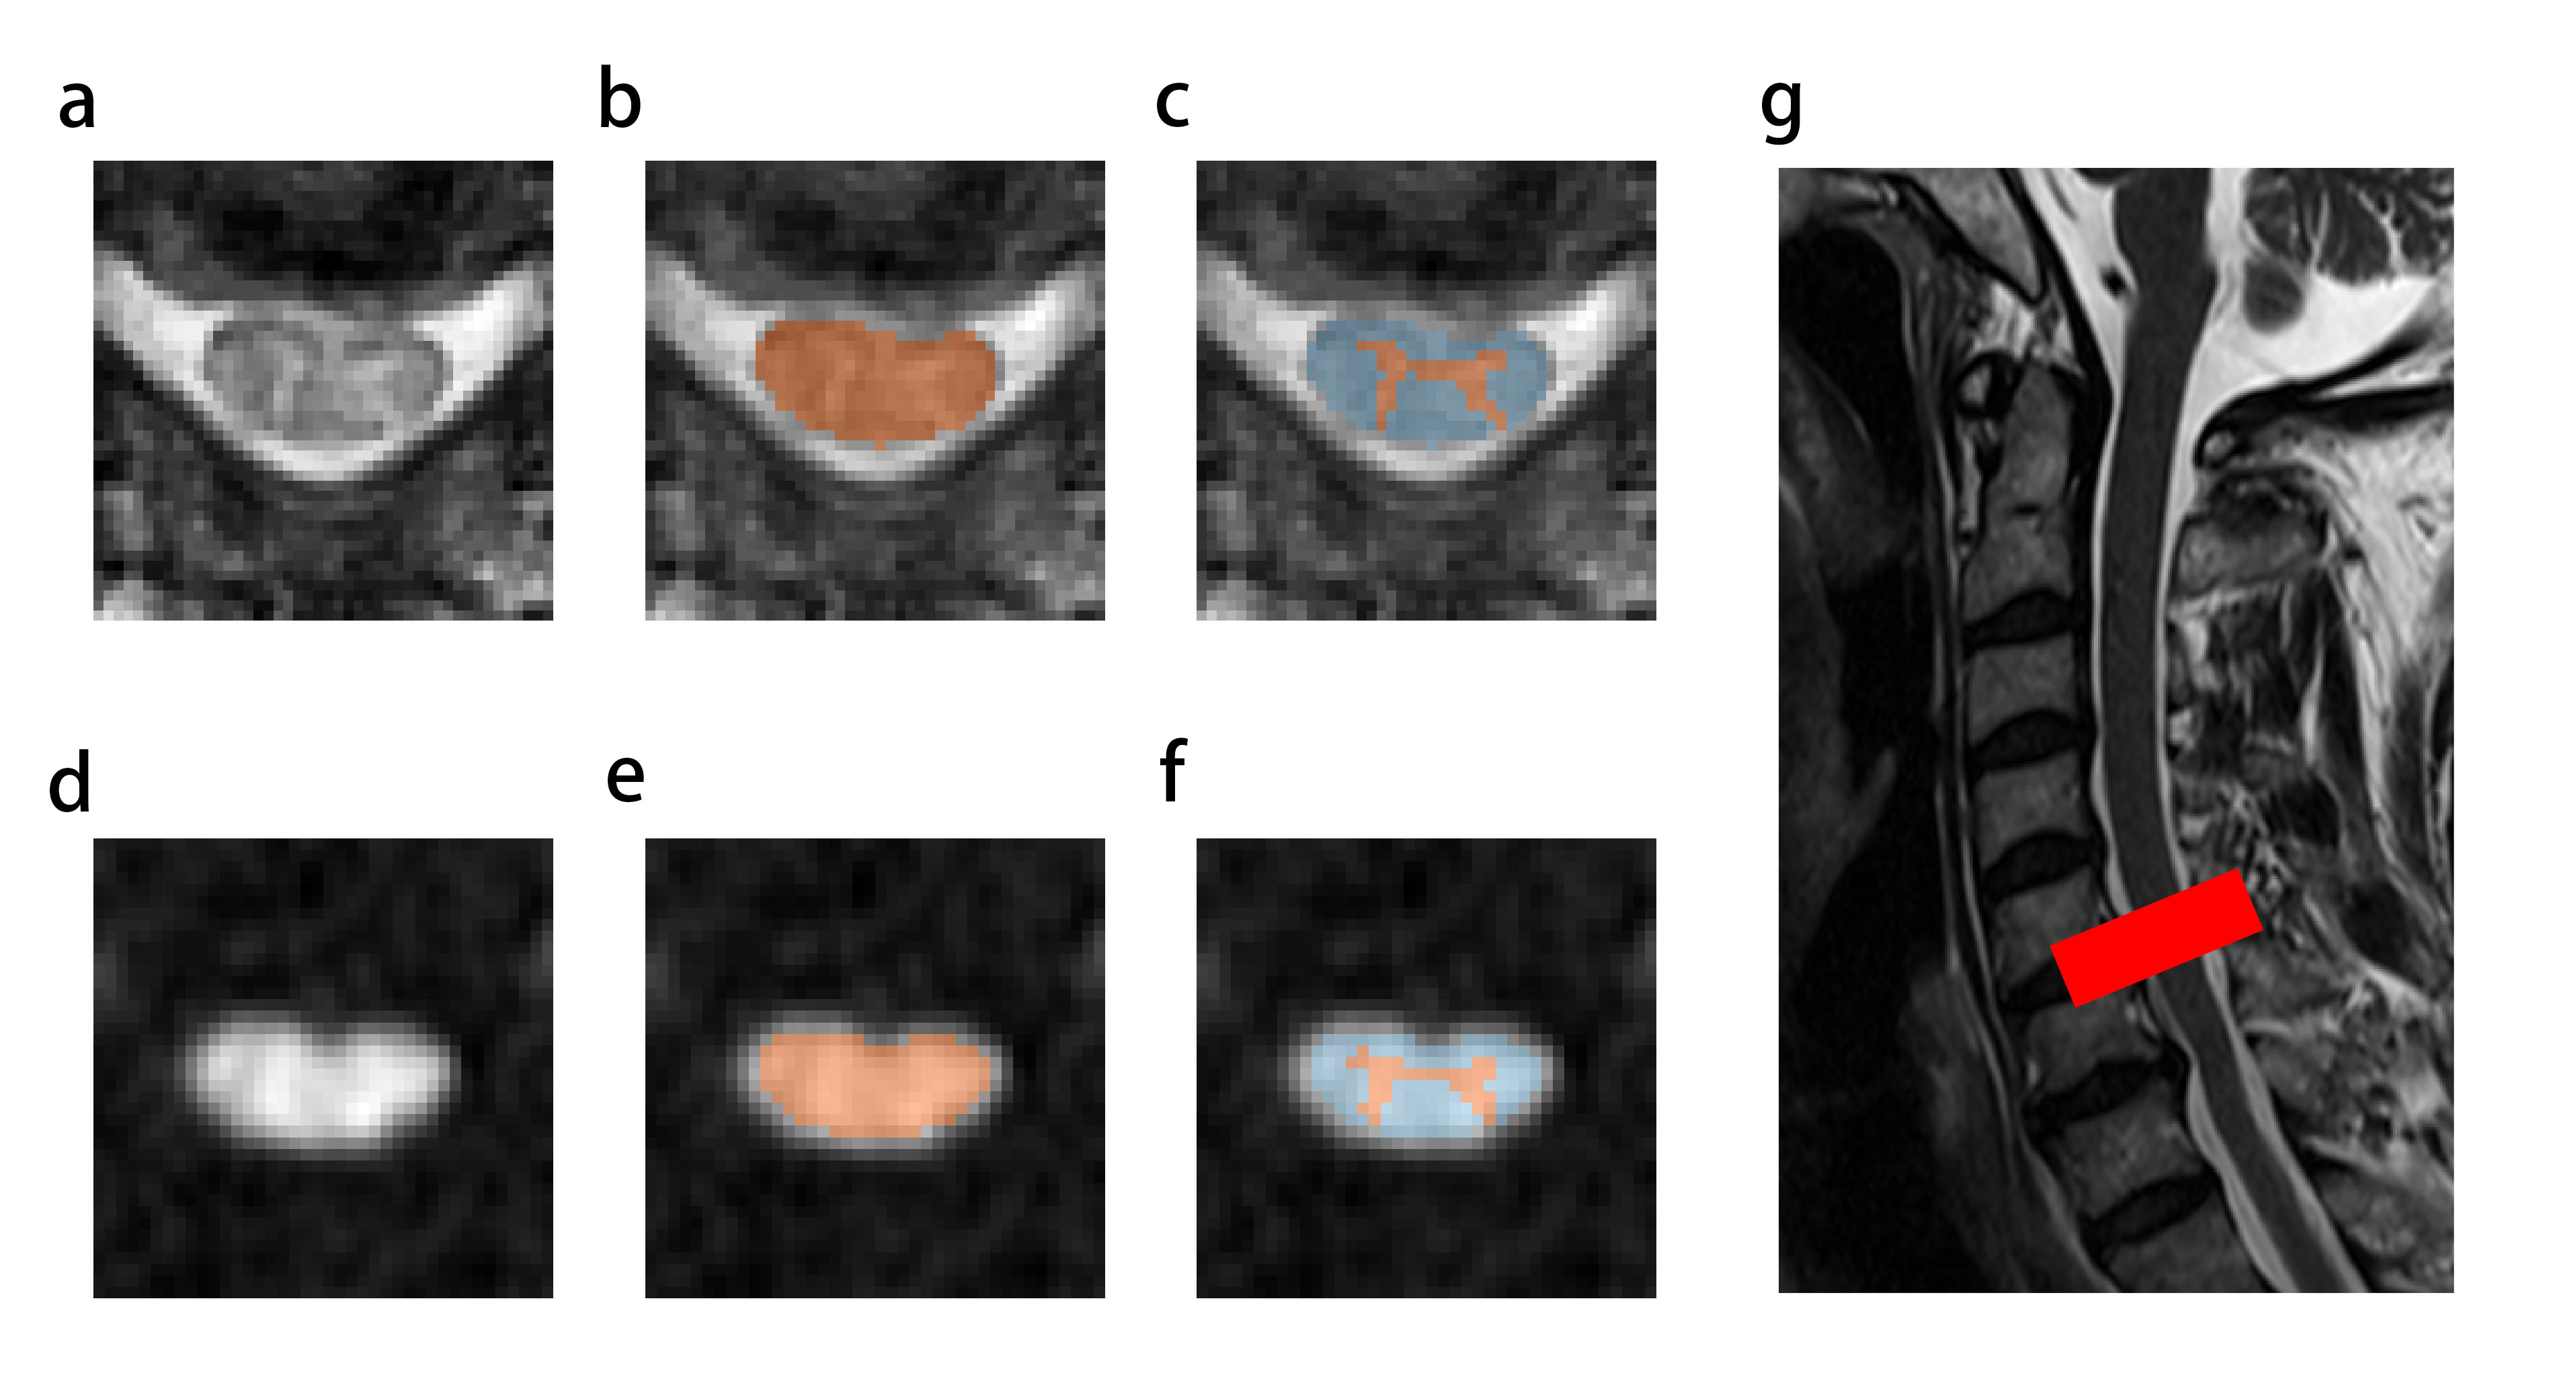
The patients’ spinal cords (SCs) were compressed at the intervertebral disc level C5-6. In this study, SC, white matter (WM), and grey matter (GM) at the C5-6 level were labelled as region of interests (ROI), named as ROISC, ROIWM, and ROIGM, respectively. These ROIs were obtained by firstly segmenting T2* images and then registering T2* to mean DWI images using the aforementioned SCT (Fig 1). DTI and NODDI parameters were then extracted from each ROI.
Statistical methods
Indicators for each ROI were compared between patients and HCs using Student’s-t test. Diagnostic models were constructed by simple logistic regression based on each indicator, then validated by leave one out cross validation (LOOCV). Meaningful diagnostic models, defined as the area under the receiver operating characteristic curves (AUC) significantly higher than 0.5 during LOOCV, were evaluated by DeLong test. P<0.05 was set as significant.
Results
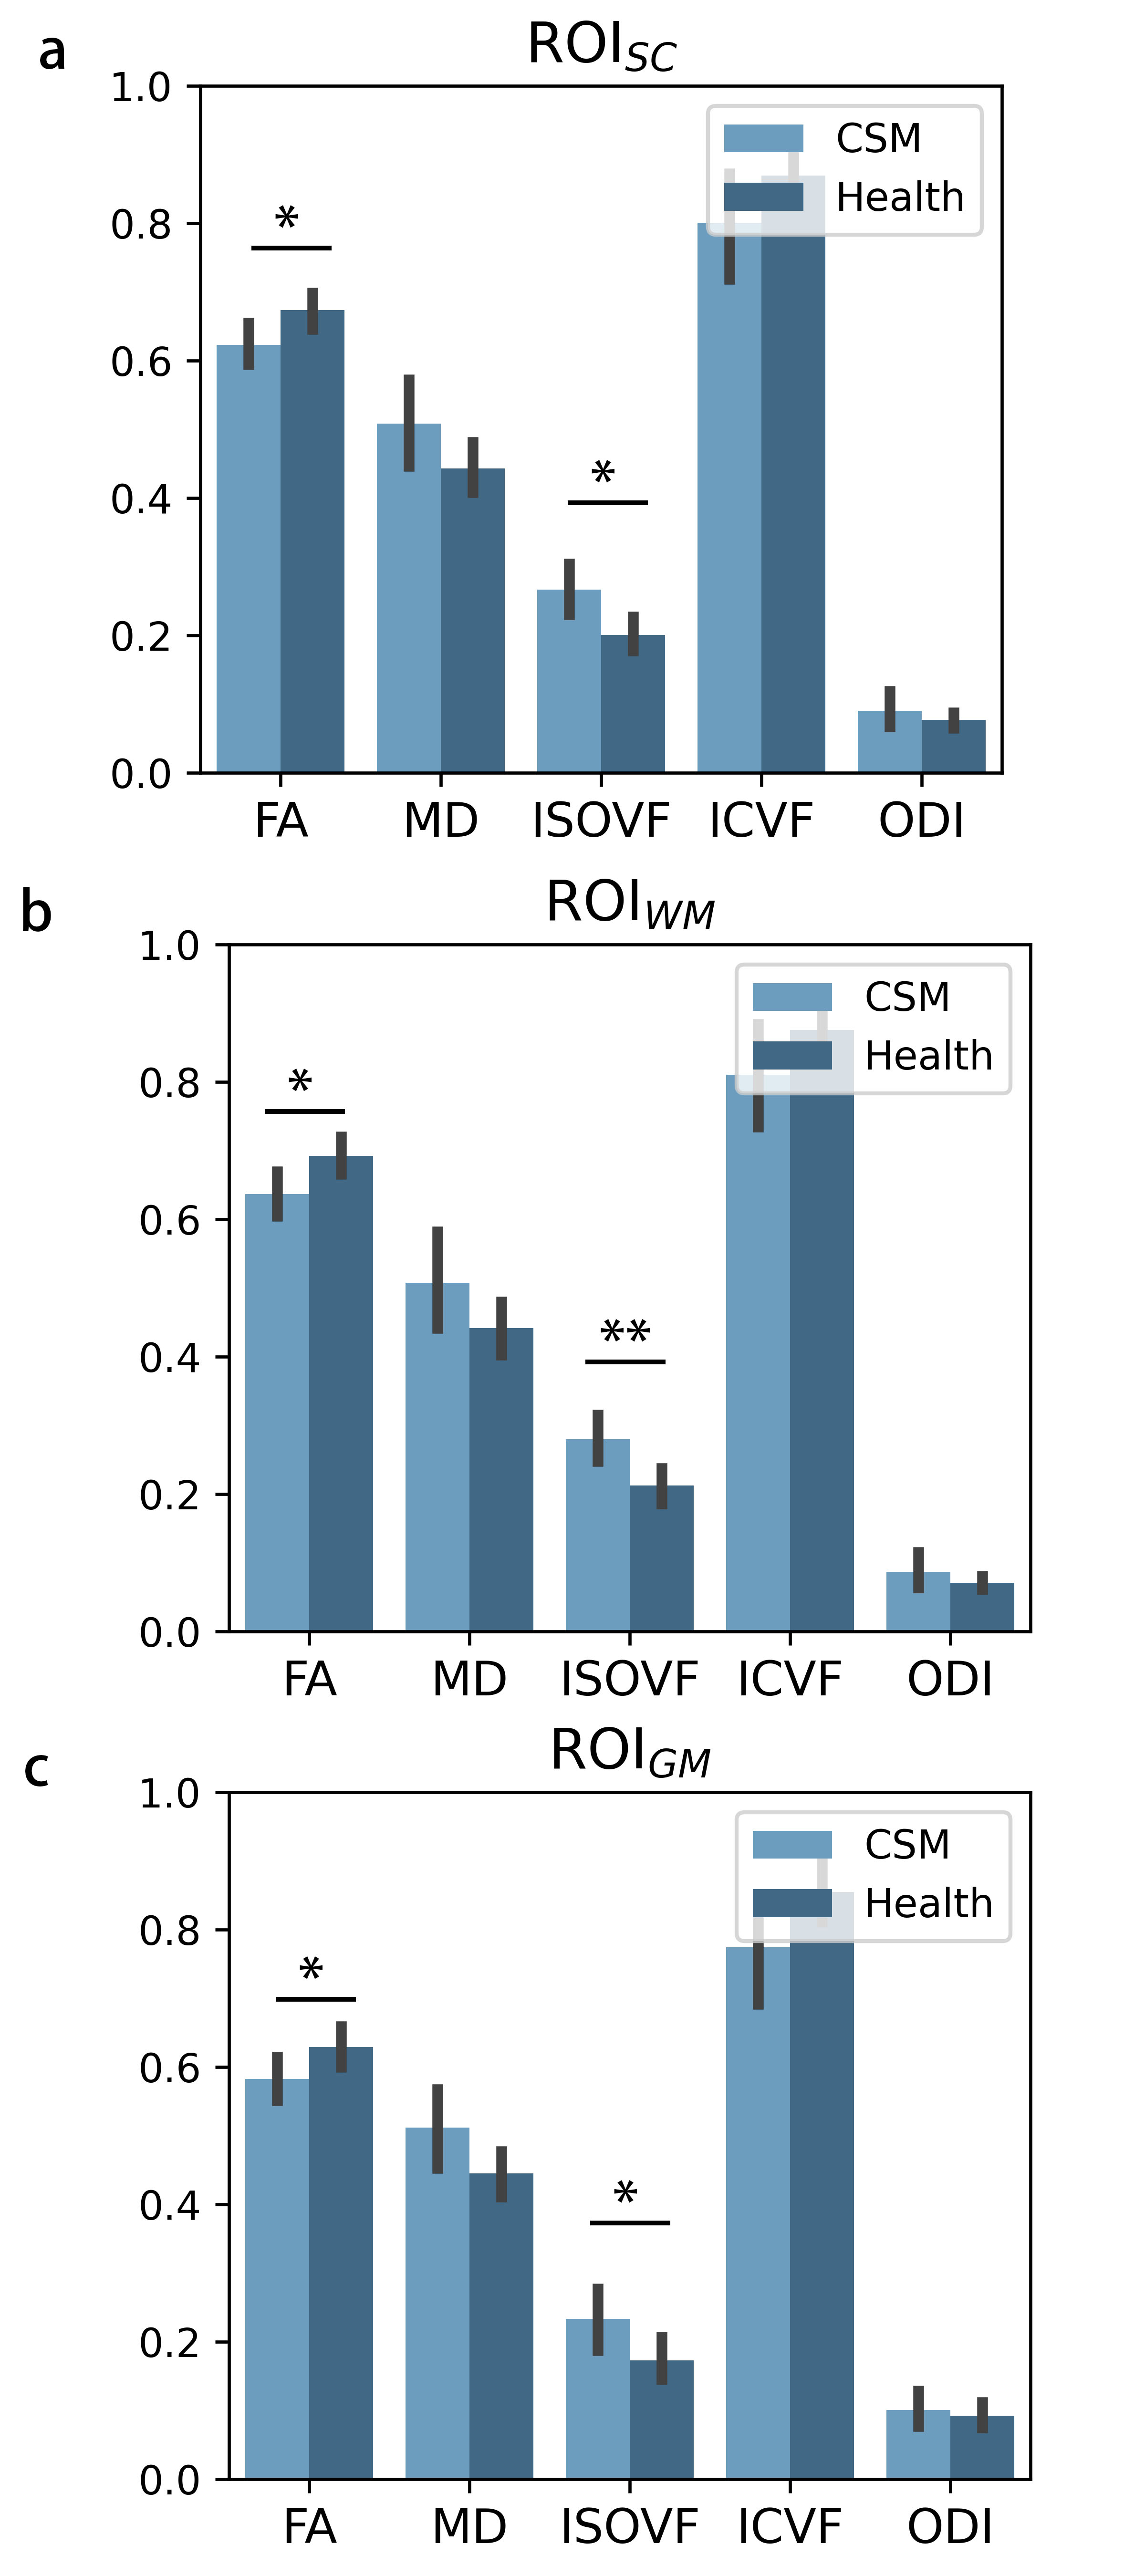
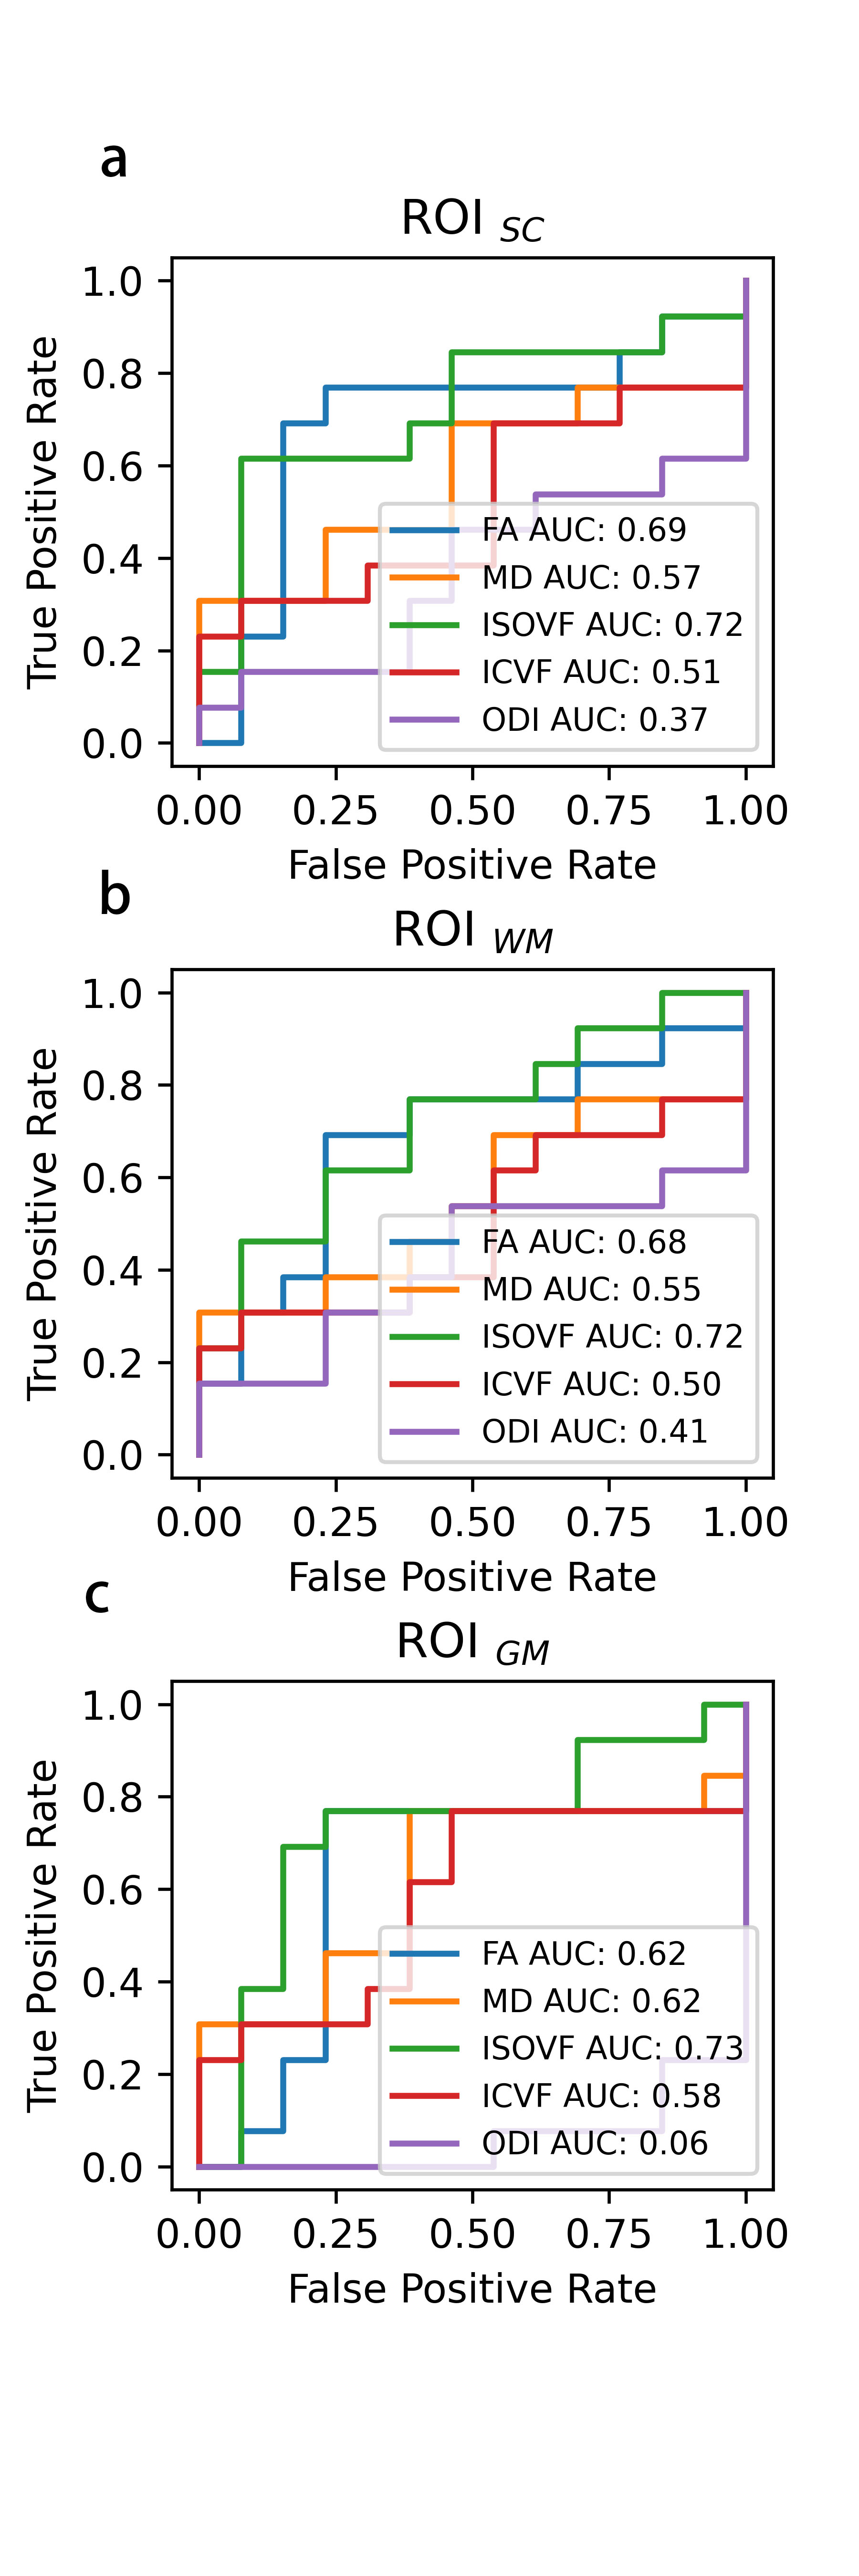
As shown in Fig 2, patients’ ISOVF in ROISC, ROIWM, and ROIGM were statistically increased compared with HCs. Diagnostic models based on these indicators were meaningful (AUC=0.72±0.11, 0.72±0.10, and 0.73±0.11, respectively). Though the patients’ FA in ROISC, ROIWM, and ROIGM significantly decreased, AUCs of the corresponding models were not statistically higher than 0.5 (p=0.102, 0.109, and 0.367, respectively).Discussion
Early diagnosis of CSM will be vital for timely treatment and better recovery. To this end, this study compared the utility of DTI and NODDI derived parameters and found that NODDI is a more sensitive method.One important finding is that ISOVF in the CSM patients’ group were significantly increased in all ROIs, and ISOVF achieved good performance in ROC analysis, suggesting ISOVF in NODDI model is a reliable diagnostic indicator. In theory, ISOVF reflects the unrestricted extracellular free water diffusion. When the spinal cord is injured at an early-stage, demyelination and edema occur resulting in unrestricted water movement. ISOVF might reflect these early spinal cord microstructural changes in CSM patients (3, 4).
Another important finding is that SC could be an appropriate ROI in DWI analysis. This study found that indicators that were significantly different between the two groups in WM and GM, were also significantly different in SC, as well as in the ROC analysis for evaluating diagnostic performance. Given that SC is easier to obtain in segmentation than WM and GM, SC is a better candidate for ROI analysis of DWI data.
Conclusion
NODDI ISOVF can distinguish CSM patients from HCs at an early stage while DTI indicators cannot achieve this goal. SC is an ideal ROI due to easy access and its ability to achieve similar diagnostic performance as WM and GM.Acknowledgements
This work was supported by the following funds: the National Multidisciplinary Cooperative Diagnosis and Treatment Capacity Building Project for Major Diseases, BYSYZHKC2020116, BYSY2018003, BNSF (7204327, Z190020), PKU2021LCXQ005, Capital's Funds for Health Improvement and Research (2020-4-40916), and NSFC 82102638.References
1. Kara B, Celik A, Karadereler S, et al. The role of DTI in early detection of cervical spondylotic myelopathy: a preliminary study with 3-T MRI. Neuroradiology 2011;53:609-616.
2. De Leener B, Levy S, Dupont SM, et al. SCT: Spinal Cord Toolbox, an open-source software for processing spinal cord MRI data. Neuroimage 2017;145:24-43.
3. Kamiya K, Hori M, Aoki S. NODDI in clinical research. J Neurosci Methods 2020;346:108908.
4. Wen CY, Cui JL, Lee MP, Mak KC, Luk KD, Hu Y. Quantitative analysis of fiber tractography in cervical spondylotic myelopathy. Spine J 2013;13:697-705.
Figures