4531
The evaluation of brachial plexus injury by using diffusion tensor imaging (DTI)1Philips Healthcare, Beijing, China, 2The Third Hospital of Hebei Medical University, Shijiazhuang, China
Synopsis
Quantifying the functional parameters of brachial plexus injury can provide more valuable information for clinic. This article aims to apply diffusion tensor imaging (DTI)to brachial plexus injury and reveal the pathological causes of the disease from Magnetic Resonance Imaging (MRI). Our study revealed that patients with brachial plexus injury had higher FA and lower ADC values when compared with the healthy control, and FA showed the better diagnostic efficiency (AUC:0.763; sensitivity: 94.1%; specificity: 44.1%).
Introduction
Brachial plexus injury as an ordinary type of peripheral nerve injury, the upper limb function of patients would be partially or completely lost, or even deteriorated to lifelong disability when the injury occurs. Functional magnetic resonance imaging (fMRI) can provide qualitative or quantitative results, which has advantages in disease evaluation, curative effect evaluation and prognosis prediction1-3. Among them, diffusion tensor imaging (DTI) can provide more quantitative analysis of the size and orientation of water molecules4. Studies have shown that DTI are of great value in the evaluation of main nerve entrapment syndromes in both peripheral nerves and brachial or lumbar plexus5. But few studies focused on the application of fMRI for brachial plexus injury. Therefore, the purpose of this study was to evaluate brachial plexus injury by using DTI sequences.Methods
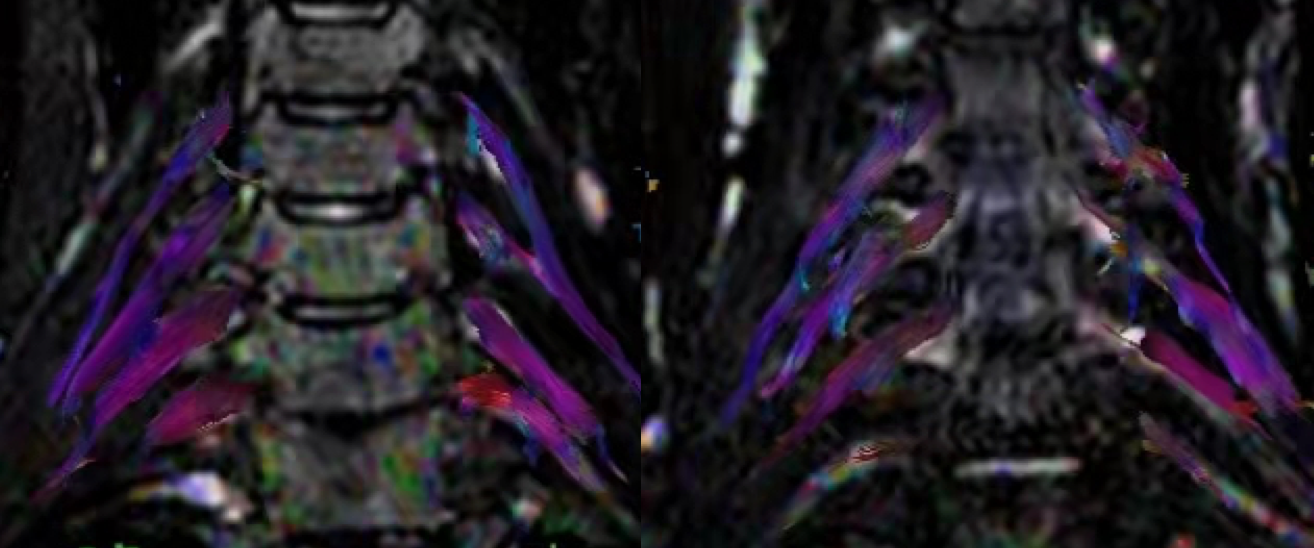
Patients with brachial plexus injury were performed on a 3.0T MR scanner (Ingenia CX, Philips Healthcare, the Netherlands). The contralateral side of the injured nerve was taken as the control, and the injured group was divided into postganglionic and complete injury groups according to the results of electromyography. The scan protocol consisted of T2 weighted(T2WI), T2WI-DRIVE-3D, 3D Nerve View and DTI. The b values of DTI sequence values are 0 and 800 s/mm2, respectively. The detailed scanning parameters were listed in Table 1. Fractional anisotropy (FA) and apparent diffusion coefficient (ADC) were measured from DTI images. FA is defined as the ratio of the anisotropic component of the diffusion tensor to the whole diffusion tensor and ADC is a measure of the magnitude of diffusion (of water molecules) within tissue. These parameters were processed by using Philips’s workstation (ISP, Philips Healthcare, the Netherlands). Fusion of T2WI-DRIVE-3D and DTI to identify the location of region of interest (ROI) by an experienced radiologist (with 4-year experience). Independent Student's T test or Mann-Whitney U test were used to analyze the difference of FA and ADC parameters among different groups. The ROC curve of the above parameters was calculated to analyze the diagnostic efficiency. P values < 0.05 were considered significant.Results
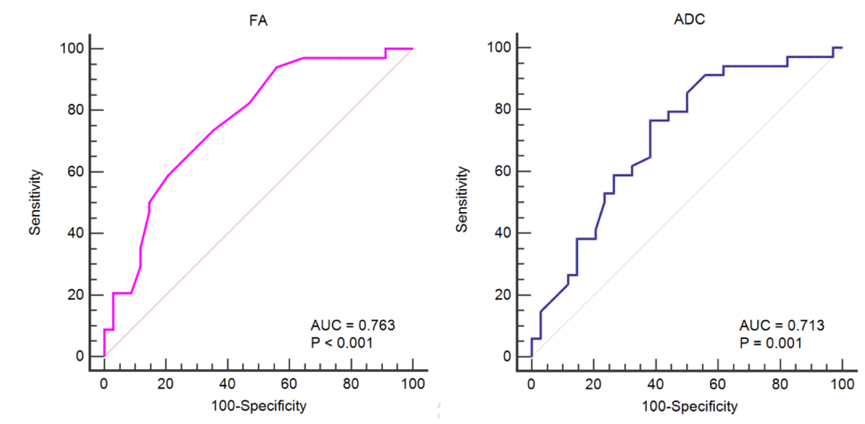
34 pairs of brachial plexus nerves were analyzed from 11 patients with brachial plexus injury (51.12±9.08 years; 81% men). Results revealed that the FA values of patients with brachial plexus injury were lower than that of the control group (0.387±0.105 vs 0.450±0.013; P<.001) (Table 2, Figure 1). The values of ADC were higher when compared with control group (1.188±0.041 vs 1.007±0.417; P=0.003). But there were no significant difference the two groups for complete or postganglionic injury (Table 3). Furthermore, the AUCs of FA and ADC were 0.763 (95% CI:0.644,0.857) and 0.713 (95% CI:0.590,0.816) respectively (Table 4). The sensitivity of FA and ADC were 94.1% and 76.5%, the corresponding specificity were 44.1% and 61.8% respectively as shown in Figure 2.Discussion
The results showed that the FA value decreased and the ADC value increased in brachial plexus injury, but there was no significant difference between postganglionic and complete injury groups. The changes of FA and ADC was consistent with previous study, which applied on lumbar intraspinal stenosis and foraminal Stenosis6. The decrease of FA value may reflect the damage of tissue microstructure and the increase of ADC value can be explained that the injury of brachial plexus will be accompanied by edema, which would lead to a higher degree of movement of water molecules. In addition, the AUC of FA showed the higher value, which means that the application of DTI has important clinical value in the evaluation of brachial plexus injury. It is necessary to explore the correlation between functional parameters and nerve injury index in the future.Conclusion
Patients with brachial plexus injury had higher FA and lower ADC values when compared with the control group, and FA showed the better diagnostic efficiency (AUC:0.763; sensitivity: 94.1%; specificity: 44.1%).Acknowledgements
No acknowledgement.References
1. Kronlage M, Pitarokoili K, Schwarz D, et al. Diffusion Tensor Imaging in Chronic Inflammatory Demyelinating Polyneuropathy: Diagnostic Accuracy and Correlation With Electrophysiology. Invest Radiol. 2017;52(11):701-707.
2. Vargas MI, Gariani J, Delattre BA, Dietemann JL, Lovblad K, Becker M. Three-dimensional MR imaging of the brachial plexus. Semin Musculoskelet Radiol. 2015;19(2):137-148.
3. Oudeman J, Verhamme C, Engbersen MP, et al. Diffusion tensor MRI of the healthy brachial plexus. PLoS One. 2018;13(5):e0196975.
4. Chen YY, Lin XF, Zhang F, et al. Diffusion tensor imaging of symptomatic nerve roots in patients with cervical disc herniation. Acad Radiol. 2014;21(3):338-344.
5. Martín Noguerol T, Barousse R, Socolovsky M, Luna A. Quantitative magnetic resonance (MR) neurography for evaluation of peripheral nerves and plexus injuries. Quant Imaging Med Surg. 2017;7(4):398-421.
6. Eguchi Y, Ohtori S, Suzuki M, et al. Discrimination between Lumbar Intraspinal Stenosis and Foraminal Stenosis using Diffusion Tensor Imaging Parameters: Preliminary Results. Asian Spine J. 2016;10(2):327-334.
Figures


Table 2. Comparison of FA and ADC values between control and injury
Table 3. Comparison of FA and ADC values between postganglionic and complete injury