4527
Rapid High-resolution Quantitative MR Neurography in the Lumbosacral Plexus using Accelerated Quantitative Double Echo Steady-State (qDESS)1Department of Radiological Services, Tokyo Woman's Medical University, Tokyo, Japan, 2Department of Diagnostic imaging & Nuclear Medicine, Tokyo Woman's Medical University, Tokyo, Japan, 3Philips Japan, Tokyo, Japan, 4Philips Healthcare NA, San Francisco, CA, United States
Synopsis
Double Echo Steady-State (DESS) with water-selective excitation is a useful sequence to depict small nerves such as intracranial nerves, it would also be promising for visualizing lumbar nerves. Recently, accelerated qDESS sequence combined with compressed sensing sensitivity encoding (Compressed SENSE) has been proposed for further rapid knee morphological and quantitative imaging. In this study, we evaluate the feasibility of the accelerated qDESS sequence for visualization and quantification of the lumbosacral plexus within a short scan time.
INTRODUCTION
MR neurography facilitates the assessment of peripheral nerve pathologies1-3, and a quantitative evaluation by using T2 values can be clinically useful in estimating treatment effects and determining prognosis as well as diffusion tensor imaging4. SHINKEI-Quant5-7 is one of the useful techniques to add quantitative information to MR neurography based on two-different preparation times of motion-sensitized driven-equilibrium (MSDE)-prepared fat-suppressed 3D T2-weighted turbo spin-echo (TSE)8.9. SHINKEI-Quant can simultaneously provide MR neurography and T2 maps within clinically feasible scan times (around 6 minutes); however, it is still challenging for shortening acquisition time and/or achieving higher spatial resolution because it basically requires doubled 3D TSE acquisition with different MSDE prep-TE images for T2 quantification. Double Echo Steady-State (DESS) with water-selective excitation is a useful sequence to depict small nerves such as intracranial nerves10,11, it would also be promising for visualizing lumbar nerves. Furthermore, 3D quantitative DESS (qDESS) offers a rapid simultaneous 3D morphometry and T2 relaxometry12-14. Recently, accelerated qDESS sequence combined with compressed sensing sensitivity encoding (Compressed SENSE) has been proposed for further rapid knee morphological and quantitative imaging15. In this study, we evaluate the feasibility of the accelerated qDESS sequence for visualization and quantification of the lumbosacral plexus within a short scan time.METHODS
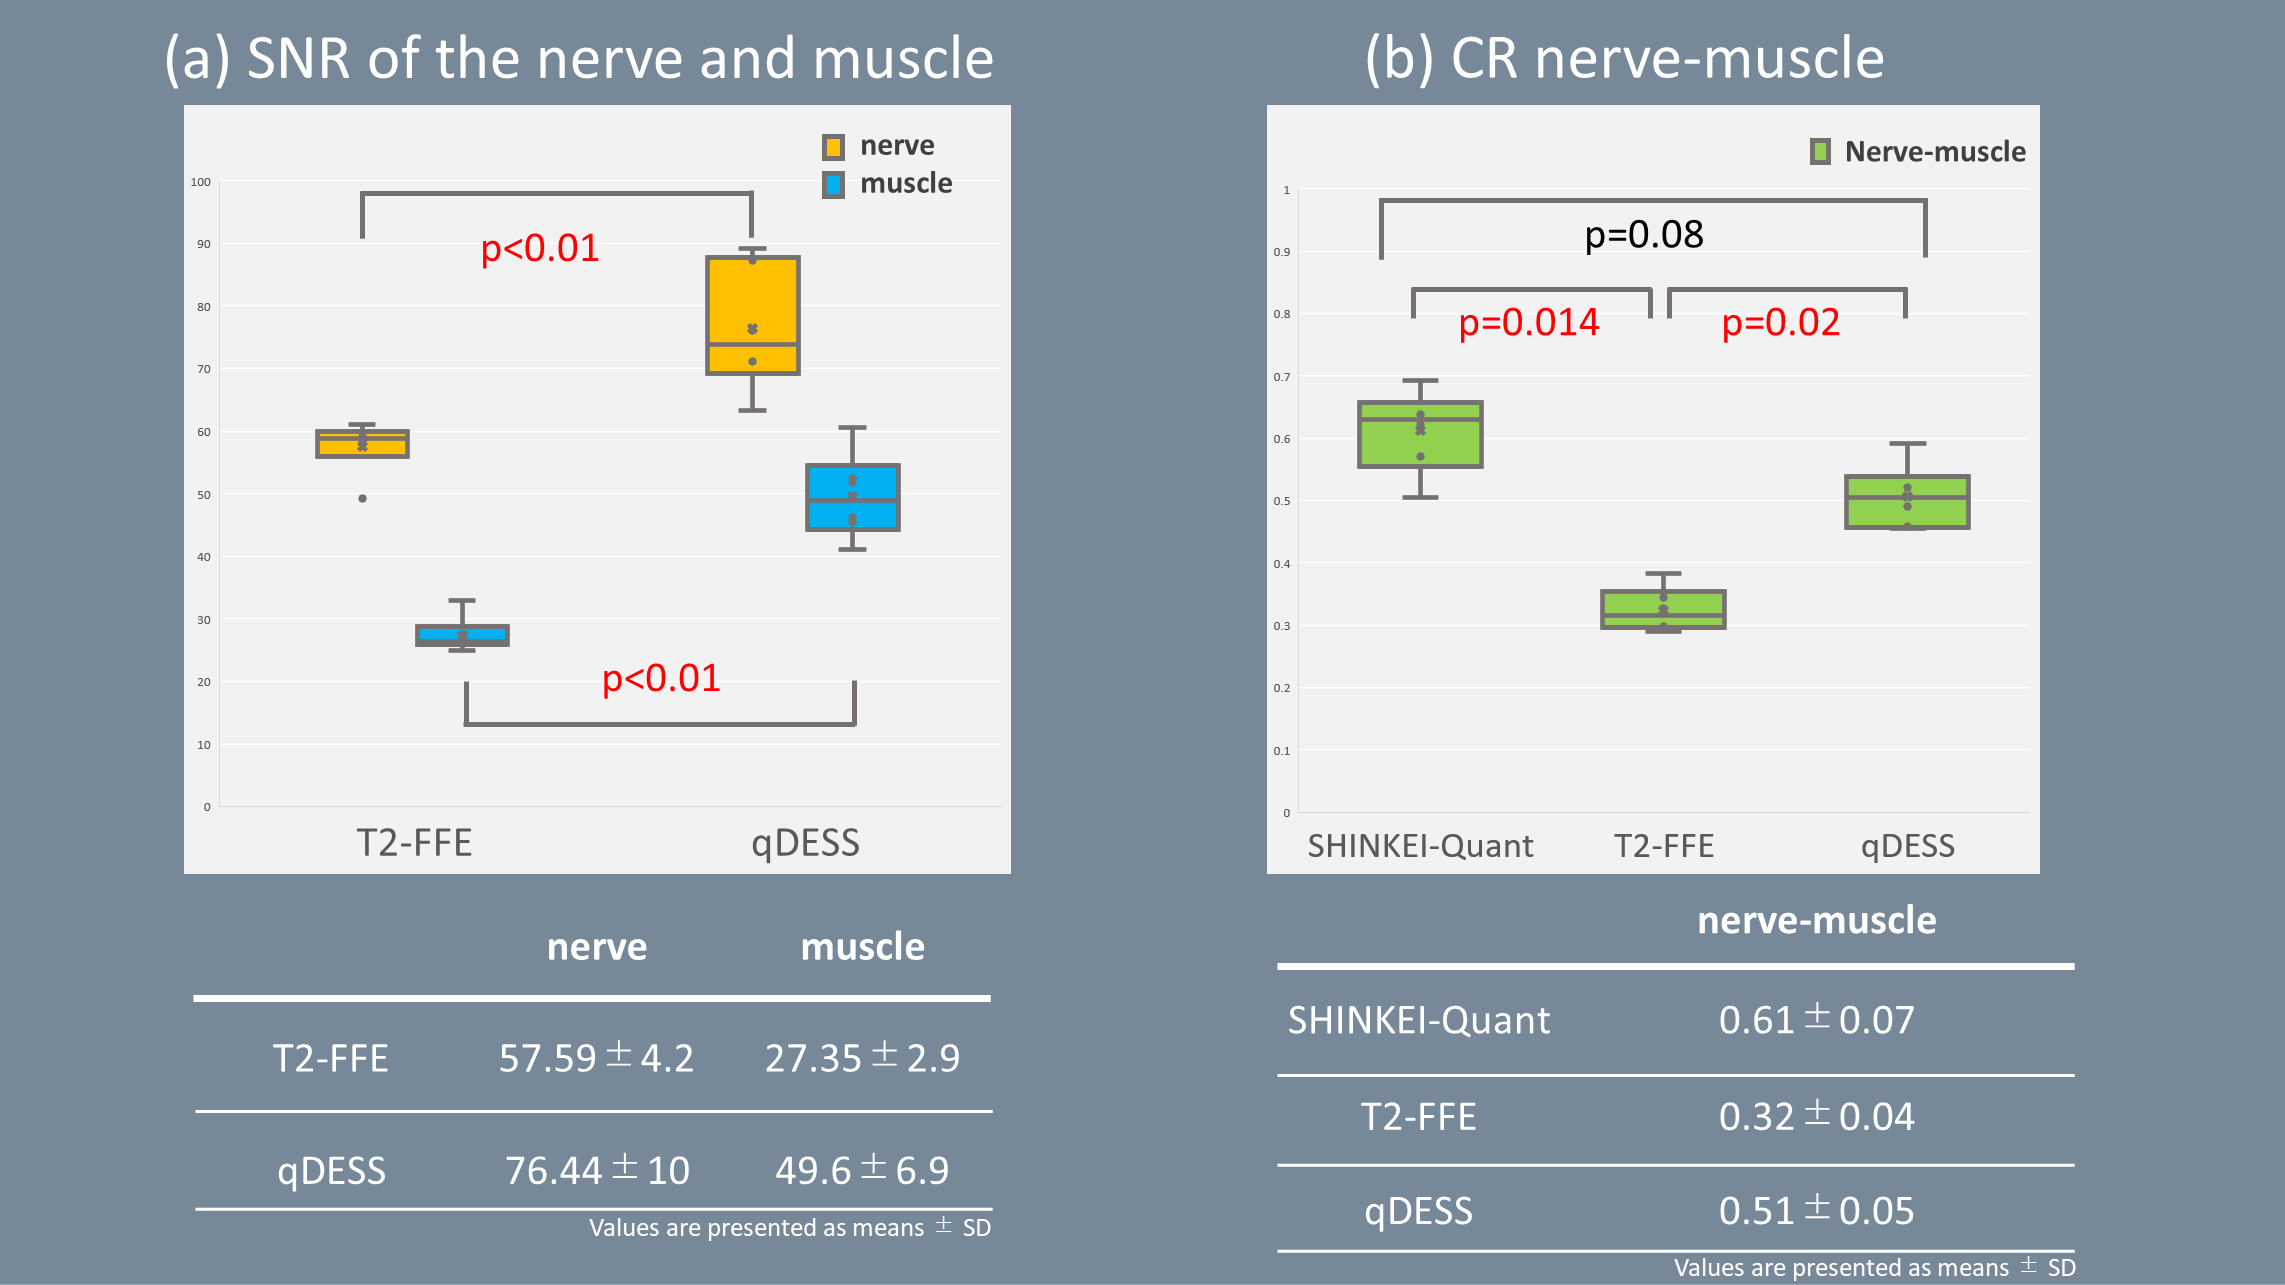
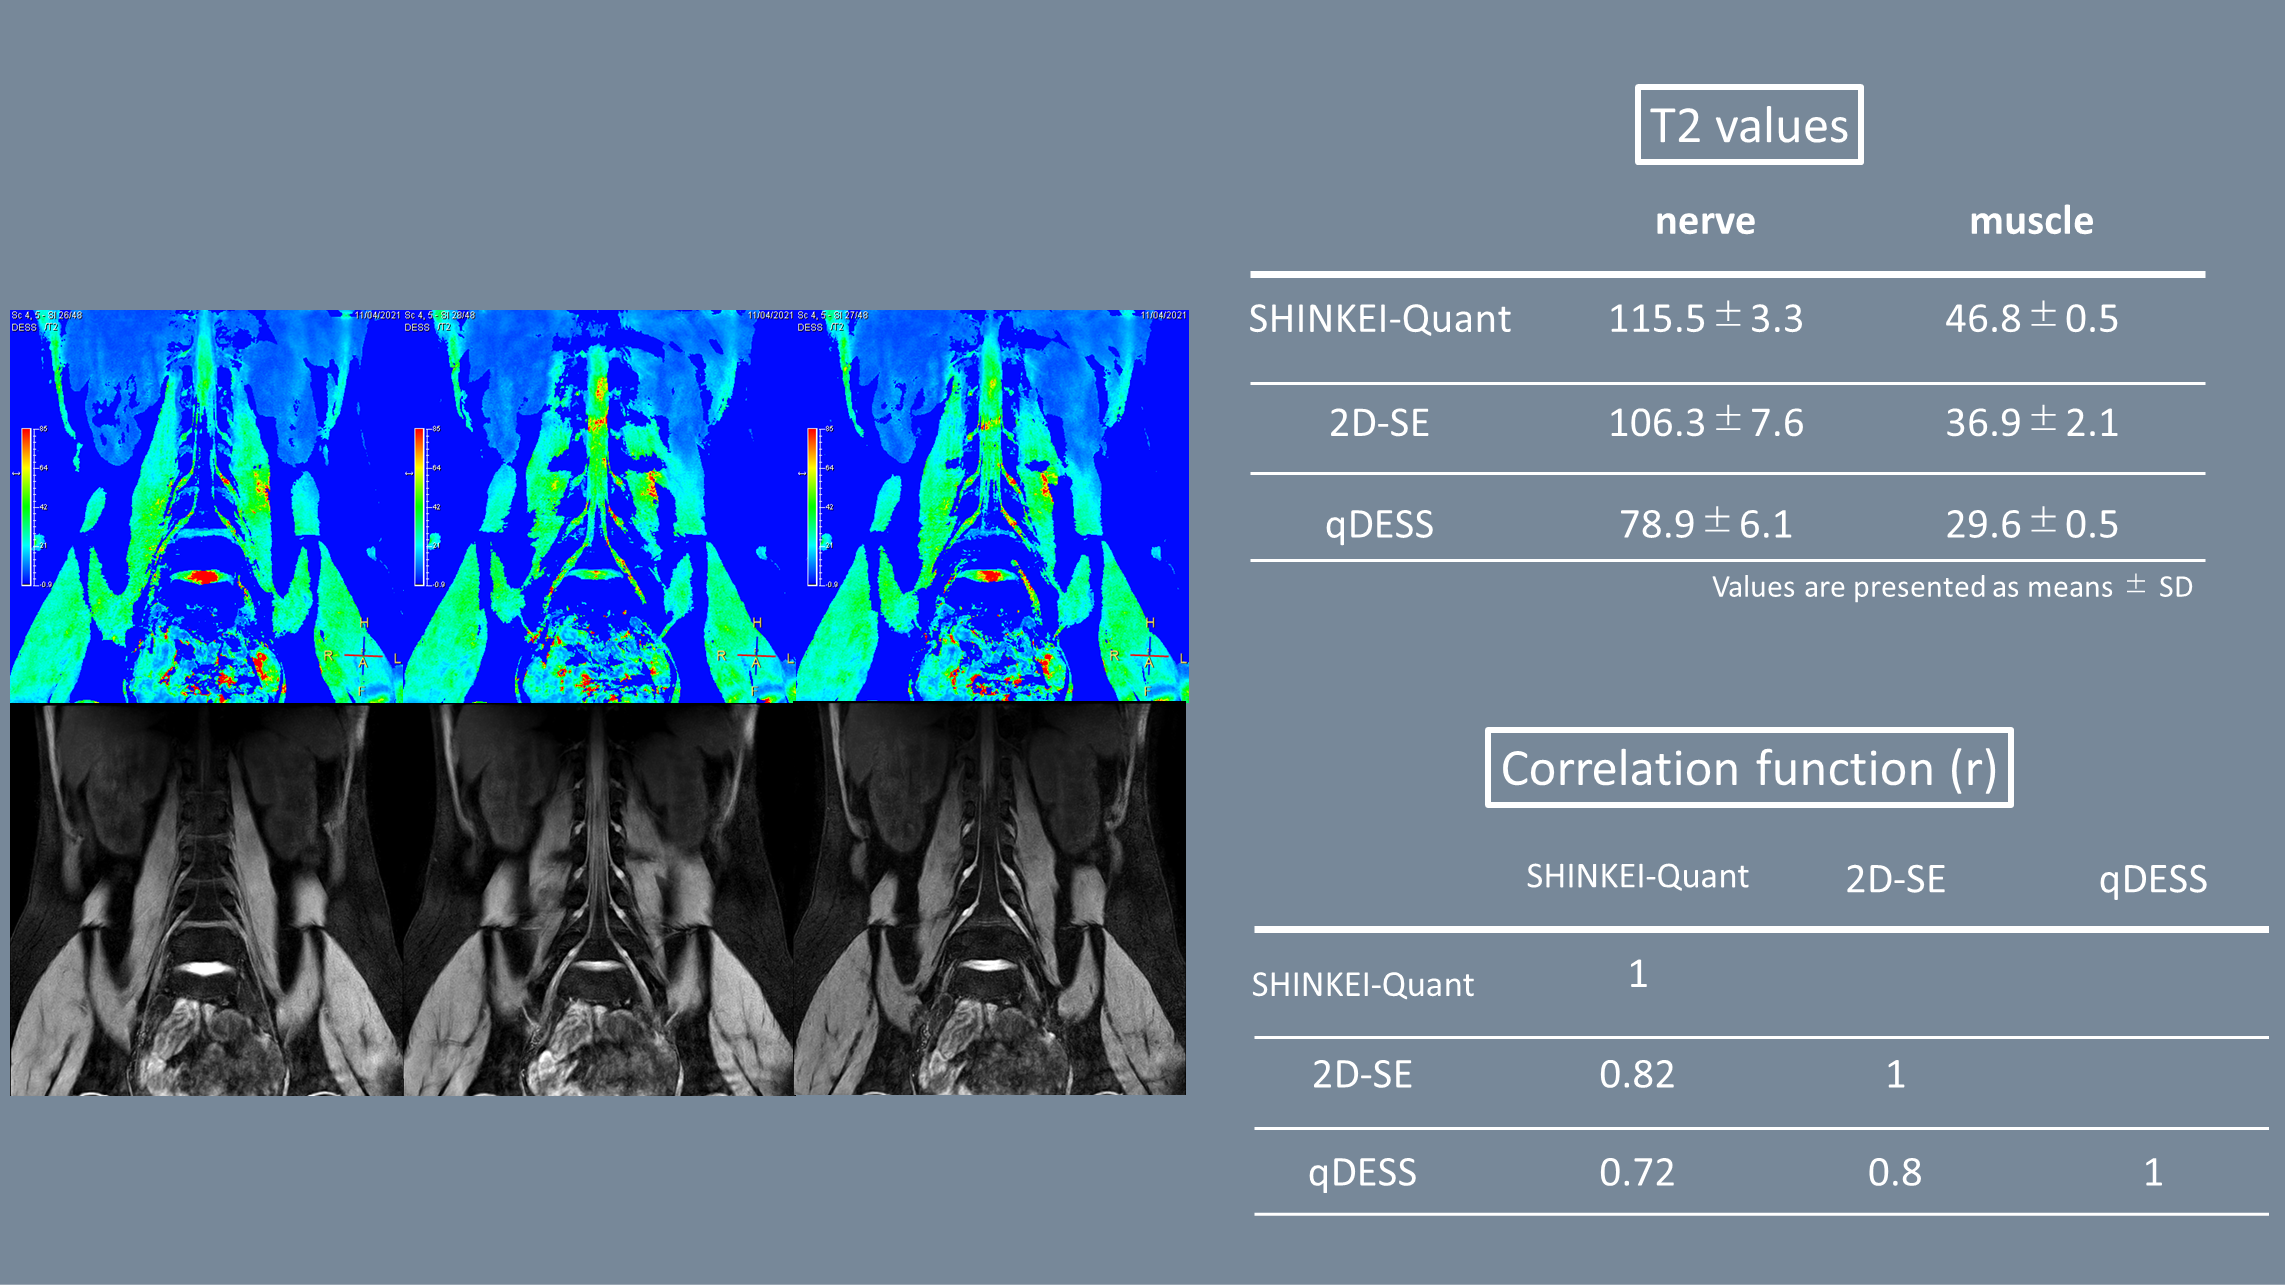
A total of six volunteers and one patient were examined on a 3.0T system (Ingenia, Philips Healthcare). The study was approved by the local IRB, and written informed consent was obtained from all subjects. qDESS sequence provides two different TE images. We used the weighted-addition images of both TEs as the MR neurography, and T2 quantification was performed by inverting the qDESS signal model14 (Figure 1). To validate both the neurography images and the T2 maps obtained by qDESS, coronal lumbosacral plexus images were acquired and were quantitatively compared with conventional methods. Neurography images were compared with water-selective excited T2FFE-based neurogpraphy16,17 and SHINKEI-Quant for image quality. We measured the SNR of the nerves (average value of both the left and right dorsal root ganglion from L4 to S1) and iliopsoas muscle using dynamic noise scan method, and the contrast ratio (CR) between the nerve and the iliopsoas muscle. SNRnerve, SNRmuscle and CRnerve-muscle were then calculated as follows: SNRnerve = SI nerve / SDnoise nerve, SNRmuscle= SI muscle / SDnoise muscle, CRnerve-muscle = [SI nerve – SI muscle] / [SI nerve + SI muscle] where SI nerve and SI muscle are the mean average signal intensity of the nerves and muscles respectively, and the corresponding SDnoise is the standard deviation at the same location on the noise images. Subsequently, the T2 maps were assessed for accuracy by comparing with a 2D multi-echo spin-echo (2D-SE) T2 mapping and SHINKEI-Quant. We measured the T2 value of the nerves and iliopsoas muscles, respectively. The SNR, CR and T2 values were assessed by using one-way repeated measures ANOVA, Wilcoxon signed-rank test and Steel-Dwass test. Imaging parameters for respective sequences are as follows. qDESS: FFE, FOV=300*300mm, voxel size=0.8*0.8*2mm3, slice thickness=-1mm, flip angle=25, TR=16ms, TE=4.9ms, ProSet water excitation 1331, NSA=1, CS-SENSE=2.5 and acquisition time=3min4s. T2-FFE: FFE, FOV=300*300mm, voxel size=0.8*0.8*2mm3, slice thickness=-1mm, flip angle=35, TR=9.9ms, TE=5.0ms, ProSet water excitation 1331, NSA=1, CS-SENSE=1.6 and acquisition time=3min1s. SHINKEI-Quant: TSE, FOV=300*380mm, voxel size=1.3*1.3*4mm3, slice thickness=-2mm, flip angle=90, TR=3919ms, TE=97ms, TSE factor 90, SPAIR inversion delay was 240ms, NSA=2, CS-SENSE=4 and acquisition time=9m32s. 2D-SE: GraSE, FOV=300*300mm, voxel size=0.9*1.1*3mm, slice thickness=0mm, flip angle=90, TR=1846ms, TE=20ms*5, TSE factor 5, EPI factor 5, SPIR strong, NSA=1, CS-SENSE=1.5 and acquisition time=4min37s.RESULTS & DISCUSSION
Figure 2 (a) shows the representative MR neurography images using qDESS, SHINKEI-Quant and T2-FFE, and (b) shows representative T2 map images using 2D-SE, qDESS and SHINKEI-Quant. Figure 3 (a) shows the SNR (of the nerve and iliopsoas muscle) comparison of qDESS and T2-FFE. qDESS showed significantly higher SNR in both nerve and iliopsoas muscle compared to T2-FFE. Figure 3 (b) shows the CRnerve-muscle among three sequences. In CRnerve-muscle, SHINKEI-Quant showed the highest value, but there was no significant difference in comparison with qDESS. Figure 4 shows the comparison of T2 values among SHINKEI-Quant, conventional 2D-SE T2 mapping and qDESS. The T2 values obtained with qDESS in each tissue indicated slightly shorter T2 value compared to those from conventional T2 mapping. Nevertheless, the T2 value of nerves measured in qDESS correlated with the one measured in conventional T2 mapping (r=0.8, p=0.016). Thus, the T2 values measured in qDESS may have same trends with one measured in conventional T2 mapping. Figure 5 shows the results of initial clinical evaluation. In a patient with nerve compression by lumbar disc herniation, T2 value of nerves indicated longer value compared with that of uncompressed nerves.CONCLUSION
Accelerated qDESS simultaneously provides high-resolution MR neurography with high SNR and CR and T2 maps with T2 values similar to conventional methods with 3 minutes. This sequence may be helpful to quantitatively assess nerve pathology.Acknowledgements
No acknowledgement found.References
1. Filler AG, et al. Application of Magnetic Resonance Neurography in the Evaluation of Patients with Peripheral Nerve Pathology. J Neurosurg. 1996;85:299-309. 2. Chhabra A, et al. High-Resolution 3T MR Neurography of the Brachial Plexus and Its Branches, with Emphasis on 3D Imaging. AJNR Am J Neuroradiol 2013;34:486–97 3. Vargas MI, et al. Three-Dimensional MR Imaging of the Brachial Plexus. Semin Musculoskelet Radiol. 2015;19:137-48. 4. Karampinos DC, et al. Diffusion Tensor Imaging and T2 Relaxometry of Bilateral Lumbar Nerve Roots: Feasibility of In-plane Iimaging. NMR Biomed. 2013;26:630–637. 5. Yoneyama M, et al. SHINKEI Quant: Simultaneous Acquisition of MR Neurography and T2 Mapping for Quantitative Evaluation of Chronic Inflammatory Demyelinating Polyneuropathy. Proc Intl Soc Mag Reson Med. 2016;24:1322. 6. Hiwatashi A, et al. Evaluation of Chronic Inflammatory Demyelinating Polyneuropathy: New Simultaneous T2 mapping and neurography method with 3D Nerve-Sheath Signal Increased with Inked Rest-Tissue Rapid Acquisition of Relaxation Enhancement Imaging (SHINKEI Quant). Proc Intl Soc Mag Reson Med. 2016;24:2261. 7. Yoneyama M, et al. Quantitative MR Neurography with Robust Fat Suppression. Proc Intl Soc Mag Reson Med. 2018;26:5400. 8. Yoneyama M, et al. Rapid high resolution MR neurography with a diffusion-weighted pre-pulse. Magn Reson Med Sci. 2013;12:111-9. 9. Kasper JM, et al. SHINKEI-a novel 3D isotropic MR neurography technique: technical advantages over 3DIRTSE-based imaging. Eur Radiol. 2015;25:1672-7. 10. Qin Y, et al. 3D double-echo steady-state with water excitation MR imaging of the intraparotid facial nerve at 1.5T: a pilot study. AJNR Am J Neuroradiol. 2011 Aug;32(7):1167-72. doi: 10.3174/ajnr.A2480. 11. Fujii H, et al. Visualization of the Peripheral Branches of the Mandibular Division of the Trigeminal Nerve on 3D Double-Echo Steady-State with Water Excitation Sequence. AJNR Am J Neuroradiol. 2015 Jul;36(7):1333-7. doi: 10.3174/ajnr.A4288. 12 Chaudhari AS. et al. Combined 5-minute double-echo in steady-state with separated echoes and 2-minute proton-density-weighted 2D FSE sequence for comprehensive whole-joint knee MRI assessment. J Magn Reson Imag. 2019;49(7): e183-e194. 13. Lu Q, et al. Knee T2 relaxometry using quantitative DESS: reproducibility across imaging vendors. Proc. ISMRM:2019.4473. 14. Sveinsson B, et al. A simple analytic method for estimating T2 in the knee from DESS. Magn Reson Imaging. 2016;38:63-70. 15. Lu Q, et al. Application of Compressed Sensing to Quantitative Double Echo steady state (qDESS) for Rapid T2 Relaxometry in Knees. Proc. ISMRM:2020.2733. 16. Philippens ME, et al. Tracing the cranial nerve pathways nV and nVII with 3D T2-FFE. Proc. ISMRM:2012.1059. 17. Crijns S, et al. MR neurography using a 3D T2-FFE sequence with binomial RF-pulse selective excitation. Proc. ISMRM:2012.1060. 18. Zwanenburg et al. MR Angiography of the cerebral perforating arteries with magnetization prepared anatomical reference at 7T: comparison with time-of-flight. J Magn Reson Imaging. 2008; 28: 1519–1526Figures

Figure1. Scheme of qDESS sequence.qDESS sequence enables rapid simultaneous 3D morphometry and T2 relaxometry from two different TE images. We used the weighted-addition images of both TEs as the MR neurography, and T2 quantification was performed by inverting the qDESS signal model.