4526
Reduced GABA levels in the medial prefrontal cortex are associated with cognitive impairment in patients with NMOSD1The First Affiliated Hospital of Soochow University, Suzhou, China, 2Philips Healthcare, Shanghai, China
Synopsis
Cognitive impairment is a symptom present in part of patients with neuromyelitis optica spectrum disorder (NMOSD). We demonstrated decreased GABA levels in the medial prefrontal cortex (mPFC) in NMOSD participants compared to healthy controls. The mPFC GABA levels showed significant associations with cognitive performance in patients with NMOSD. This study suggested that the changes in regional GABA levels might be a potential metabolic feature of cognitive decline in patients with NMOSD.
Introduction
Cognitive impairment is a symptom that affects 29%–67% of patients with neuromyelitis optica spectrum disorder (NMOSD) and exerts a significant impact on patient’s quality of life1. Dysfunction of the GABAergic/glutamatergic pathways involving inhibitory and excitatory neurotransmitters has been implicated in several neurological disorders2, 3. Previous studies have demonstrated the disruption of glutamate homeostasis in the pathogenesis of NMOSD4. A few studies have revealed metabolic changes in NMOSD by magnetic resonance spectroscopy (MRS) imaging5, 6. However, the changes in inhibitory and excitatory neurotransmitters in NMOSD are currently not fully known. This study aimed to investigate the changes in inhibitory gamma-aminobutyric acid (GABA) and excitatory glutamate and glutamine (Glx) neurotransmitter levels and their correlations with cognitive functions in patients with NMOSD.Methods
Subjects: A total of 29 NMOSD patients and 28 sex-, age-, and education-matched healthy controls (HCs) were included and underwent clinical and cognitive assessments.Acquisition Protocol: All MRI examinations were performed on a 3.0T MRI scanner (Philips Ingenia, Philips Healthcare, Best, The Netherlands). Three-dimensional T1-weighted turbo field echo sequence (repetition time/echo time [TR/TE] = 7.0/3.1 ms; slice thickness = 1 mm; field of view = 256 × 256 × 185 mm3; flip angle = 8°; voxel size = 1 × 1 × 1 mm3) was used for voxel localization and brain tissue segmentation. Meshcher-Garwood point-resolved spectroscopy (MEGA-PRESS) sequence (TR/TE = 2000/68 ms; 14 msec editing pulses applied at 1.89 ppm [Edit-on] and 7.46 ppm [Edit-off]; 320 averages; data points = 2048; spectral width = 2 kHz; and VAPOR [Variable Power and Optimized Relaxations delays] water suppression) was applied to measure GABA and Glx levels in the medial prefrontal cortex (mPFC) and left thalamus, with voxel sizes of 24 × 30 × 26 mm3 and 30 × 30 × 25 mm3, respectively (Figure 1).
Data Processing: MRS data were analyzed using Gannet 3.0 toolkit to evaluate GABA+ and Glx levels. The analysis included spectral registration for frequency and phase correction of the individual transients, automated rejection of outlier, Fourier transformation and 3 Hz exponential line broadening7. Gannet used Gaussian models to fit the 3.02 ppm GABA peak and the 3.74 ppm Glx peak and a Lorentzian model to fit the 3.0 ppm Cr signal from the off spectrum. The quantitative results were presented as GABA+/tCr and Glx/tCr integral ratios.
Analysis: The GABA+ and Glx fitting errors from Gannet were used to assess the spectral quality. Only individual metabolic peak with a fitting error of below 15% was used for further statistical analysis. The GABA and Glx levels in the patient group were compared with those in HCs and correlated with cognitive scores and clinical variables. Statistical analyses were performed using SPSS version 26.0.
Results
Patients with NMOSD showed worse performance on information processing speed measured by the Symbol Digit Modalities Test, attention tested by the Trail-making test part A, and overall cognition evaluated by the mean of all individual cognitive test scores. NMOSD patients showed lower GABA+/tCr levels in the mPFC compared with HCs (P = 0.028; Figure 2). The GABA+/tCr levels in the mPFC were significantly positively associated with verbal memory performance measured by the Auditory Verbal Learning Test (r = 0.462, P = 0.027) and overall cognition (r = 0.440, P = 0.035) in the NMOSD group (Figure 3). The GABA+/tCr levels in the left thalamus or Glx/tCr levels in both regions were not significantly different between groups, nor were they related to any cognitive domain in NMOSD patients (all P values > 0.05; Figure 2).Discussion
The decreased GABA+ levels observed in NMOSD might reflect the loss or dysfunction of GABAergic neurons, which is partly due to the axonal degeneration following acute optic neuritis and myelitis or may be a direct consequence of the destruction of astrocytes8. In addition, astrocytic damage occurring in NMOSD may result in the dysregulation of GABA levels9. The positive association between mPFC GABA+ levels and cognitive performance supports the involvement of GABAergic neurotransmission in cognitive function. The regional decrease of GABA+ might reflect regional differences in neuronal loss in NMOSD and changes in GABA+ concentration might occur as a result of brain plasticity.Conclusion
The GABA+ levels in the mPFC decreased and correlated with cognitive dysfunction in patients with NMOSD, suggesting that the changes in regional GABA+ levels might be a potential metabolic feature of cognitive decline in patients with NMOSD.Acknowledgements
This work was supported by the program for Gusu Medical Talent of Suzhou City [GSWS2020009, GSWS2020019]; the Translational Research Grant of NCRCH [2020WSB06]; the National Natural Science Foundation of China [81671743, 81971573]; the Clinical Key Diseases Diagnosis and Therapy Special Project of Health and Family Planning Commission of Suzhou [LCZX201801]; the program for Advanced Talents within Six Industries of Jiangsu Province [grant number WSW-057]; and the High-level Health Personnel ‘six-one’ Project of Jiangsu Province in China [LGY2016035].
References
1. Czarnecka D, Oset M, Karlinska I, Stasiolek M. Cognitive impairment in NMOSD-More questions than answers. Brain Behav. 2020;10(11):e01842.
2. Song XM, Hu XW, Li Z, et al. Reduction of higher-order occipital GABA and impaired visual perception in acute major depressive disorder [published online ahead of print, 2021 Apr 16]. Mol Psychiatry. 2021;10.1038/s41380-021-01090-5.
3. Bojesen KB, Broberg BV, Fagerlund B, et al. Associations Between Cognitive Function and Levels of Glutamatergic Metabolites and Gamma-Aminobutyric Acid in Antipsychotic-Naïve Patients With Schizophrenia or Psychosis. Biol Psychiatry. 2021;89(3):278-287.
4. Yick LW, Tang CH, Ma OK, Kwan JS, Chan KH. Memantine ameliorates motor impairments and pathologies in a mouse model of neuromyelitis optica spectrum disorders. J Neuroinflammation. 2020;17(1):236.
5. Tackley G, Kong Y, Minne R, et al. An In-vivo 1H-MRS short-echo time technique at 7T: Quantification of metabolites in chronic multiple sclerosis and neuromyelitis optica brain lesions and normal appearing brain tissue. NeuroImage. 2021;238:118225.
6. Duan Y, Liu Z, Liu Y, et al. Metabolic changes in normal-appearing white matter in patients with neuromyelitis optica and multiple sclerosis: a comparative magnetic resonance spectroscopy study. Acta Radiol. 2017;58(9):1132-1137.
7. Edden RA, Puts NA, Harris AD, Barker PB, Evans CJ. Gannet: A batch-processing tool for the quantitative analysis of gamma-aminobutyric acid-edited MR spectroscopy spectra. J Magn Reson Imaging. 2014;40(6):1445-1452.
8. Kawachi I, Lassmann H. Neurodegeneration in multiple sclerosis and neuromyelitis optica. Journal of neurology, neurosurgery, and psychiatry. 2017;88(2):137-145.
9. Dossi E, Vasile F, Rouach N. Human astrocytes in the diseased brain. Brain research bulletin. 2018;136:139-156.
Figures

Figure 1: Voxel location and sample spectral fitting using MEGA-PRESS. T1-weighted images show the location and size of the VOIs in the mPFC (a1/a2/a3) and left thalamus (b1/b2/b3). Representative GABA+ and Glx MR spectra are shown from mPFC (a4) and left thalamus (b4) with the Gannet models (red lines). (c) The GABA and Glx peaks resonate at 3.02 and 3.74 ppm, respectively.
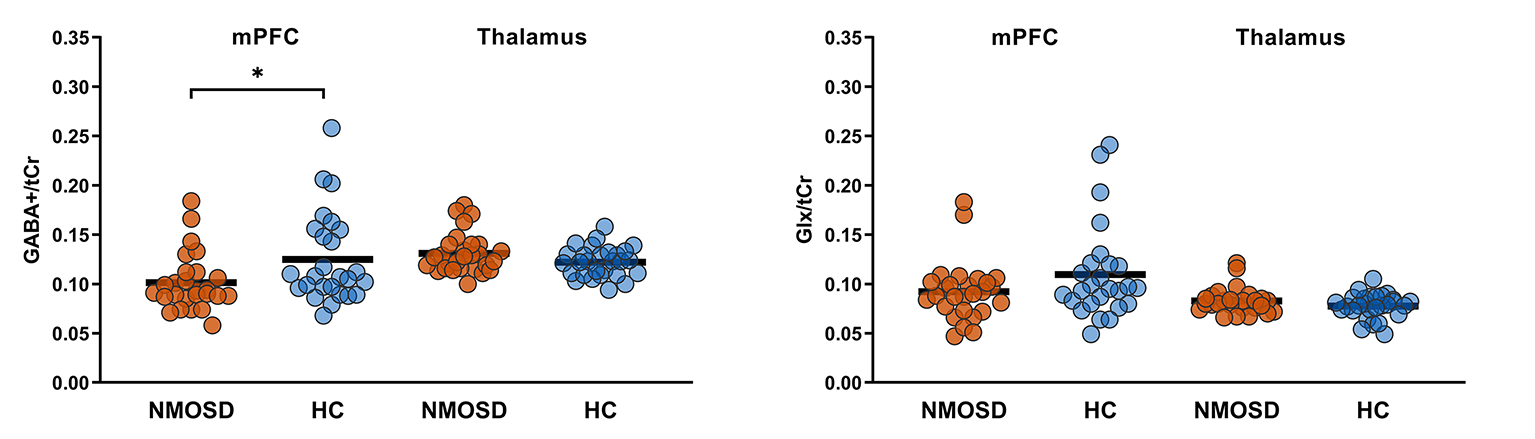
Figure 2: Results of the MRS analysis. The figure shows the GABA+/tCr levels (left) and Glx/tCr levels (right) in the mPFC and left thalamus of patients with NMOSD and HCs. Only GABA+/tCr levels in the mPFC were significantly different between groups. *P = 0.028. GABA+ = GABA plus co-edited macromolecules; tCr = total creatine; Glx = glutamate plus glutamine; NMOSD = neuromyelitis optica spectrum disorder; HC = healthy control; mPFC = medial prefrontal cortex.
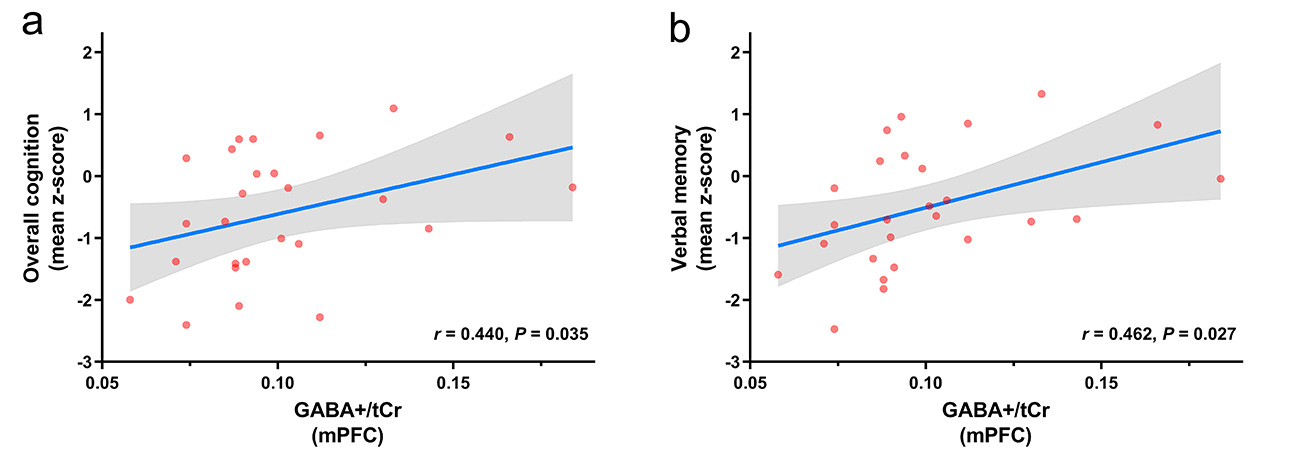
Figure 3: Correlations between GABA+/tCr levels in the mPFC and cognitive function in the NMOSD group. The NMOSD group showed statistically significant positive correlations between mPFC GABA+/tCr levels and mean z-score of overall cognition (a) and verbal memory (b). GABA+ = GABA plus co-edited macromolecules; tCr = total creatine; mPFC = medial prefrontal cortex.