4518
Study of Neurometabolic Signature in Alzheimer’s Disease using High-Resolution 3D 1H-MRSI1School of Biomedical Engineering, Shanghai Jiao Tong University, Shanghai, China, 2Department of Nuclear Medicine, Ruijin Hospital, Shanghai Jiao Tong University School of Medicine, Shanghai, China, 3Beckman Institute for Advanced Science and Technology, University of Illinois at Urbana-Champaign, Urbana, IL, United States, 4Department of Electrical and Computer Engineering, University of Illinois at Urbana-Champaign, Urbana, IL, United States, 5Department of Neurology and Institute of Neurology, Ruijin Hospital, Shanghai Jiao Tong University School of Medicine, Shanghai, China
Synopsis
Early and accurate diagnosis of AD is clinically important. Neurometabolic signals measured noninvasively by MRSI showed potential. Previous MRSI studies, limited to single voxel/slice techniques, could only examine neurometabolite concentration from limited brain regions. Using a high-resolution 3D MRSI technique, we assessed neurometabolic signature in AD by integrating neurometabolite concentrations from multiple brain regions. The discriminative power of global neurometabolic signature was evaluated in comparison with that of Aβ PET for both AD detection and predicting cognitive decline, showing promising results. The study provides a good foundation for further investigation using neurometabolic signature for early and accurate diagnosis of AD.
Introduction
Early and accurate diagnosis of Alzheimer’s diseases (AD) is clinically important but remains challenging. Amyloid-β (Aβ) PET showed great promise in AD diagnosis for its high sensitivity and specificity, but with limited clinical access. MRSI allows for noninvasive mapping of various neurometabolites, which have shown potential for AD diagnosis1,2. Previous MRSI studies demonstrated that N-acetylaspartate (NAA) reduction and myoinositol (mI) increase were associated with AD pathologies such as tau and Aβ burdens3 and improved the accuracy of AD detection compared to hippocampal volume4,5. However, most studies were conducted using single voxel/slice techniques and could not well capture the spatial distributions of neurometabolic changes. In this study, utilizing a recently developed high-resolution 3D 1H-MRSI technique known as SPICE (SPectroscopic Imaging by exploiting spatiospectral CorrElation)6-9, we assessed the neurometabolic signature in AD by integrating the neurometabolite concentrations from multiple regions of the brain. Using a hybrid PET-MR scanner, alterations in Αβ deposition in the same AD patients were measured. The neurometabolic signature measured by 3D MRSI was evaluated in comparison with Αβ PET.Methods
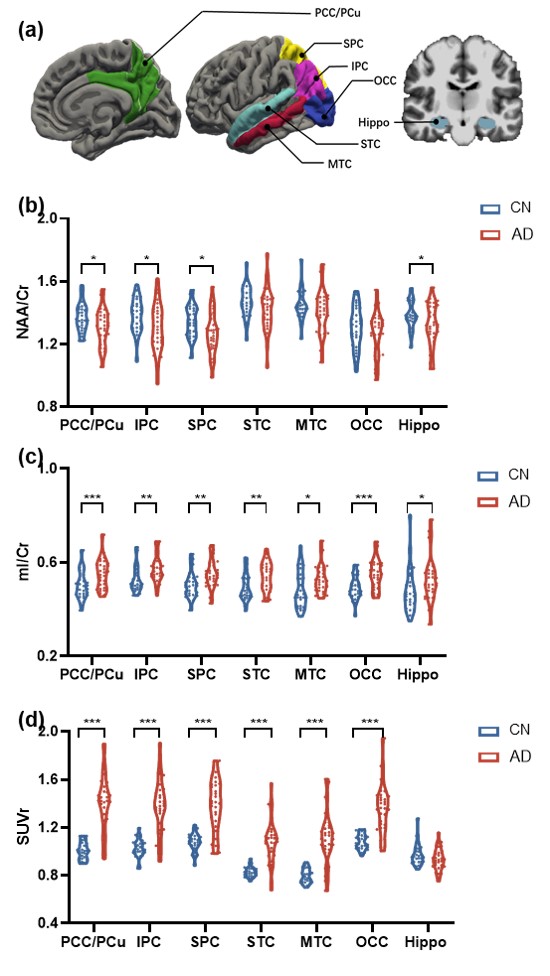
Twenty-eight cognitive normal (CN) and 30 AD subjects participated in this study. Cognitive performance was assessed by Mini-Mental State Exam (MMSE). Aβ PET and MR images were obtained from a hybrid PET/MR system (Biograph mMR, Siemens, Germany) in Ruijin Hospital, Shanghai, China. The PET scan took place 45~60 minutes postinjection of 18F-florbetapir at 3.7 MBq/kg (voxel size = 2.1×2.1×2.0 mm3, 127 slices). After attenuation correction and reconstruction, Aβ deposition was quantified by a standard uptake value ratio (SUVR) map with the whole cerebellum as the reference region. The MRI scan included 3D MPRAGE sequence (voxel size = 0.5×0.5×1.0 mm3, FOV = 256×256×192 mm3, TR/TE = 1900/2.44 ms) and 3D MRSI acquired by the SPICE sequence (voxel size = 2.0×3.0×3.0 mm3, FOV = 240×240×72 mm3, TR/TE = 160/1.6 ms, scan time = 8 minutes). Structural MR images were transformed into 1 mm isotropic native space, intensity normalized, skull stripped, followed by subcortical and cortical labelling using probabilistic subcortical and Desikan-Killiany altas10. For neurometabolites mapping, a union-of-subspaces model incorporating pre-learned spectral basis functions was applied for reconstruction of the spatiospectral functions of metabolites6,7. Spectral quantification was performed using an improved LCmodel-based algorithm that incorporated both spatial and spectral priors8,9. All PET and MR images were coregistered. Seven regions of interest (ROIs) were selected from the Desikan-Killiany altas, based on signal coverage and key findings in previous MRS literature11-13, including posterior cingulate gyrus/precuneus (PCC/PCu), inferior parietal cortex (IPC), superior parietal cortex (SPC), superior temporal cortex (STC), middle temporal cortex (MTC), occipital cortex (OCC), and hippocampus (Hippo).Demographic and clinical data were compared between the CN and AD groups using chi-square tests for categorical variables and two-sample t tests with post-hoc Bonferroni comparisons for continuous variables. Group differences in NAA/Cr and mI/Cr were compared using one-way analysis of covariance (ANVOCA) in each ROI, with age, sex, and education as covariates. Associations between the neurometabolites and Aβ were explored using linear mixed effect modeling. Using receiver-operating-characteristic (ROC) curve analysis and multivariate linear regression model, the accuracies of global MRSI (i.e., combining the NAA/Cr and mI/Cr signals collected in all seven ROIs) in the classification and cognitive prediction of AD patients were assessed. The results were compared with using neurometabolites from PCC/PCu alone, and with the Aβ composite from all seven ROIs. For all statistical analyses, p < 0.05 was considered statistically significant.
Results and discussion
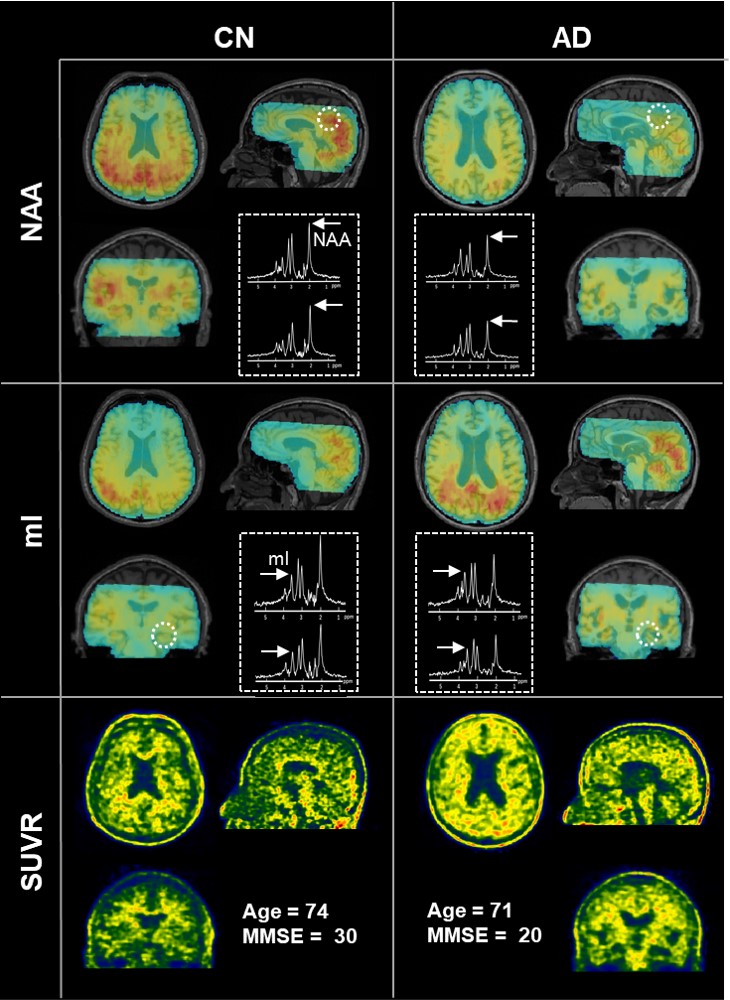
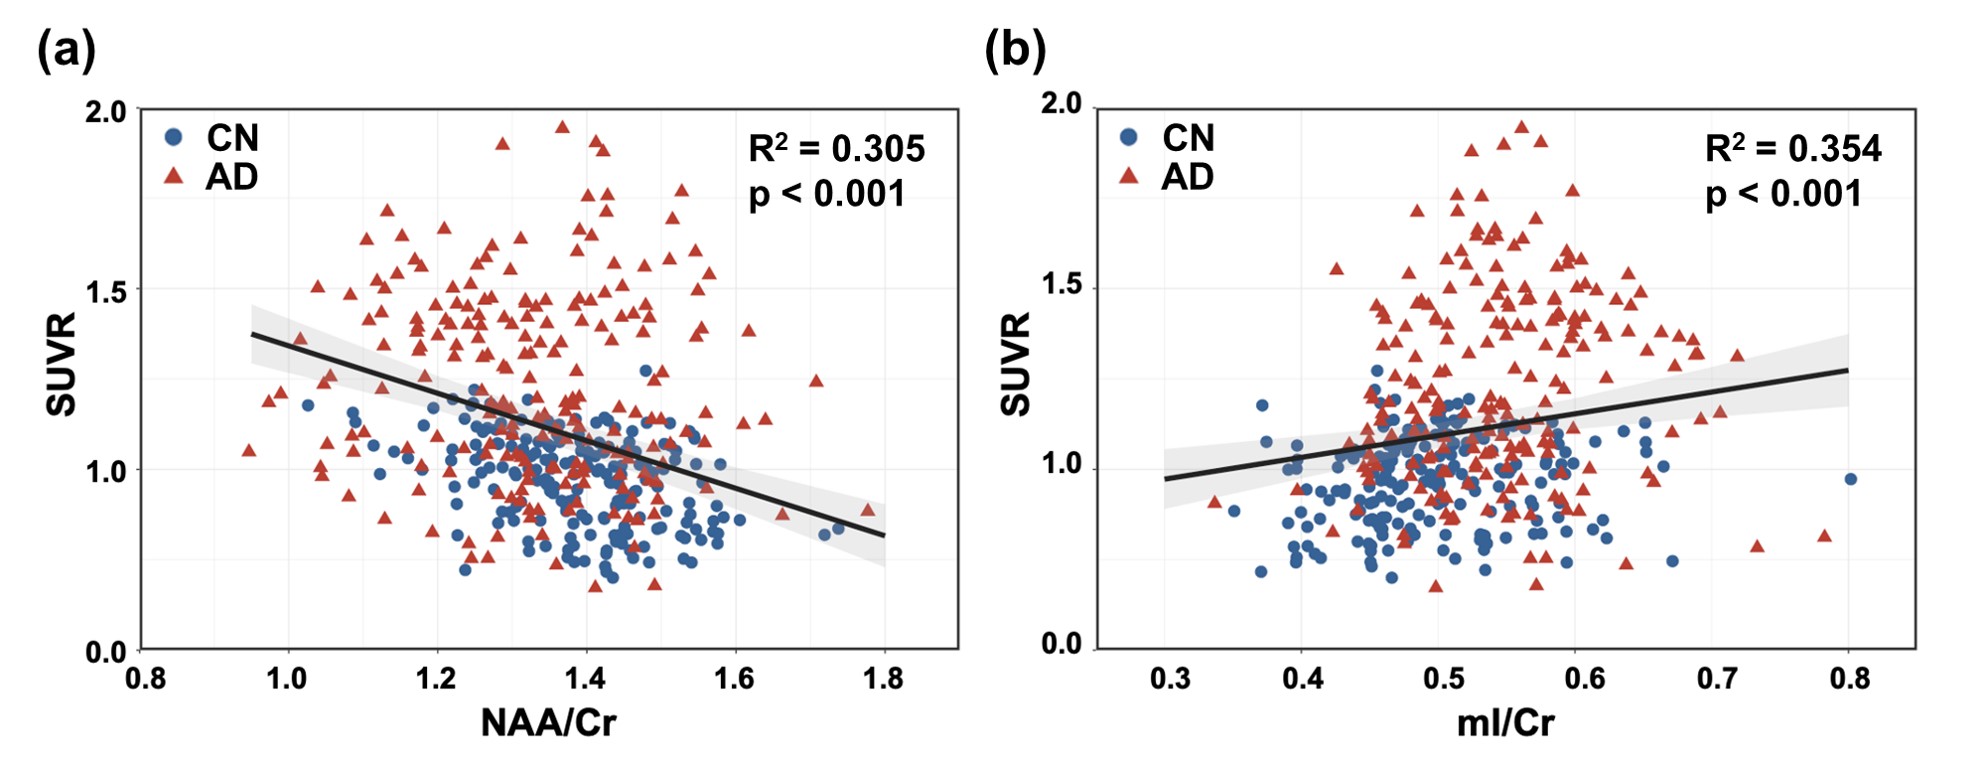
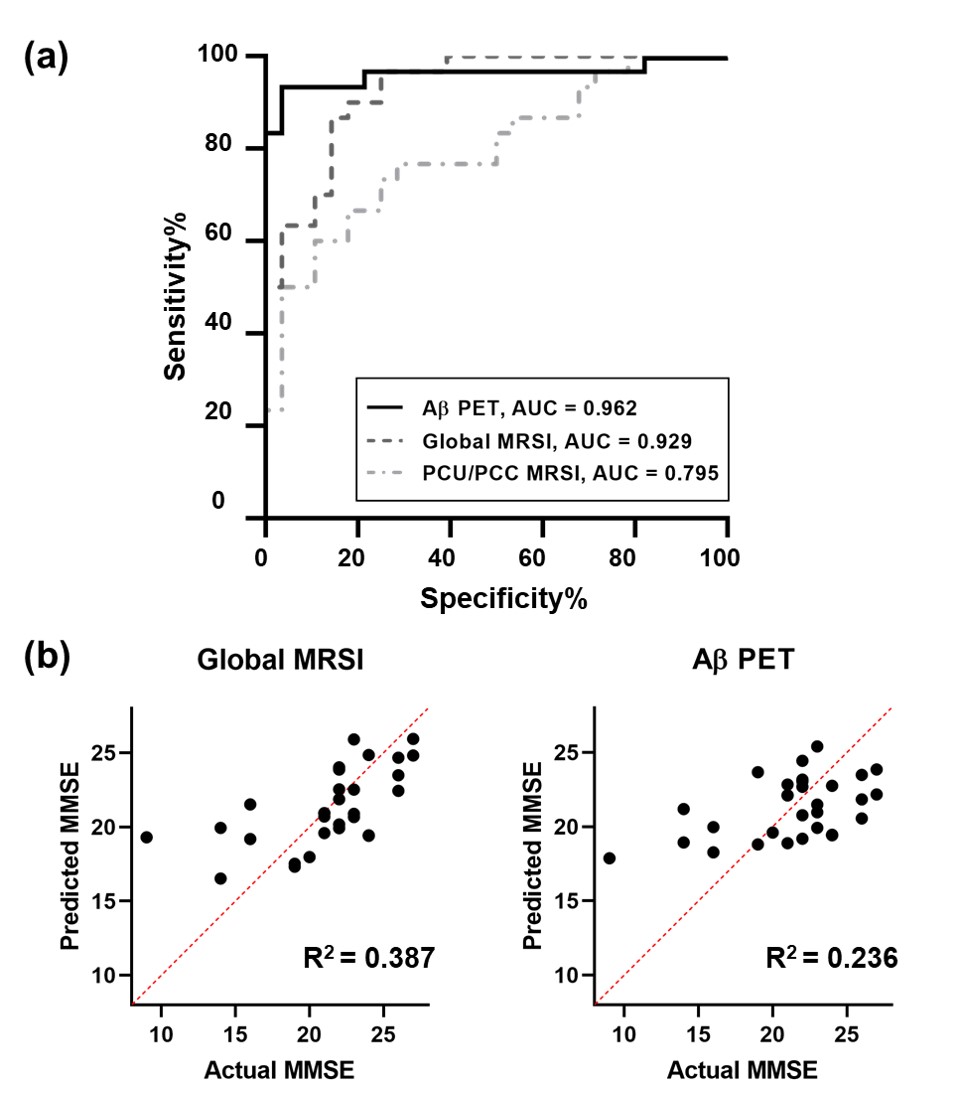
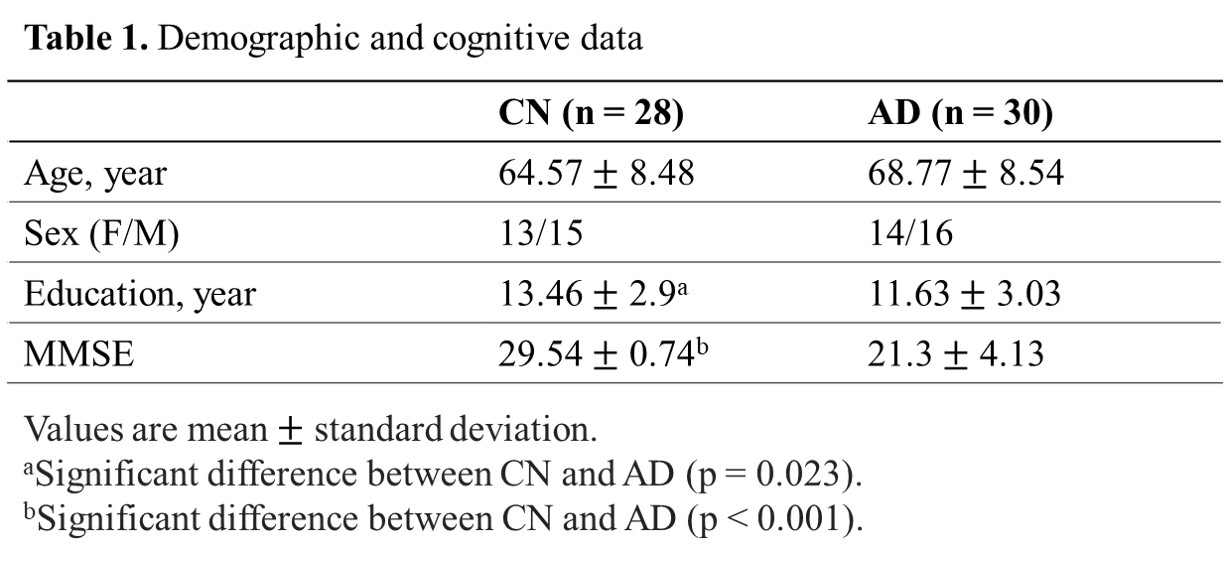
As displayed in Table 1, the CN and AD groups were matched in age (mean ± SD: 64.57 ± 8.48 vs. 68.77 ± 8.54, p = 0.066). The CN group had slightly higher education levels (13.46 ± 2.9 vs. 11.63 ± 3.03, p = 0.023) and significantly higher MMSE scores (29.54 ± 0.74 vs. 21.3 ± 4.13, p < 0.001). Figure 1 illustrates the 3D NAA and mI images, as well as the Aβ PET images obtained in two representative CN and AD subjects. Trends of reductions in NAA, and elevations in mI and Aβ SUVR can be observed. Figure 2 displays group differences in the neurometabolites in selected ROIs. For NAA/Cr, reductions were detected in PCC/PCu, IPC, SPC, and Hippo in the AD group. For mI/Cr and Aβ SUVR, all selected ROIs but Hippo showed elevations in the AD group. These observations agreed with previous results11-14 and indicated regional heterogeneity in metabolic signal changes in AD. Figure 3 demonstrated significant associations of NAA/Cr and mI/Cr with Aβ deposition. As displayed in Fig. 4(a), the classification performance of the neurometabolic signature by integrating the signal from all ROIs (AUC = 0.929) was better than using neurometabolic signal from PCC/PCu alone (AUC = 0.795), and was comparable to Aβ PET (AUC = 0.962). Our results also showed the global MRSI predicted the MMSE scores (R2 = 0.387) of AD patients in contrast to Aβ PET (R2 = 0.236) (Fig. 4(b)).Conclusion
The neurometabolic signature by integrating the neurometabolites concentrations from multiple regions showed promising results in detection of AD patients and prediction of cognitive decline in comparison with Aβ PET. The study may provide a good foundation for further investigation of using neurometabolic signature obtained from high-resolution 3D MRSI for early diagnosis of AD.Acknowledgements
Acknowledgements This work was supported by National Science Foundation of China (No.61671292 and 81871083); Shanghai Jiao Tong University Scientific and Technological Innovation Funds (2019QYA12); Key Program of Multidisciplinary Cross Research Foundation of Shanghai Jiao Tong University (YG2021ZD28); New Faculty Start-up Foundation of Shanghai Jiao Tong University (21X010500734).References
1. Voevodskaya O, Sundgren PC, Strandberg O, et al. Myo-inositol changes precede amyloid pathology and relate to APOE genotype in Alzheimer disease. Neurology 2016; 86: 1754-1761.
2. Voevodskaya O, Poulakis K, Sundgren P, et al. Brain myoinositol as a potential marker of amyloid-related pathology: A longitudinal study. Neurology 2019; 92: e395-e405.
3. Murray ME, Przybelski SA, Lesnick TG, et al. Early Alzheimer's disease neuropathology detected by proton MR spectroscopy. J Neurosci 2014; 34: 16247-16255.
4. Schuff N, Capizzano AA, Du AT, et al. Selective reduction of N-acetylaspartate in medial temporal and parietal lobes in AD. Neurology 2002; 58: 928-935.
5. Zhu X, Schuff N, Kornak J, et al. Effects of Alzheimer disease on fronto-parietal brain N-acetyl aspartate and myo-inositol using magnetic resonance spectroscopic imaging. Alzheimer Dis Assoc Disord 2006; 20: 77-85.
6. Lam F, Li Y, Guo R, et al. Ultrafast magnetic resonance spectroscopic imaging using SPICE with learned subspaces. Magn Reson Med 2020; 83: 377-390.
7. Lam F and Liang ZP. A subspace approach to high-resolution spectroscopic imaging. Magn Reson Med 2014; 71: 1349-1357.
8. Ma C, Lam F, Ning Q, et al. High-resolution (1) H-MRSI of the brain using short-TE SPICE. Magn Reson Med 2017; 77: 467-479.
9. Li Y, Lam F, Clifford B, et al. A subspace approach to spectral quantification for MR spectroscopic imaging. IEEE Trans Biomed Eng 2017; 64: 2486-2489.
10. Desikan RS, Segonne F, Fischl B, et al. An automated labeling system for subdividing the human cerebral cortex on MRI scans into gyral based regions of interest. Neuroimage 2006; 31: 968-980.
11. Huang W, Alexander GE, Chang L, et al. Brain metabolite concentration and dementia severity in Alzheimer's disease: A 1H MRS study. Neurology 2001; 57: 626-632.
12. Kantarci K, Jack CR, Jr., Xu YC, et al. Regional metabolic patterns in mild cognitive impairment and Alzheimer's disease: A 1H MRS study. Neurology 2000; 55: 210-217.
13. Chantal S, Labelle M, Bouchard RW, et al. Correlation of regional proton magnetic resonance spectroscopic metabolic changes with cognitive deficits in mild Alzheimer disease. Arch Neurol 2002; 59: 955-962.
14. Camus V, Payoux P, Barre L, et al. Using PET with 18F-AV-45 (florbetapir) to quantify brain amyloid load in a clinical environment. Eur J Nucl Med Mol Imaging 2012; 39: 621-631.
Figures