4516
Hypo-diamagnetism on χ-separation: a potential marker for the differential diagnosis between MS and NMOSD.1Radiology, Seoul St. Mary's Hospital, Seoul, Korea, Republic of, 2Department of Electrical and Computer Engineering, Seoul National University, Seoul, Korea, Republic of, 3Biomedical Engineering, Hankuk University of Foreign Studies, Yongin, Korea, Republic of, 4Neurology, Seoul St. Mary's Hospital, Seoul, Korea, Republic of
Synopsis
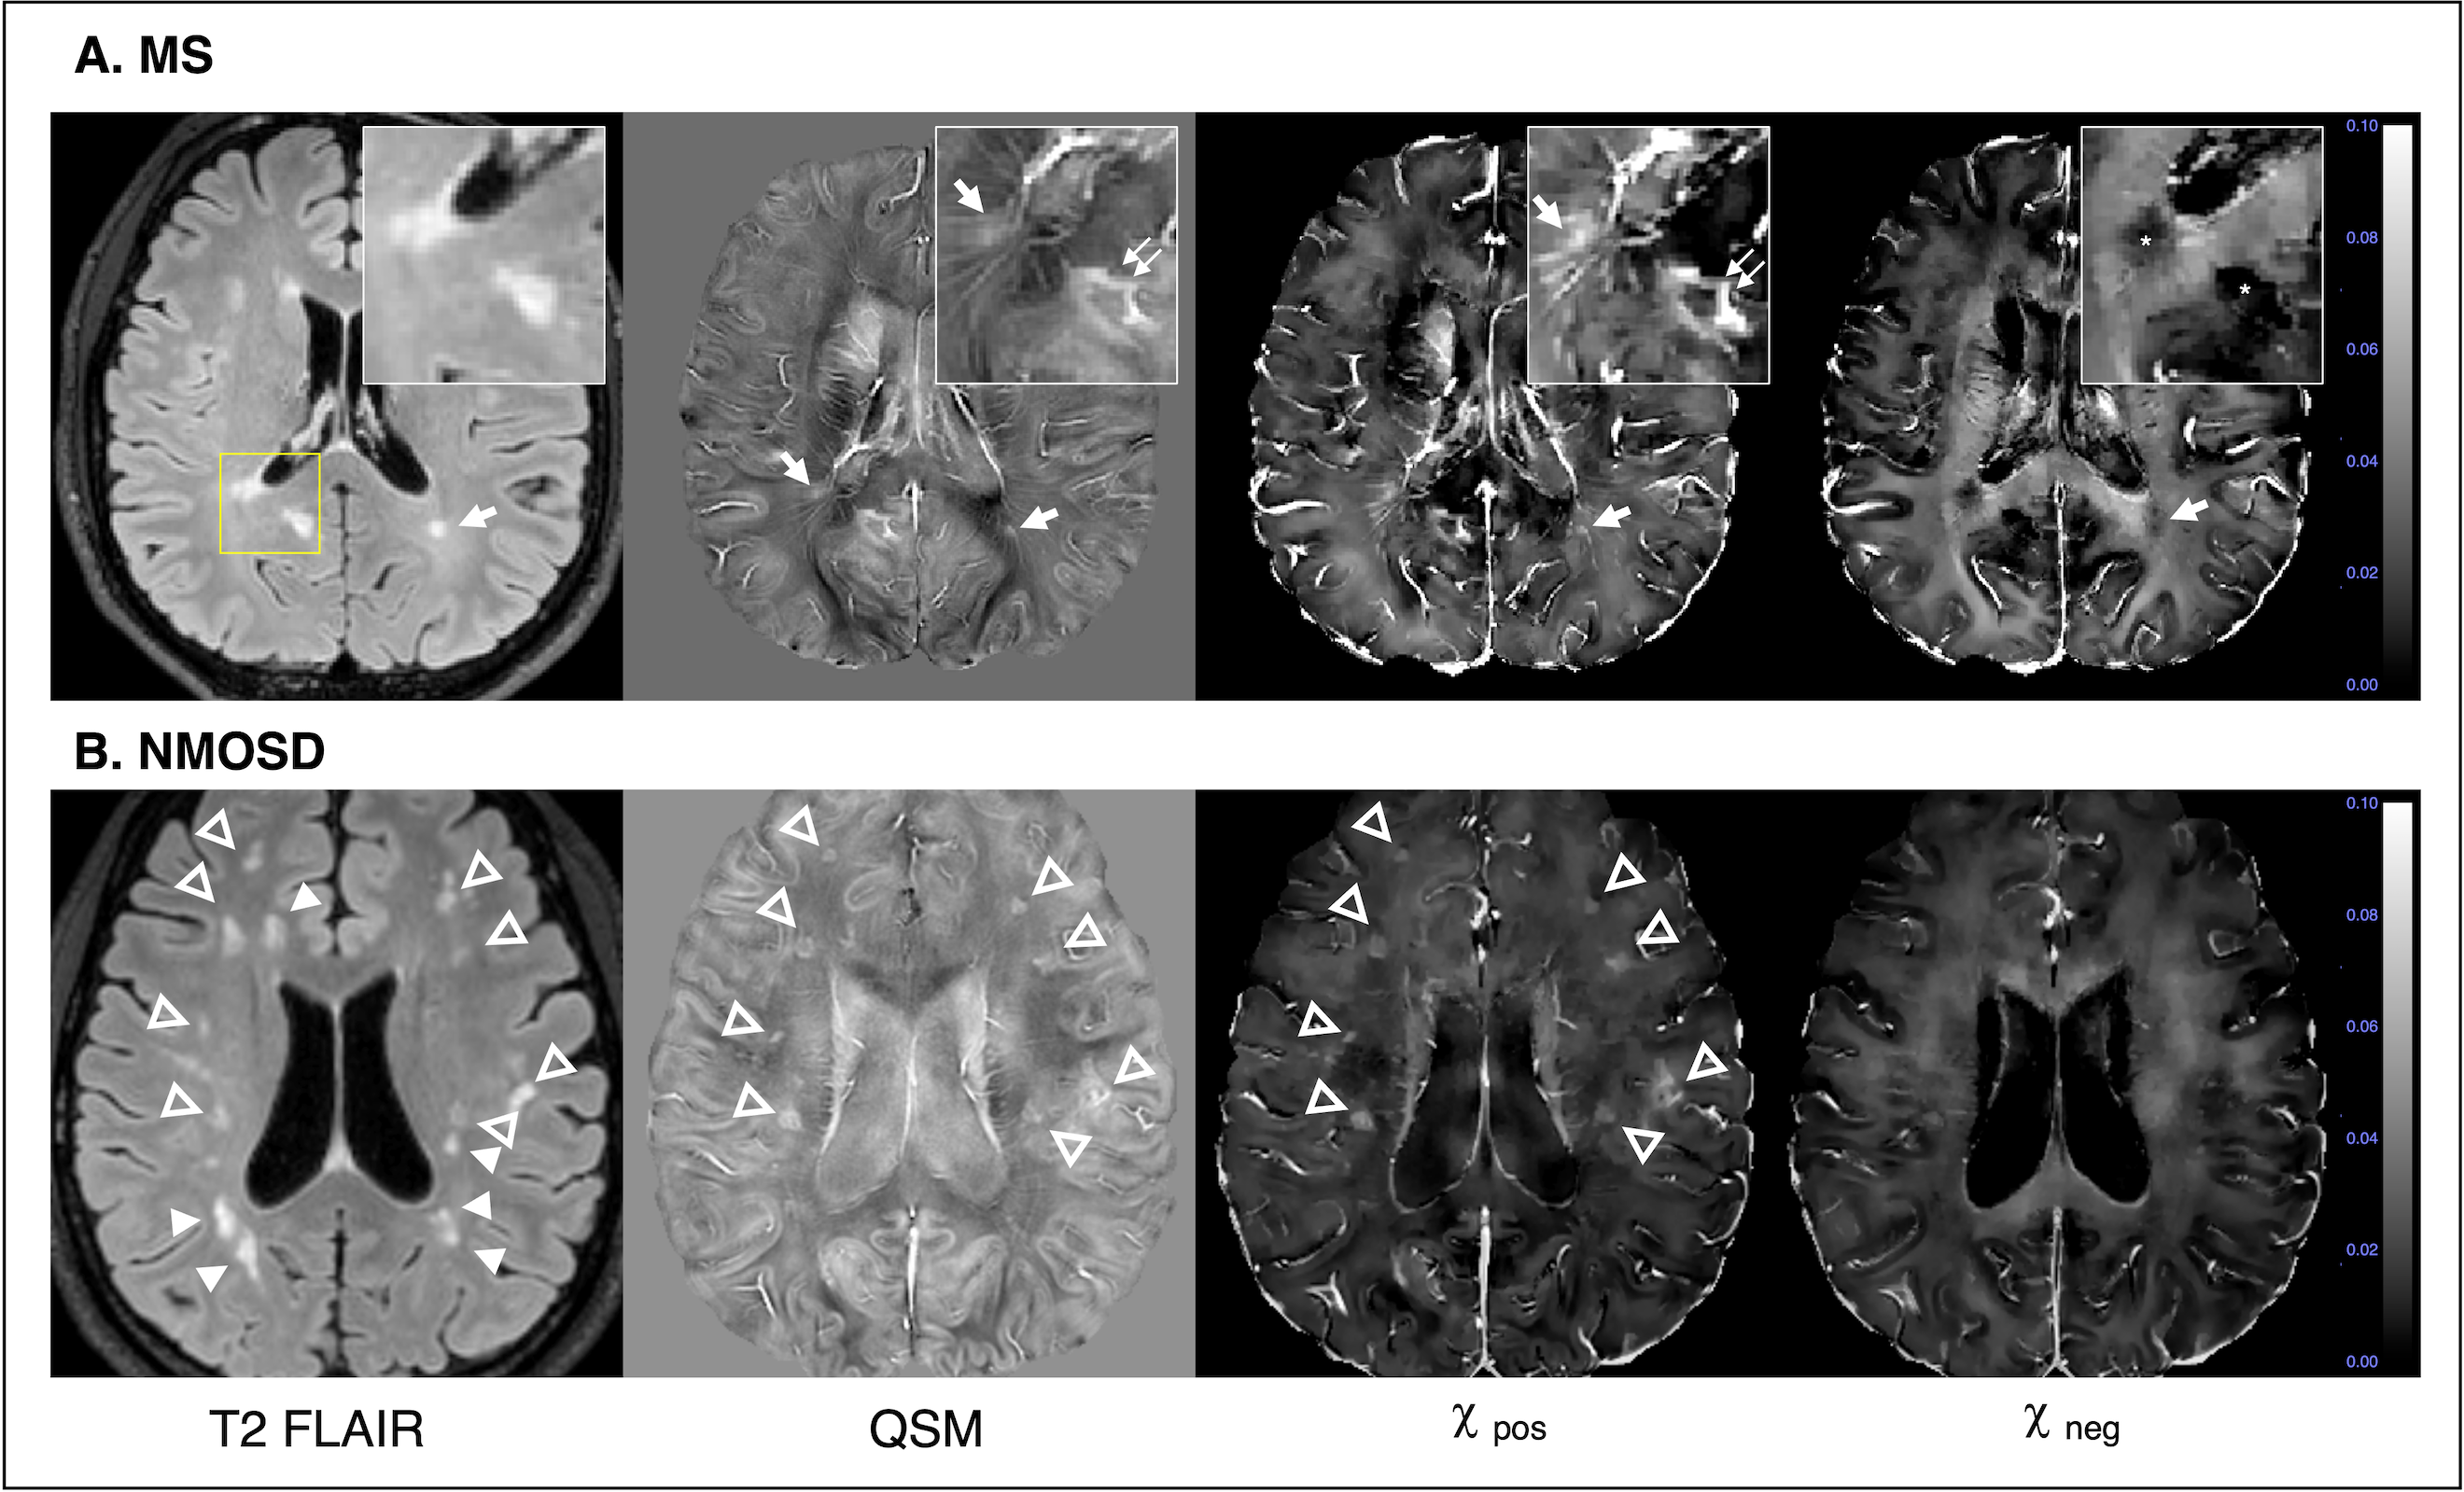
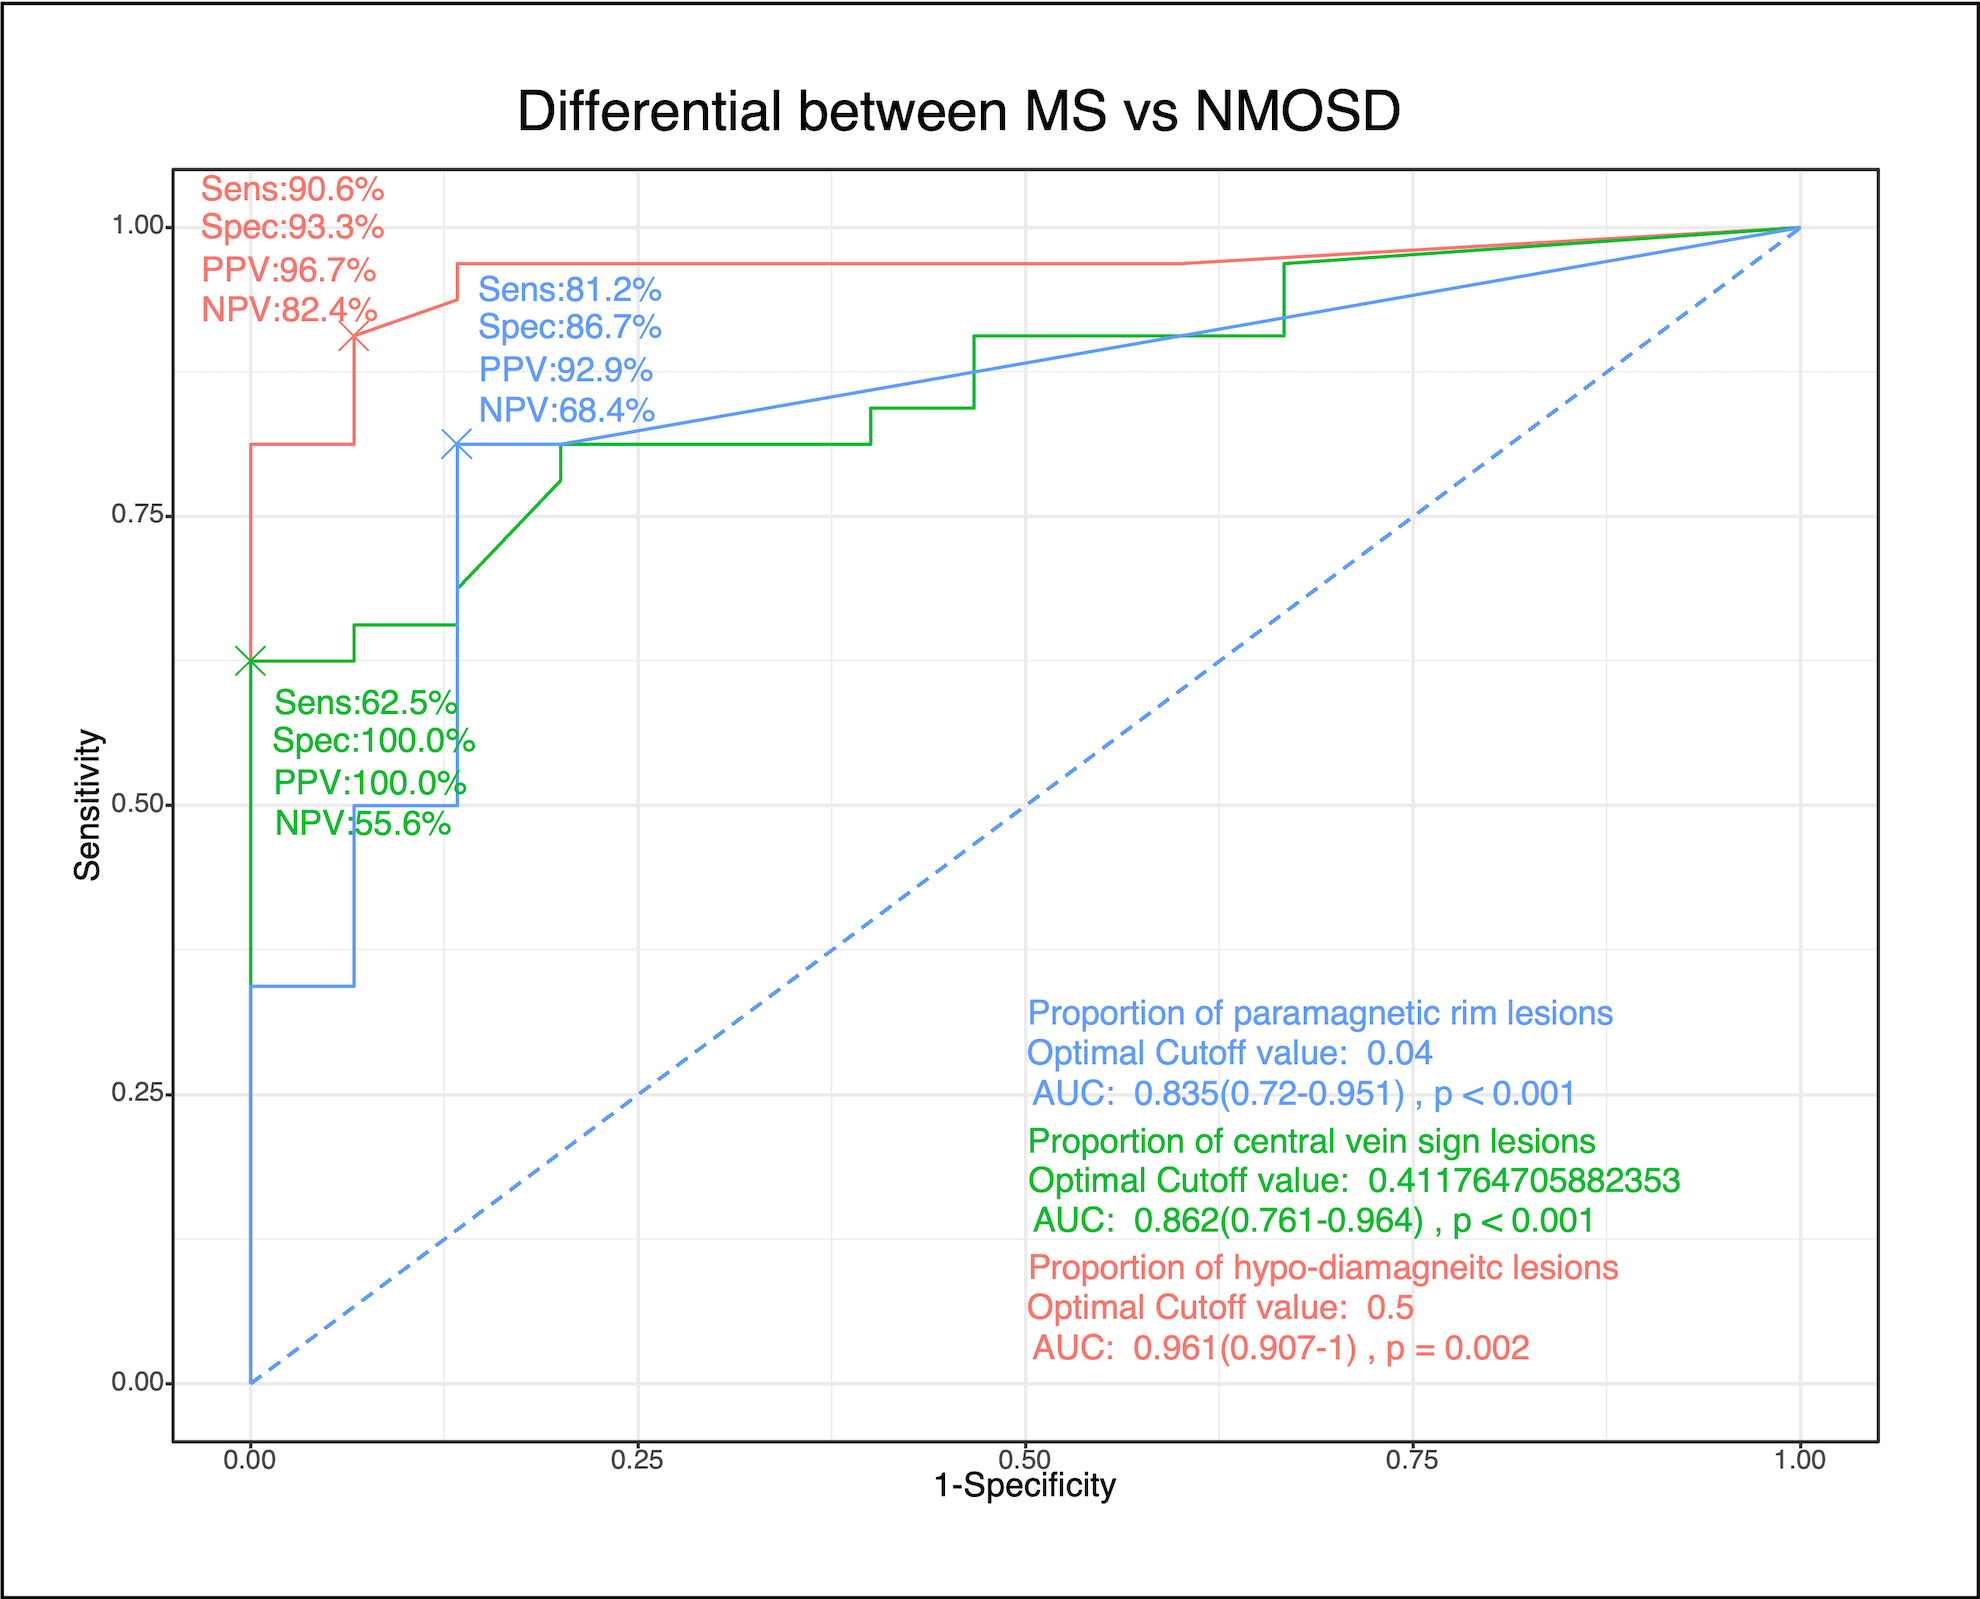
Using χ-separation, detailed characterization of MS and NMOSD lesions were possible. Majority (490/611, 80%) of MS lesions were hypo-diamagnetic on χneg maps, suggesting loss of diamagnetic myelin. On the contrary, only 14.2% (32/225) of NMOSD lesions were hypo-diamagnetic. On χpos maps, some MS and a few NMOSD lesions showed paramagnetic rim round the lesion, which was identical to paramagnetic rim sign on SWI or QSM. The proportion of hypo-diamagnetic lesions showed excellent diagnostic performances (AUROC 0.961, 95%CI 0.907-1), as compared to central vein sign and paramagnetic rim lesion sign.
Introduction
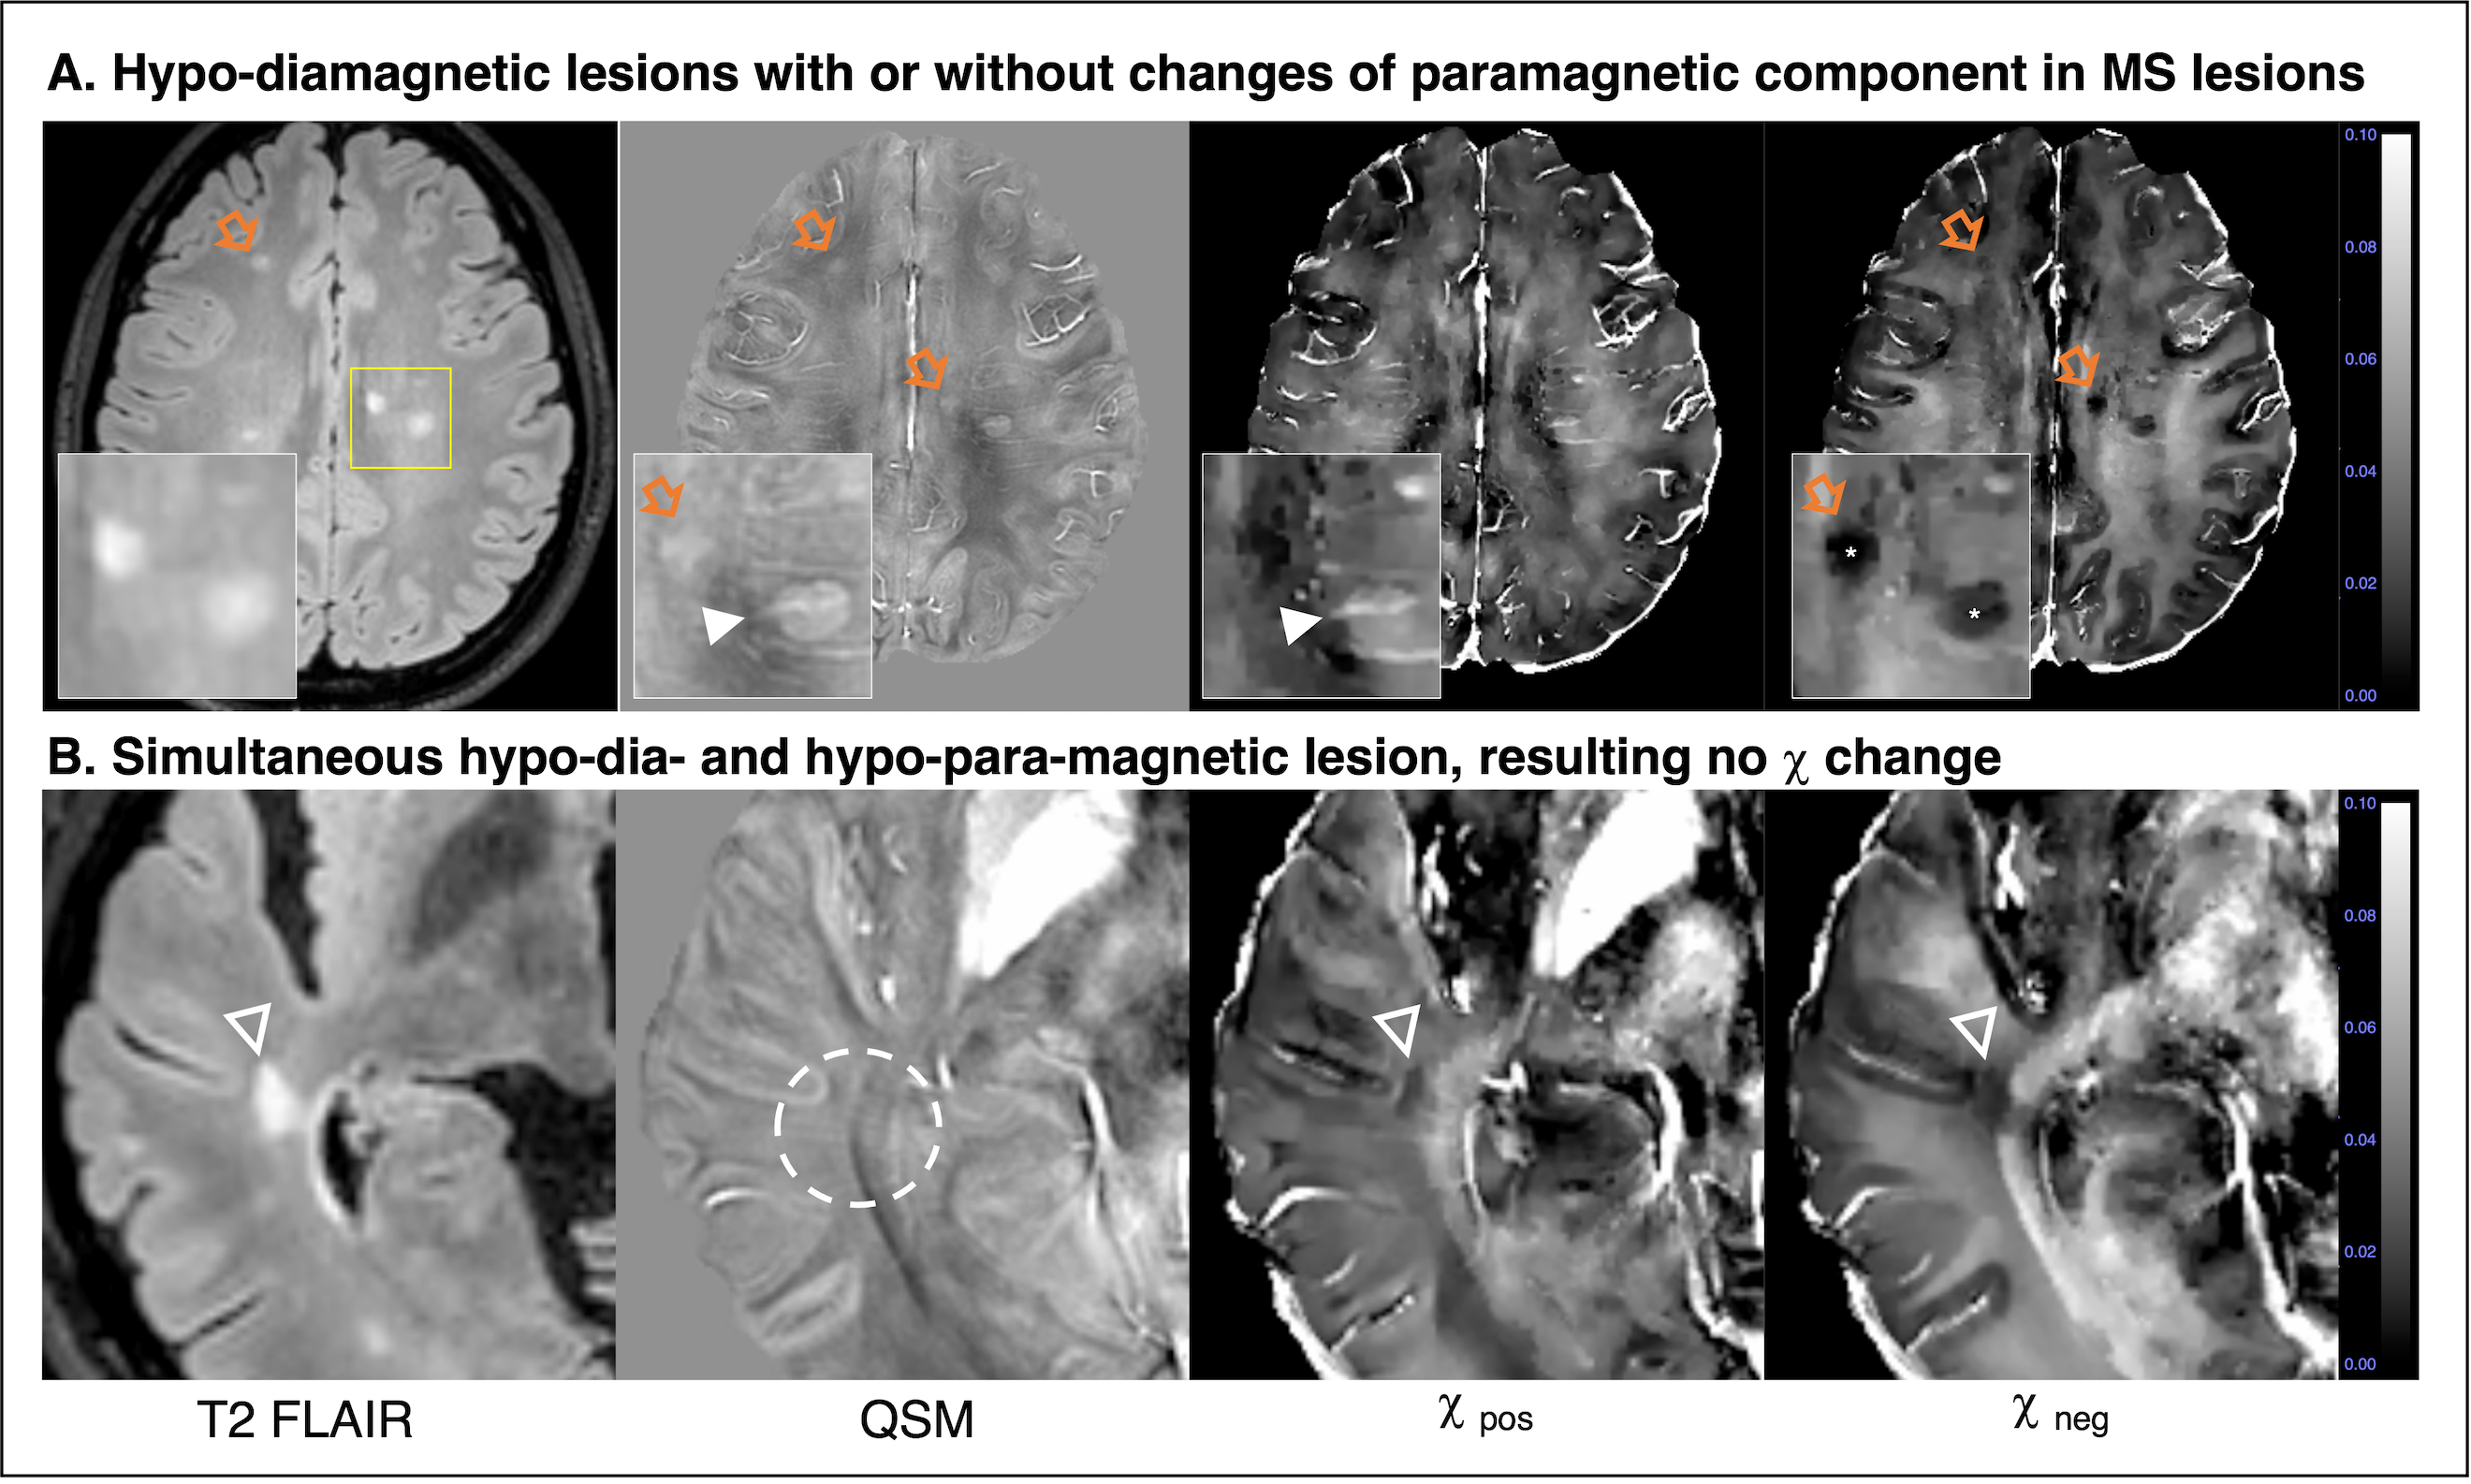
MRI has been a major tool for diagnosis of multiple sclerosis (MS) and differentiation from other diseases, such as neuromyelitis optica spectrum disorder (NMOSD). There are several characteristic MRI findings of MS lesions, those related to their histopathological changes (1). Demyelination is a hall mark of MS plaques, and thanks to unique MRI properties of myelin and myelin water, there are many MR approaches to assess myelin and their changes (2). Phase contrast-based methods such as quantitative susceptibility mapping (QSM) gained interests for this purpose. This popularity is related with iron and myelin (3) having good magnetic susceptibility contrast. One caveat is that if a lesion had deposition of paramagnetic iron and loss of diamagnetic myelin simultaneously, current conventional QSM cannot differentiate or separate those changes.Recently, Shin et al (4) proposed a method that enables separation of positive and negative sources. It provides surrogates for distribution of iron and myelin separately, and it could be a tailored approach for demyelinating lesion assessment (5). In this work, we applied χ-separation to MS and NMOSD patients and evaluated their findings. Also we explored its diagnostic value.
Methods
Local institutional review board approval was received for this study, and written informed consent was obtained from all participants.Study population
From 2017 October to 2020 October, all 32 MS and 15 NMOSD patients who underwent MRI with χ sepration protocol. We excluded patients with other diagnosis or unclear diagnosis or poor image quality or loss of raw image data. Patient demographics and clinical characteristics were collected from medical records.
MRI protocols
MRI scan was done using clinical 3T MRI (Ingenia, Philips Healthcare) and 32 channel coil. The protocol included multi-contrast 3D structural imaging, and 3D multi-echo gradient images for R2* and frequency mapping (FOV 216 x 216 x 144 mm3, voxel size 0.5 x 0.5 x 2 mm3, TR 20 ms, TE 5.8 to 36.7 ms with echo spacing of 6.2 ms, flip angle 17°). 2D multi-spin echo images with narrow z coverage was obtained for the supervised learning of R2 mapping and further χ-separation (4). Of note, multi-spin echo images require quite long scan time, and it is not feasible in clinical situation. To resolve this problem, we trained a 3D neural net was trained to estimate R2 from 3D T1- and T2-weighted images, as a supervised learning fashion (6). There was excellent correlation between R2 estimated from mSE and R2 from DL, as well as χ-separation maps using mSE-R2 and DL-R2 (correlation coefficient = 0.98). The magnetic susceptibility source separation algorithm divides positive and negative susceptibility sources by using magnitude information (R2’) and tissue phase according to previously described method (4). Separated mapping of positive and negative sources (χpos And χneg maps) were obtained.
Image analysis
3D FLAIR images were used to detect MS and NMOSD brain lesions. For each lesion, presence of contrast-enhancement, presence of central vein sign (CVS), presence of paramagnetic rim (PRL), and appearance on χpos And χneg maps were evaluated. Also, size, volume, mean signal intensity of χpos And χneg maps were also calculated and compared. For per patient analysis such as the proportion of lesions with each sign were calculated and their diagnostic performances were evaluated.
Results
From 32 MS and 15 NMSOD patients, 661 MS lesions and 225 NMOSD lesions were analyzed. Lesion numbers were not significantly different in two groups (Table 1 in Figure 1).About 80% (490/6111) of MS lesions were hypointense on χneg (hypo-diamagnetic), while 14.2% (32/225) of NMOSD lesions were hypo-diamagnetic (P<0.001, Table 2 at Figure 1, Figure 2 and 3). Hypo-diamagnetic MS lesions were mostly paramagnetic on QSM (453/490, 92.5%), but this was not in NMOSD (18/32, 56.3%, Figure 2). On χpos, MS lesions showed significantly more frequent paramagnetic rims (23.7%, 144/611) as compared to NMOSD lesions (9.8%, 22/225, P<0.001), which was identical to PRL on SWI or QSM. There were 107 MS and 7 NMOSD lesions were hypo-diamagnetic and hyper-paramagnetic at the same time (P<0.001). Quantitative assessment showed that MS lesions shows significantly lower signal intensity on χneg (27.26ppb, IQR 17.98-36.36) as compared to NMOSD (31.63ppb, IQR 22.57-40.57, P<0.001, Table 2 in Figure 1).
MS patients (Table 3 at Figure 1) showed significantly higher number of hypo-diamagnetic lesions (median 16, IQR 7.5-22.5, NMOSD 1, IQR 0-3, P<0.001) and the proportion of hypo-diamagnetic lesions (0.83, IQR 0.72-0.93, NMOSD 0.06 IQR 0.00-0.14, P<0.001) as compared to NMOSD. The diagnostic performances of the proportion of hypo-diamagnetic lesion was significantly higher than CVS or PRL (P=0.026 and 0.003 each, Delong test, Figure 4).
Discussion and Conclusion
In this work, we evaluated and compared brain lesion characteristics in MS and NMOSD using χ-separation. We found majority of MS lesions (80%) were hypo-diamagnetic, suggesting loss of diamagnetic myelin, which was not common in NMOSD lesions. Per patient analysis showed significantly higher proportion (0.83) of hypo-diamagnetic lesions in MS as compared to NMOSD and its diagnostic value was better diagnostic performance as compared to CVS or PRL.In conclusion, we found that hypo-diamagentism on χ-separation could demonstrate the histological characteristics of MS lesions over NMOSD. It is a potentially useful marker for the differentiation between MS and NMOSD.
Acknowledgements
This research was supported by Basic Science Research Program through the National Research Foundation of Korea funded by the Korea government (MSIT). Grant/Award Number (NRF-2020R1C1C1012320).References
1. Jeong IH, Choi JY, Kim SH, Hyun JW, Joung A, Lee J, et al. Comparison of myelin water fraction values in periventricular white matter lesions between multiple sclerosis and neuromyelitis optica spectrum disorder. Mult Scler. 2016;22(12):1616-20.
2. Sarbu N, Shih RY, Jones RV, Horkayne-Szakaly I, Oleaga L, Smirniotopoulos JG. White Matter Diseases with Radiologic-Pathologic Correlation. Radiographics. 2016;36(5):1426-47.
3. Lee J, Hyun J-W, Lee J, Choi E-J, Shin H-G, Min K, et al. So You Want to Image Myelin Using MRI: An Overview and Practical Guide for Myelin Water Imaging. Journal of Magnetic Resonance Imaging. 2021;53(2):360-73.
4. Absinta M, Lassmann H, Trapp BD. Mechanisms underlying progression in multiple sclerosis. Curr Opin Neurol. 2020;33(3):277-85.
5. Shin H-G, Lee J, Yun YH, Yoo SH, Jang J, Oh S-H, et al. χ-separation: Magnetic susceptibility source separation toward iron and myelin mapping in the brain. NeuroImage. 2021;240:118371.
6. Jang J, Shin H-G, Nam Y, Lee J, Kim W, Lee J. Closer look at Multiple sclerosis lesions: an initial result of separation of positive and negative magnetic susceptibilities. Proc Intl Soc Mag Reson Med. 2020:0057.
Figures
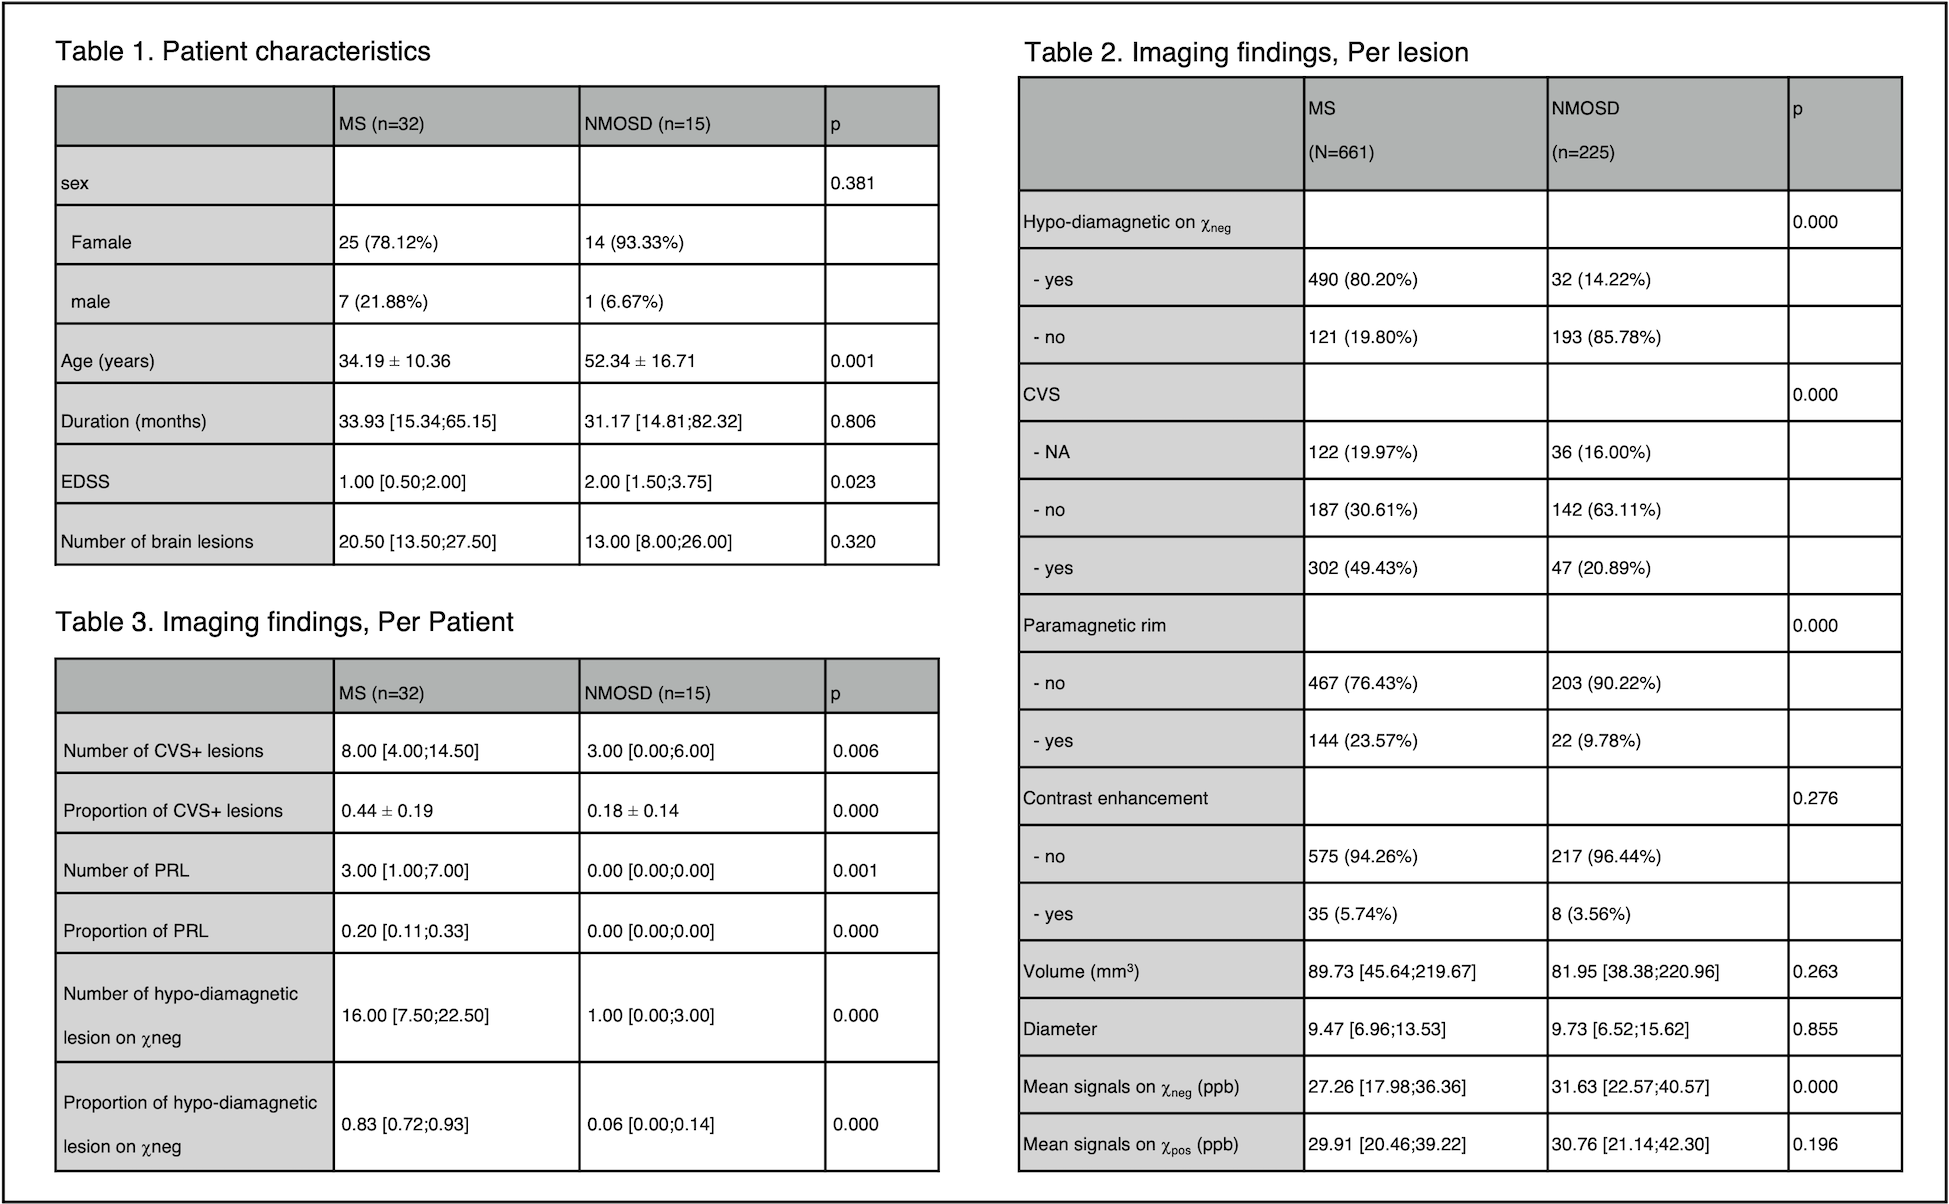
Table 1. Patient Characterstics.
Table 2. Image findings, Per lesion analysis.
Table 3. Image findings, Per Patient analysis.