4513
Iron and Myelin Content in Cortical Lesions in Multiple Sclerosis using Magnetic Susceptibility Source Separation1Department of Biomedical Engineering, Faculty of Medicine, University Hospital Basel and University of Basel, Translational Imaging in Neurology (ThINk) Basel, Basel, Switzerland, 2University Hospital Basel and University of Basel, Neurologic Clinic and Policlinic, MS Center and Research Center for Clinical Neuroimmunology and Neuroscience Basel (RC2NB), Basel, Switzerland, 3Department of Electrical and Computer Engineering, Seoul National University, Laboratory for Imaging Science and Technology, Seoul, Korea, Republic of, 4Division of Radiological Physics, Department of Radiology, University Hospital Basel and University of Basel, Basel, Switzerland, 5Department of Radiology, Weill Medical College of Cornell University, New York, NY, United States
Synopsis
The visualization and characterization of cortical MS lesions is challenging on conventional MRI. In the present study, we used a susceptibility source separation algorithm to divide the positive and negative susceptibility of quantitative susceptibility mapping (QSM) MRI, so that we could disentangle signal alterations due to myelin loss or iron accumulation. In 19 MS patient with 123 cortical lesions, we found that the major part of QSM susceptibility of cortical lesions is driven by myelin and iron loss, while only a small proportion of lesions (12/123, 9.8%) showed an increment of susceptibility that is caused by iron accumulation.
Background
Multiple Sclerosis (MS) is a chronic inflammatory disorder of the central nervous system. It is classically known as a demyelinating disease that primarily affects the white matter. However, in the past decades, the involvement of cortical and deep gray matter demyelination in MS has gained substantial interest1. Cortical lesion (CL) volume correlates more robustly with physical and cognitive disability than white matter (WM) lesions2. Recently, CLs have become an integral part of the current MS diagnostic criteria3.Iron is crucial for myelin formation, oxidative metabolism and neurotransmitter synthesis4. Histopathological and imaging studies using MRI phase imaging have demonstrated that iron metabolism is altered in MS, and iron accumulation is present in MS WM lesions5,6. The role of iron in CLs is less well studied. Compared to WM-lesions, CLs show reduced lymphocyte infiltration7 and no breakdown of the blood brain barrier8. Similar to paramagnetic WM lesions, quantitative susceptibility mapping (QSM) of CLs demonstrated hyperintense edges in proximity of the pial surface, which might be due to a subpial gradient of microglial activation9. However, in contrast to WM lesions, CLs on 7T QSM showed negative relative susceptibility, suggesting that iron loss dominates the susceptibility contrast in CLs10.
QSM is an advanced MRI technique that has been used to characterize MS lesions with regard to their content of myelin and iron. Nevertheless, conventional QSM is not able to differentiate between a loss of diamagnetic myelin or a deposition of paramagnetic iron. Recently, a new method of magnetic susceptibility source separation („chi-separation“) was proposed11, that enables to discriminate a decrease of diamagnetism (e.g., myelin loss) an increase of paramagnetism (iron accumulation) in QSM. In this work, we applied chi-separation to disentangle the presence of iron and myelin content in cortical MS lesions in vivo.
Methods
We included 19 MS patients who underwent MRI scans containing (I) 3D-MP2RAGE12 uniform/flat images (Figure 1A); (II) Fast T2prep spiral13; and (III) multi-echo gradient echo images (GRE, Figure 1B) on a 3.0T whole-body MR system (Magnetom Prisma, Siemens Healthineers, Erlangen, Germany) using a 64 channel head and neck RF coil (spatial resolution 0.75*0.75*3mm3, TR 49ms, number of echos 10 and TEs=6.7, 10.8, 14.8, 18.9, 22.9, 27.0, 31.1, 35.1, 39.2, 43.2ms).The chi-separation algorithm was applied as previously described11 to obtain positive and negative source information (Figure 1C and D).
CL were segmented by a trained rater on MP2RAGE using ITK-SNAP14. Chi-separation maps and CL maps were patient-wise co-registered to a common space using FreeSurfer (http://surfer.nmr.mgh.harvard.edu/). CL maps were visually assessed on chi-separation maps with regard to their intensity in comparison to the surrounding normal appearing gray and/or white matter tissue, and allocated to one of the following lesion types (negative/positive separation maps, i.e. myelin/iron): iso/iso, hypo/hypo, hyper/hyper, iso/hyper, iso/hypo, hyper/iso, hypo/iso, hyper/hypo, hypo/hyper (Figure 2).
Results
In summary, 151 CLs were segmented on MP2RAGE images. Due to partial volume effects, 28 of those lesions could not be evaluated on chi-separation maps. Of the remaining CLs, 103/123 (84.4%) showed alterations on chi-separation maps, while 20/123 (15.6%) were isointense on negative and positive maps (iso/iso). On negative separation maps (myelin sensitive), 8/123 (6.5%) CL appeared hyperintense, 49/123 (39.8%) isointense and 66/123 (53.7%) hypointense. On positive separation maps (iron sensitive), 12/123 (9.8%) lesions showed hyperintensities, 33/123 (26.8%) isointensities and 77/123 (62.6%) hypointensities. Of the 66/123 (53.7%) of lesions that appeared hypointense on negative separation maps (indicating myelin loss), 50/66 (76%) were hypointense (hypo/hypo), 7/66 (10%) hyperintense (hypo/hyper) and 9/66 (14%) isointense (hypo/iso) on corresponding positive separation maps. Of the 12/123 (9.8%) of lesions that showed higher intensities on positive separation maps (indicating iron accumulation), 2/12 (17%) were hyperintense (hyper/hyper), 3/12 (25%) isointense (iso/hyper) and 7/12 (58%) hypointense (hypo/hyper) on corresponding negative separation maps.Discussion
Our findings suggest that most of CLs show a QSM susceptibility that is driven by myelin loss, while only a small proportion of lesions (12/123, 9.8%) exhibits an increment of susceptibility that is caused by iron accumulation. Furthermore, most lesions showed a decrement of paramagnetism on positive separation maps, suggestive of iron loss. These findings are in line with a previous study that investigated CLs susceptibility on 7T QSM10. However, we made use of an algorithm that is based on 3T QSM imaging, which may make the application more suitable for daily clinical practice.Conclusion
QSM susceptibility of CLs is driven by myelin loss rather than iron accumulation. Future studies should aim at confirming these results in larger cohorts, at correlating these findings with clinical and other MRI parameters and at approving these results with post mortem specimen.Acknowledgements
None.References
(1) Calabrese M, Magliozzi R, Ciccarelli O, Geurts JJ, Reynolds R, Martin R. Exploring the origins of grey matter damage in multiple sclerosis. Nat Rev Neurosci. 2015;16(3):147-158. doi:10.1038/nrn3900(2) Harrison DM, Roy S, Oh J, et al. Association of Cortical Lesion Burden on 7-T Magnetic Resonance Imaging With Cognition and Disability in Multiple Sclerosis. JAMA Neurol. 2015;72(9):1004-1012. doi:10.1001/jamaneurol.2015.1241
(3) Thompson AJ, Banwell BL, Barkhof F, et al. Diagnosis of multiple sclerosis: 2017 revisions of the McDonald criteria. Lancet Neurol. 2018;17(2):162-173. doi:10.1016/S1474-4422(17) 30470-2
(4) Larsen B, Bourque J, Moore TM, et al. Longitudinal Development of Brain Iron Is Linked to Cognition in Youth. J Neurosci. 2020;40(9):1810-1818.
(5) Mehta V, Pei W, Yang G, et al. Iron is a sensitive biomarker for inflammation in multiple sclerosis lesions. PLoS One. 2013;8(3):e57573. doi:10.1371/journal.pone.0057573
(6) Hametner S, Dal Bianco A, Trattnig S, Lassmann H. Iron related changes in MS lesions and their validity to characterize MS lesion types and dynamics with Ultra-high field magnetic resonance imaging. Brain Pathol. 2018;28(5):743-749. doi:10.1111/bpa.12643
(7) Peterson JW, Bo L, Mork S, Chang A, Trapp BD. Transected neurites, apoptotic neurons, and reduced inflammation in cortical multiple sclerosis lesions. Ann Neurol 2001;50:389–400.
(8) van Horssen J, Brink BP, de Vries HE, van der Valk P, Bø L. The blood-brain barrier in cortical multiple sclerosis lesions. J Neuropathol Exp Neurol. 2007;66(4):321-328. doi:10.1097/nen.0b013e318040b2de
(9) Castellaro M, Magliozzi R, Palombit A, et al. Heterogeneity of Cortical Lesion Susceptibility Mapping in Multiple Sclerosis. AJNR Am J Neuroradiol. 2017;38(6):1087-1095. doi:10.3174/ajnr.A5150
(10) Bian W, Tranvinh E, Tourdias T, et al. In Vivo 7T MR Quantitative Susceptibility Mapping Reveals Opposite Susceptibility Contrast between Cortical and White Matter Lesions in Multiple Sclerosis. AJNR Am J Neuroradiol. 2016;37(10):1808-1815. doi:10.3174/ajnr.A4830
(11) Shin HG, Lee J, Yun YH, et al. χ-separation: Magnetic susceptibility source separation toward iron and myelin mapping in the brain. Neuroimage. 2021;240:118371. doi:10.1016/j.neuroimage.2021.118371
(12) Marques JP, Kober T, Krueger G, van der Zwaag W, Van de Moortele PF, Gruetter R. MP2RAGE, a self bias-field corrected sequence for improved segmentation and T1-mapping at high field. Neuroimage. 2010;49(2):1271-1281. doi:10.1016/j.neuroimage.2009.10.002
(13) Nguyen TD, Deh K, Monohan E, et al. Feasibility and reproducibility of whole brain myelin water mapping in 4 minutes using fast acquisition with spiral trajectory and adiabatic T2prep (FAST-T2) at 3T. Magn Reson Med. 2016;76(2):456-465. doi:10.1002/mrm.25877
(14) Yushkevich PA, Piven J, Hazlett HC, et al. User-guided 3D active contour segmentation of anatomical structures: significantly improved efficiency and reliability. Neuroimage. 2006;31(3):1116-1128. doi:10.1016/j.neuroimage.2006.01.015
Figures
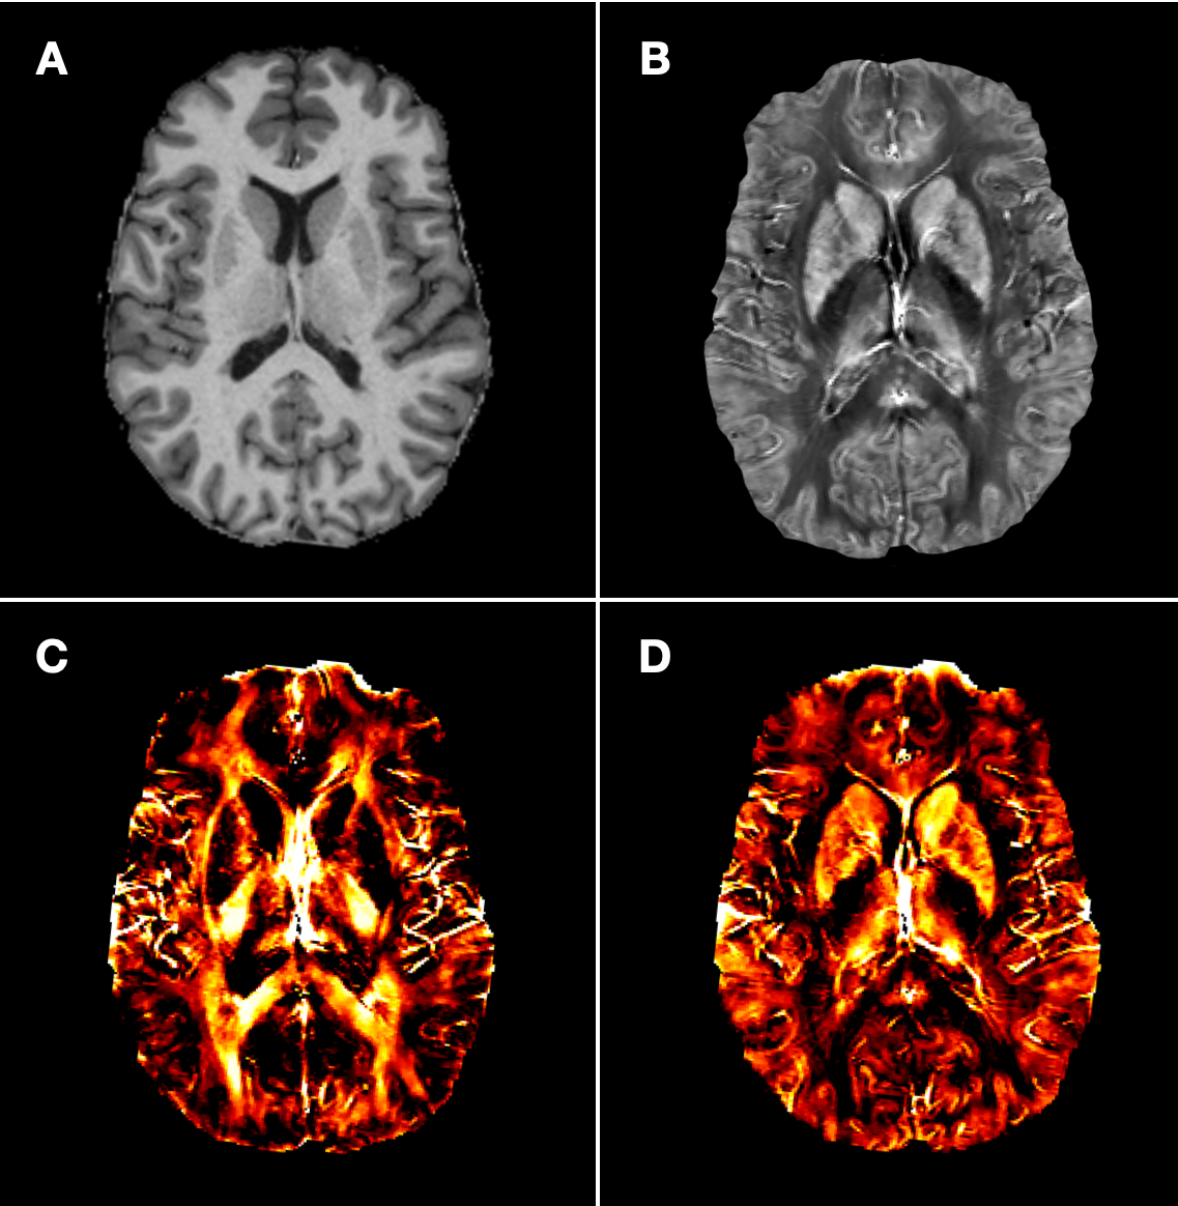
Figure 1: A: MP2RAGE. B: quantitative susceptibility mapping (QSM) based on multi-echo gradient echo (GRE). C: Chi-separation map of negative sources indicating myelin. D Chi-separation map of positive sources indicating iron.
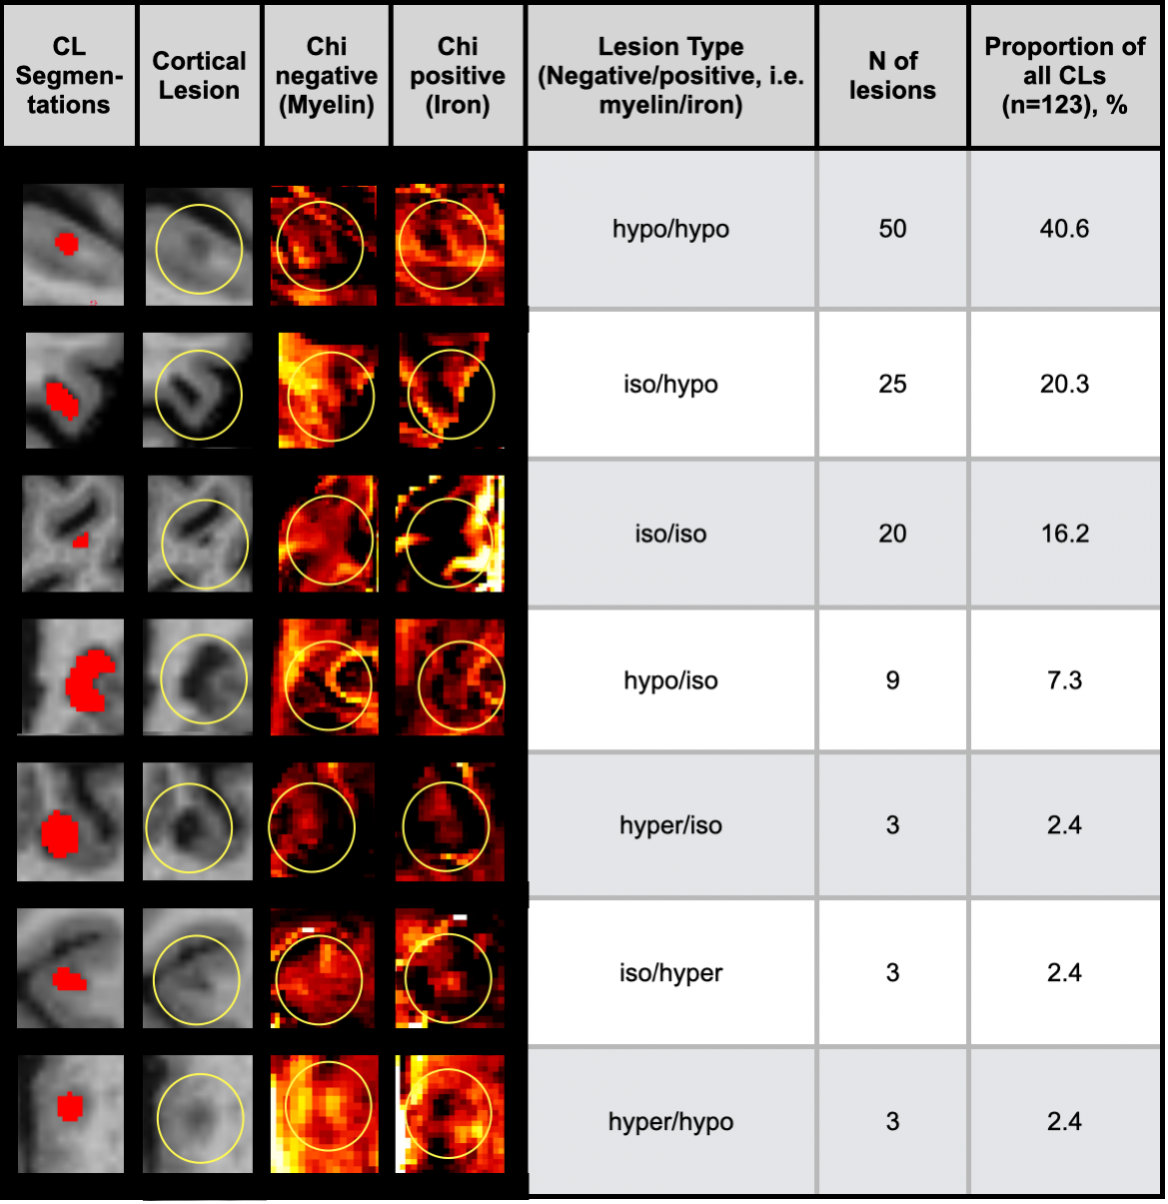
Figure 2: Most common lesion types of cortical lesions, based on their signal intensity relative to the surrounding normal appearing gray/white tissue. Abbreviations: CL cortical lesion.