4512
Microstructure changes of the normal-appearing white matter in the Corpus Callosum in Relapsing-Remitting Multiple Sclerosis
Lester Melie-Garcia1,2,3, Muhamed Barakovic1,2,3, Matthias Weigel1,2,3,4, Reza Rahmanzadeh1,2,3, Riccardo Galbusera1,2,4, Po-Jui Lu1,2,3, Alessandro Cagol1,2,3, Antoine Lutti5, Sabine Schaedelin6, Pascal Benkert6, Alexandra Todea1,2,3,7,8, Esther Ruberte1,9, Ernst-Wilhelm Radue1, Ludwig Kappos1,2,3, Jens Kuhle3, and Cristina Granziera1,2,3
1Translational Imaging in Neurology (ThINK), Biomedical Engineering Department, University of Basel, Basel, Switzerland, 2Department of Medicine, University Hospital Basel, Basel, Switzerland, 3Neurologic Clinic and Policlinic, MS Center and Research Center for Clinical Neuroimmunology and Neuroscience Basel (RC2NB), University Hospital Basel, Basel, Switzerland, 4Division of Radiological Physics, Department of Radiology, University Hospital Basel, Basel, Switzerland, 5Laboratory for Research in Neuroimaging (LREN), Department of Clinical Neurosciences, Lausanne University Hospital (CHUV) and University of Lausanne, Lausanne, Switzerland, 6Clinical Trial Unit, Department of Clinical Research, University Hospital Basel, Basel, Switzerland, 7Division of Neuroradiology, Department of Radiology, University Hospital Basel, Basel, Switzerland, 8Translational Imaging in Neurology (ThINK) Basel, Biomedical Engineering Department, University of Basel, Basel, Switzerland, 9Medical Image Analysis Center (MIAC), Basel, Switzerland
1Translational Imaging in Neurology (ThINK), Biomedical Engineering Department, University of Basel, Basel, Switzerland, 2Department of Medicine, University Hospital Basel, Basel, Switzerland, 3Neurologic Clinic and Policlinic, MS Center and Research Center for Clinical Neuroimmunology and Neuroscience Basel (RC2NB), University Hospital Basel, Basel, Switzerland, 4Division of Radiological Physics, Department of Radiology, University Hospital Basel, Basel, Switzerland, 5Laboratory for Research in Neuroimaging (LREN), Department of Clinical Neurosciences, Lausanne University Hospital (CHUV) and University of Lausanne, Lausanne, Switzerland, 6Clinical Trial Unit, Department of Clinical Research, University Hospital Basel, Basel, Switzerland, 7Division of Neuroradiology, Department of Radiology, University Hospital Basel, Basel, Switzerland, 8Translational Imaging in Neurology (ThINK) Basel, Biomedical Engineering Department, University of Basel, Basel, Switzerland, 9Medical Image Analysis Center (MIAC), Basel, Switzerland
Synopsis
A scarce body of literature studies the Corpus Callosum (CC) normal-appearing white matter (NAWM) in Relapsing-Remitting Multiple Sclerosis (RRMS). This work aimed to characterize the degree of the alterations in different CC segments by assessing the extent of damage to myelin and axon, as measured with myelin volume fraction, axonal volume fraction, and g-ratio. These microstructural measures correlated with disease duration, EDSS, number, and volume of the lesions in other white matter regions. In sum, this work shows that CC pathology in RRMS patients is related to focal damage and/or diffuse neurodegeneration, which is clinically relevant.
Introduction
The Corpus callosum (CC) plays a central role in interhemispheric communication 1–7. It constitutes the major brain white matter bundle involved in almost all brain cognitive and sensory functions 1–7. Hence, it is crucial to characterize the microstructural properties related to the anatomy and function of this brain structure in normal and pathological states and how they relate to clinics.To our knowledge, there is little evidence pointing to significant impairment in CC normal-appearing tissue (NACT) in Relapsing-Remitting Multiple Sclerosis (RRMS) patients 8,9. Importantly, due to demyelination/remyelination being the main WM processes defining MS pathology, in previous studies the use of myelin surrogate variables (i.e., myelin water fraction) 8,9 have prevailed. Yet, no experimental results indicate how myelin and other variables related to axonal integrity and conduction velocity concurrently change in the NACT of RRMS.
In this work, we focused on the NACT characterization and its relationship to clinical outcomes. To investigate the extent and the nature of NACT damage, we quantified axon volume fraction (AVF), myelin volume fraction (MVF), and g-ratio (GR) of RRMS without focal CC lesions. We also explored if WM lesions' number (NoL) and volume (VoL) are predictive of the CC microstructure. The possible association with CC tissue microstructure with other clinical variables like Expanded Disability Status Scale (EDSS) and disease duration (DD)) were also investigated.
Materials and Methods
We included (i) 81/86 RRMS patients without CC lesions (age: 38.5y±12.7y, mean±SD, males=28, Expanded Disability Status Scale EDSS=2.08±1.3, Disease duration=5.64y±6.7y); (ii) 78 healthy controls group (HC, age: 37.5y±11.3y, males=33).A 3T MRI experiment (Siemens Prisma scanner) was performed that included: (i) 3D RF-spoiled gradient-echo acquisitions with predominantly Magnetization Transfer-weighted (MTw: TR/α = 25 ms/5o), Proton Density-weighted (PDw:TR/α =25ms/5o) and T1-weighted (T1w:TR/α =11ms/15o) contrast 10–12 to estimate Magnetization Transfer saturation map (MTsat)13. A single gradient echo was acquired TE=4.92ms. A B1+ mapping protocol was also recorded; (ii) Multi-shell diffusion protocol, 2D EPI, GRAPPA_aceleration_factor=3, 1.8mm3 isotropic resolution, b-values [0,700,1000,2000, 3000]s/mm2, TE/TR=75ms/4500ms, for neurite orientation and density imaging (NODDI) 14; (iii) 3D FLAIR (TR/TE/TI=5000/386/1800ms) and MP2RAGE (TR/TI1/TI2=5000/700/2500ms), 1mm3 isotropic spatial resolution, for lesion detection and morphometric analyses. MTsat maps calculation was implemented with the hMRI-Toolbox15 (https://github.com/hMRI-group/hMRI-toolbox). The MVF was estimated based on MTsat map following the calibration procedure in the literature 16–20, utilizing a subset of normal subjects (age range 20-30 years). AVF was assessed based on MVF, and NODDI-intracellular and isotropic volume fractions estimated from diffusion protocol imaging 18. The g-ratio aggregate measure combines AVF and MVF based on the formula developed by Stikov et. al. 201518.
The CC was segmented in Genu (GE), Anterior, Middle and Posterior Body (AB, MB, PB), Splenium (SP) using FreeSurfer v.5.0 (https://surfer.nmr.mgh.harvard.edu/) 21. Mean AVF, MVF, and g-ratio were calculated across voxels for each CC region.
An Analysis of Covariance (ANCOVA) was used to study differences between groups, with group and gender as main factors and age and total intracranial volume (TIV) as covariates. The association between CC microstructure and clinical variables (EDSS, number (NoL) and volume (VoL) of WM lesions and disease duration (DD)) was explored using linear regression, regressing out age, age2, gender, and TIV. A false discovery rate (FDR) was used to correct for multiple comparisons.
Age and gender were compared between groups with Independent t-test and Chi-square tests, respectively.
Results
No differences in age and gender were found between RRMS and HC groups. A significant main group effect was found for MVF in all CC segments (p<0.0001) (Figure 1). The post-hoc tests showed a decrease in RMSS vs HC, p<0.0001 (GE: Cohen-d size effect- d=0.59; AB: d=0.53; MB: d=0.57; PB: d=0.9; SP: d=0.99). AVF and g-ratio showed group effect only in PB and SP. For AVF, PB: d=0.36, p=0.0031 and SP: d=0.51, p=0.002. For g-ratio, an increase was found in RMSS vs HC, PB: d=-0.44, p=0.007 and SP: d=-0.47, p=0.003.MVF showed a strong negative association with NoL and VoL (p<0.0001) (Figure 2). AVF correlated with the NoL (p<0.01) in all CC segments except in PB. The g-ratio correlated with VoL in GE (t=-2.63, p=0.011) and PB (t=-2.3, p=0.021) but it is not associated with NoL. MVF and AVF in PB and SP were related to DD (p<0.05). EDSS correlated negatively with MVF only in GE (t=-2.81, p=0.005) and SP (t=-2.35, p=0.02).
Discussion and Conclusion
Microstructure measures related to axonal conduction velocity were affected in the NACT in RRMS patients, with MVF being the most altered. It is worth noting that microstructural damage in the NACT was related to the number and volume of lesions in other WM regions. The findings, may be therefore, explained by transneuronal degeneration or global degenerative processes simultaneously affecting white/gray matter although spatially heterogeneous. Interesting AVF and g-ratio of NACT were only affected in the posteriors regions (PB, SP). These are functionally related to somatosensory processing communicating homotopic parietal and occipital areas. Last, only myelin damage in the NACT of the genu and splenium related to patients' disability: future studies in progressive patients should confirm and expand these findings.Acknowledgements
Cristina Granziera is funded by the Swiss National Science Foundation (SNSF) grant PP00P3_176984References
1. Wahl M, Lauterbach-Soon B, Hattingen E, et al. Human Motor Corpus Callosum: Topography, Somatotopy, and Link between Microstructure and Function. J Neurosci. 2007;27(45):12132-12138. doi:10.1523/JNEUROSCI.2320-07.2007
2. Aboitiz F, Montiel J. One hundred million years of interhemispheric communication: The history of the corpus callosum. Brazilian J Med Biol Res. 2003;36(4):409-420. doi:10.1590/S0100-879X2003000400002
3. Fitsiori A, Nguyen D, Karentzos A, Delavelle J, Vargas MI. The corpus callosum: White matter or terra incognita. Br J Radiol. 2011;84(997):5-18. doi:10.1259/bjr/21946513
4. Innocenti GM, Ansermet F, Parnas J. Schizophrenia, neurodevelopment and corpus callosum. Mol Psychiatry. 2003;8(3):261-274. doi:10.1038/sj.mp.4001205
5. Zaidel E, Iacoboni M. The Parallel Brain : The Cognitive Neuroscience of the Corpus Callosum. MIT Press; 2003.
6. Bloom JS, Hynd GW. The role of the corpus callosum in interhemispheric transfer of information: Excitation or inhibition? Neuropsychol Rev. 2005;15(2):59-71. doi:10.1007/s11065-005-6252-y
7. Cumming WJK. An Anatomical Review of the Corpus Callosum. Cortex. 1970;6(1):1-18. doi:10.1016/S0010-9452(70)80033-8
8. Abel S, Vavasour I, Lee LE, et al. Myelin Damage in Normal Appearing White Matter Contributes to Impaired Cognitive Processing Speed in Multiple Sclerosis. J Neuroimaging. 2020;30(2):205-211. doi:10.1111/JON.12679
9. Abel S, Vavasour I, Lee LE, et al. Associations Between Findings From Myelin Water Imaging and Cognitive Performance Among Individuals With Multiple Sclerosis. JAMA Netw Open. 2020;3(9):e2014220-e2014220. doi:10.1001/JAMANETWORKOPEN.2020.14220
10. Helms G, Dechent P. Increased SNR and reduced distortions by averaging multiple gradient echo signals in 3D FLASH imaging of the human brain at 3T. J Magn Reson imaging JMRI. 2009;29(1):198-204. doi:10.1002/jmri.21629
11. Helms G, Dathe H, Kallenberg K, Dechent P. High-resolution maps of magnetization transfer with inherent correction for RF inhomogeneity and T 1 relaxation obtained from 3D FLASH MRI. Magn Reson Med. 2008;60(6):1396-1407. doi:10.1002/mrm.21732
12. Helms G, Dathe H, Dechent P. Quantitative FLASH MRI at 3T using a rational approximation of the Ernst equation. Magn Reson Med Off J Soc Magn Reson Med / Soc Magn Reson Med. 2008;59(3):667-672. doi:10.1002/mrm.21542
13. Weiskopf N, Suckling J, Williams G, et al. Quantitative multi-parameter mapping of R1, PD(*), MT, and R2(*) at 3T: a multi-center validation. Front Neurosci. 2013;7:95. doi:10.3389/fnins.2013.00095
14. Zhang H, Schneider T, Wheeler-Kingshott CA, Alexander DC. NODDI: Practical in vivo neurite orientation dispersion and density imaging of the human brain. Neuroimage. 2012;61(4):1000-1016. doi:10.1016/j.neuroimage.2012.03.072
15. Tabelow K, Balteau E, Ashburner J, et al. hMRI - A toolbox for quantitative MRI in neuroscience and clinical research. Neuroimage. 2019;194:191-210. doi:10.1016/J.NEUROIMAGE.2019.01.029
16. Cercignani M, Giulietti G, Dowell NG, et al. Characterizing axonal myelination within the healthy population: a tract-by-tract mapping of effects of age and gender on the fiber g-ratio. Neurobiol Aging. 2016;49:109-118. doi:10.1016/j.neurobiolaging.2016.09.016
17. Mohammadi S, Carey D, Dick F, et al. Whole-brain in-vivo measurements of the axonal G-ratio in a group of 37 healthy volunteers. Front Neurosci. 2015;9(NOV):1-13. doi:10.3389/fnins.2015.00441
18. Stikov N, Campbell JSW, Stroh T, et al. In vivo histology of the myelin g-ratio with magnetic resonance imaging. Neuroimage. 2015;118:397-405. doi:10.1016/j.neuroimage.2015.05.023
19. Slater DA, Melie-Garcia L, Preisig M, Kherif F, Lutti A, Draganski B. Evolution of white matter tract microstructure across the life span. Hum Brain Mapp. 2019;40(7). doi:10.1002/hbm.24522
20. Mancini M, Giulietti G, Dowell N, et al. Introducing axonal myelination in connectomics: A preliminary analysis of g-ratio distribution in healthy subjects. Neuroimage. 2018;182:351-359. doi:10.1016/J.NEUROIMAGE.2017.09.018
21. Dale AM, Fischl B, Sereno MI. Cortical Surface-Based Analysis: I. Segmentation and Surface Reconstruction. Neuroimage. 1999;9(2):179-194. doi:10.1006/NIMG.1998.0395
Figures
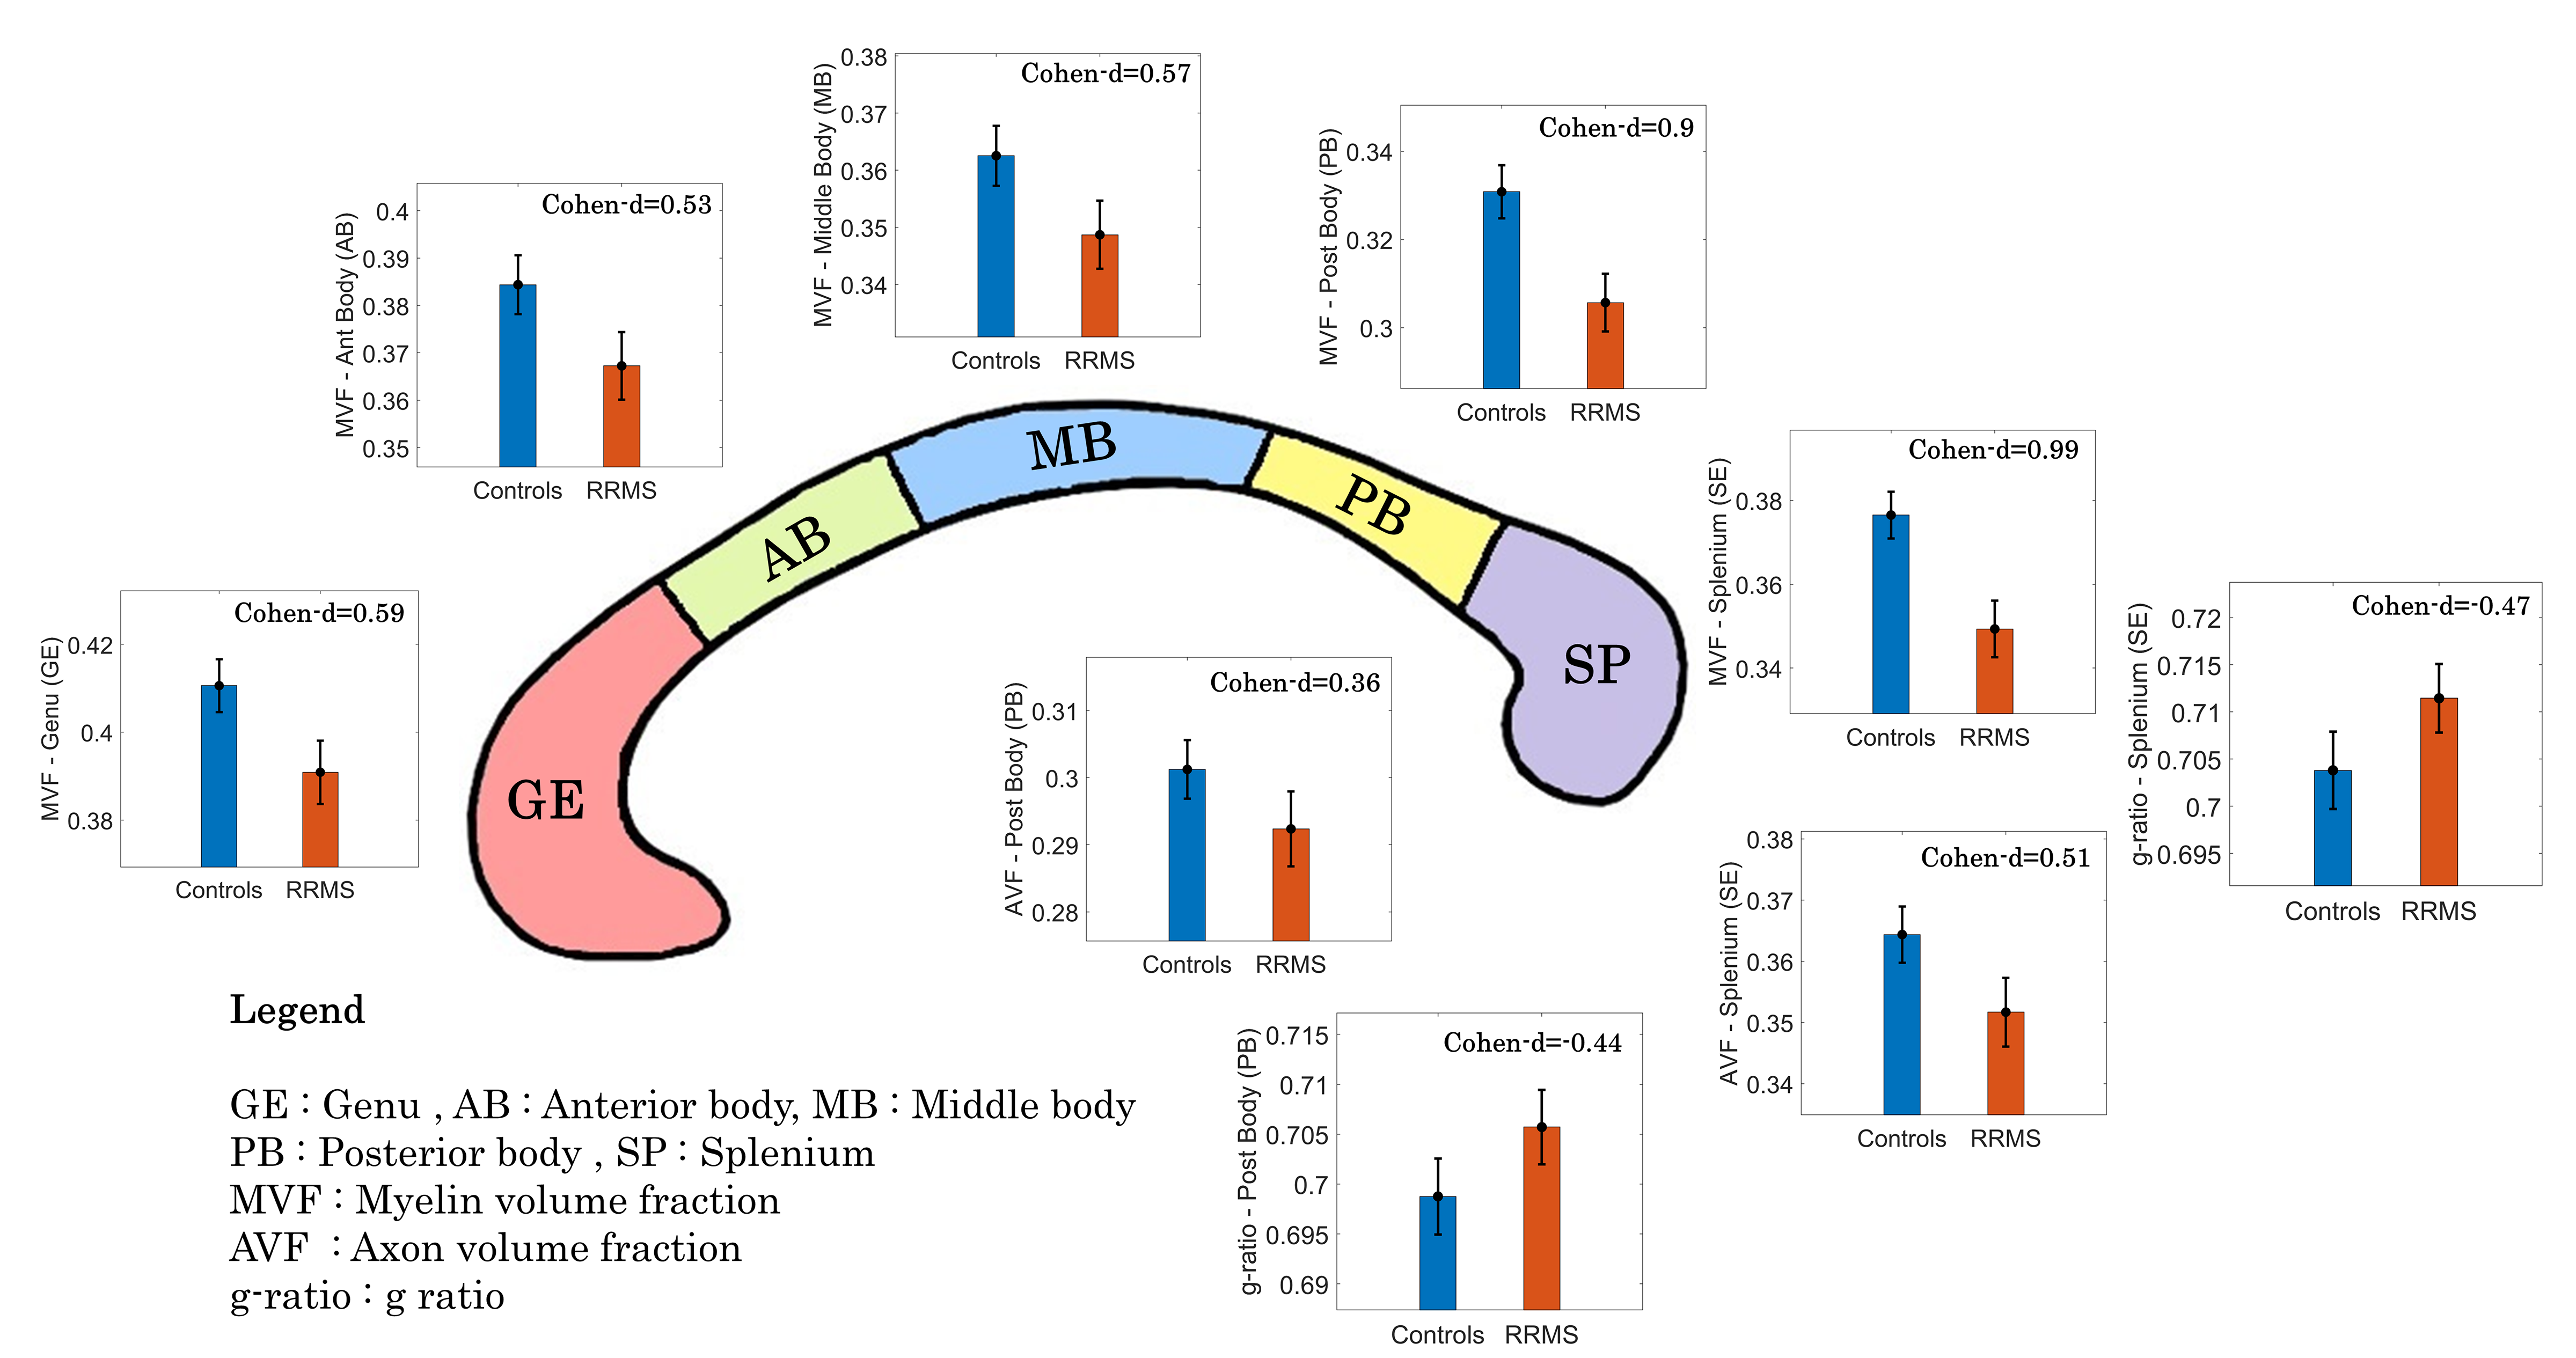
Figure 1.
Significant differences Controls vs. RRMS in CC microstructure properties.
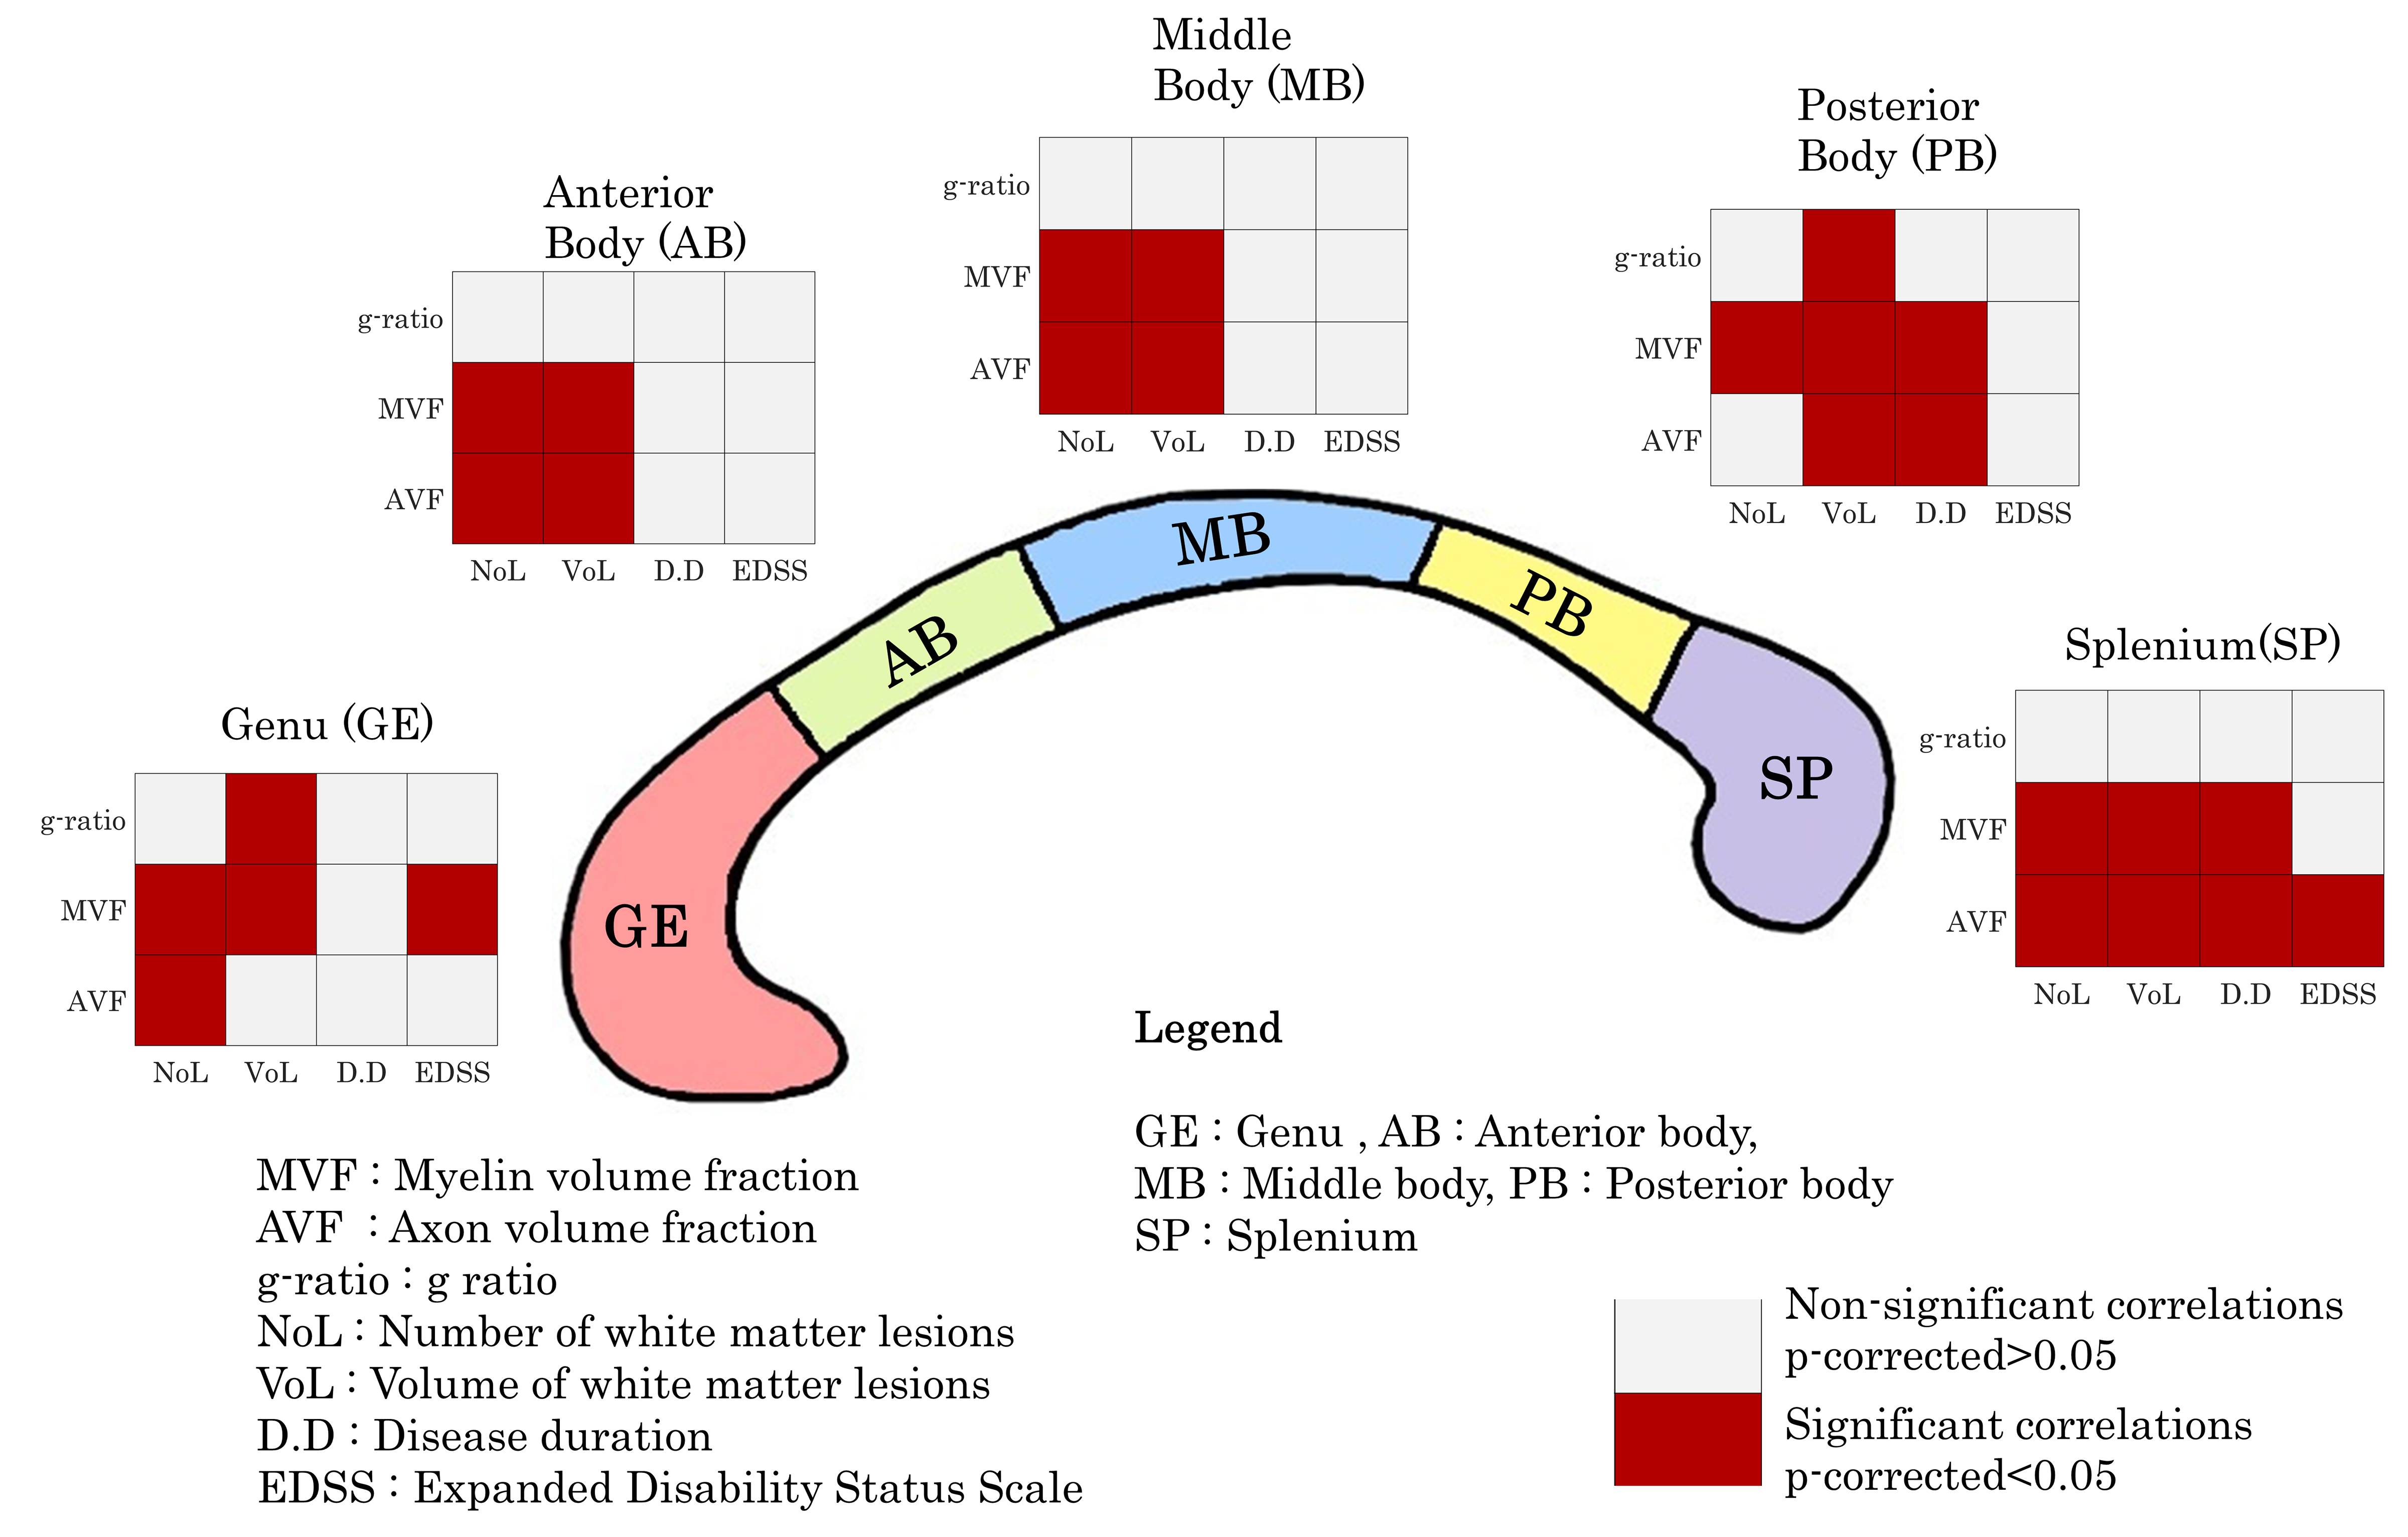
Figure 2. Correlation of CC
microstructure properties with clinical variables.
DOI: https://doi.org/10.58530/2022/4512