4511
Performance of Short, Gradient Modulated RF Pulses due to Asynchrony Between RF and Gradient Waveforms1Radiology and Biomedical Imaging, Yale University, New Haven, CT, United States
Synopsis
The effect of asynchrony between RF and gradient modulated (GM) waveforms on the performance of 3 ms gradient modulated GOIA-WURST RF pulses (BW = 15 kHz) was evaluated in simulation and experimentally. Results demonstrate that a 20+ μs asynchrony between RF and GM functions substantially degrades inversion performance when using large RF offsets to achieve translation. A projection-based method is presented that was used to calibrate RF and GM asynchrony on a 4T human MR system, where a ~40 µs asynchrony was present. The projection method allows a quick calibration of RF and GM asynchrony on pre-clinical/clinical MR systems.
Introduction
Proton magnetic resonance spectroscopy (MRS) is a powerful technique that can measure levels of neurochemicals in the brain, non-invasively. MRS at higher magnetic field strengths (> 3 T) provides improved sensitivity and increased spectral dispersion, resulting in improved spectral quantification. However, higher field strengths also result in larger chemical shift displacement (CSD) artifacts, but can be minimized by high bandwidth (BW) RF pulses. Gradient modulated RF pulses, specifically gradient offset independent adiabaticity (GOIA) pulses1, have been shown to provide an order of magnitude improvement in CSD, relative to an adiabatic full passage (AFP) counterpart, while operating at clinically compatible peak and time averaged power requirements. Thus, short duration GOIA pulses (with Tp < 4 ms) are routinely used to realize short echo time (TE) LASER/sLASER localization methods for MRS and MRSI2,3. In this work we investigate performance of short GOIA pulses subject to asynchrony between RF and GM waveforms.Theory
In comparison to AFP pulses, gradient modulated pulses require a time-varying gradient field. Proper operation of gradient-modulated RF pulses necessitates that the RF amplitude AM(τ), RF frequency FM(τ), and gradient GM(τ) modulations experienced within the region of interest (ROI) are synchronized and reproduced without distortion. High fidelity can be compromised if slew rate of the GM waveform approaches the maximum slew rate of the system gradients, and if other imperfections such as gradient oscillations are present. Furthermore, insufficient sampling of the gradient waveform was recently reported to degrade localization profiles with spatial offset4. In this work we limit the practical considerations to effects due to asynchronous pulsation of the RF and gradient waveforms. Noting that AM(τ) and GM(τ) functions are part of the RF pulse, an asynchrony can be present between the RF amplifier and gradient amplifier leading to a situation where the gradient function experimentally isGMexp(τ) = GM(τ + δ) (1)
where δ is defined such that a positive/negative delay corresponds to the gradient waveform leading/lagging the RF pulse, respectively. Here
GM(τ) = GA·F3(τ) (2)
where GA is the gradient amplification factor, and F3(τ) is the gradient modulation waveform for a given GOIA RF pulse. Spatial translation of the inversion profile is achieved by modifying the RF pulse FM according to
FM(τ) = A·F2(τ) + ΔνRF·F3(τ) (3)
Whereby ΔνRF represent the frequency offset required for an equivalent BW non-GM RF pulse.
Methods
1-D Bloch simulations of Mz/M0 vs B1 amplitude were generated for a previously described 3 ms GOIA-WURST (12-4, 7) pulse5 subjected to a delay between RF and GM waveforms. A sLASER MRS method was developed, utilizing the GOIA-WURST(12-4,7) pulse to evaluate localization profiles with varying delays experimentally. All MR experiments were performed on a 4 T 94 cm Medspec scanner (Bruker corporation. Ettlingen, Germany).Results
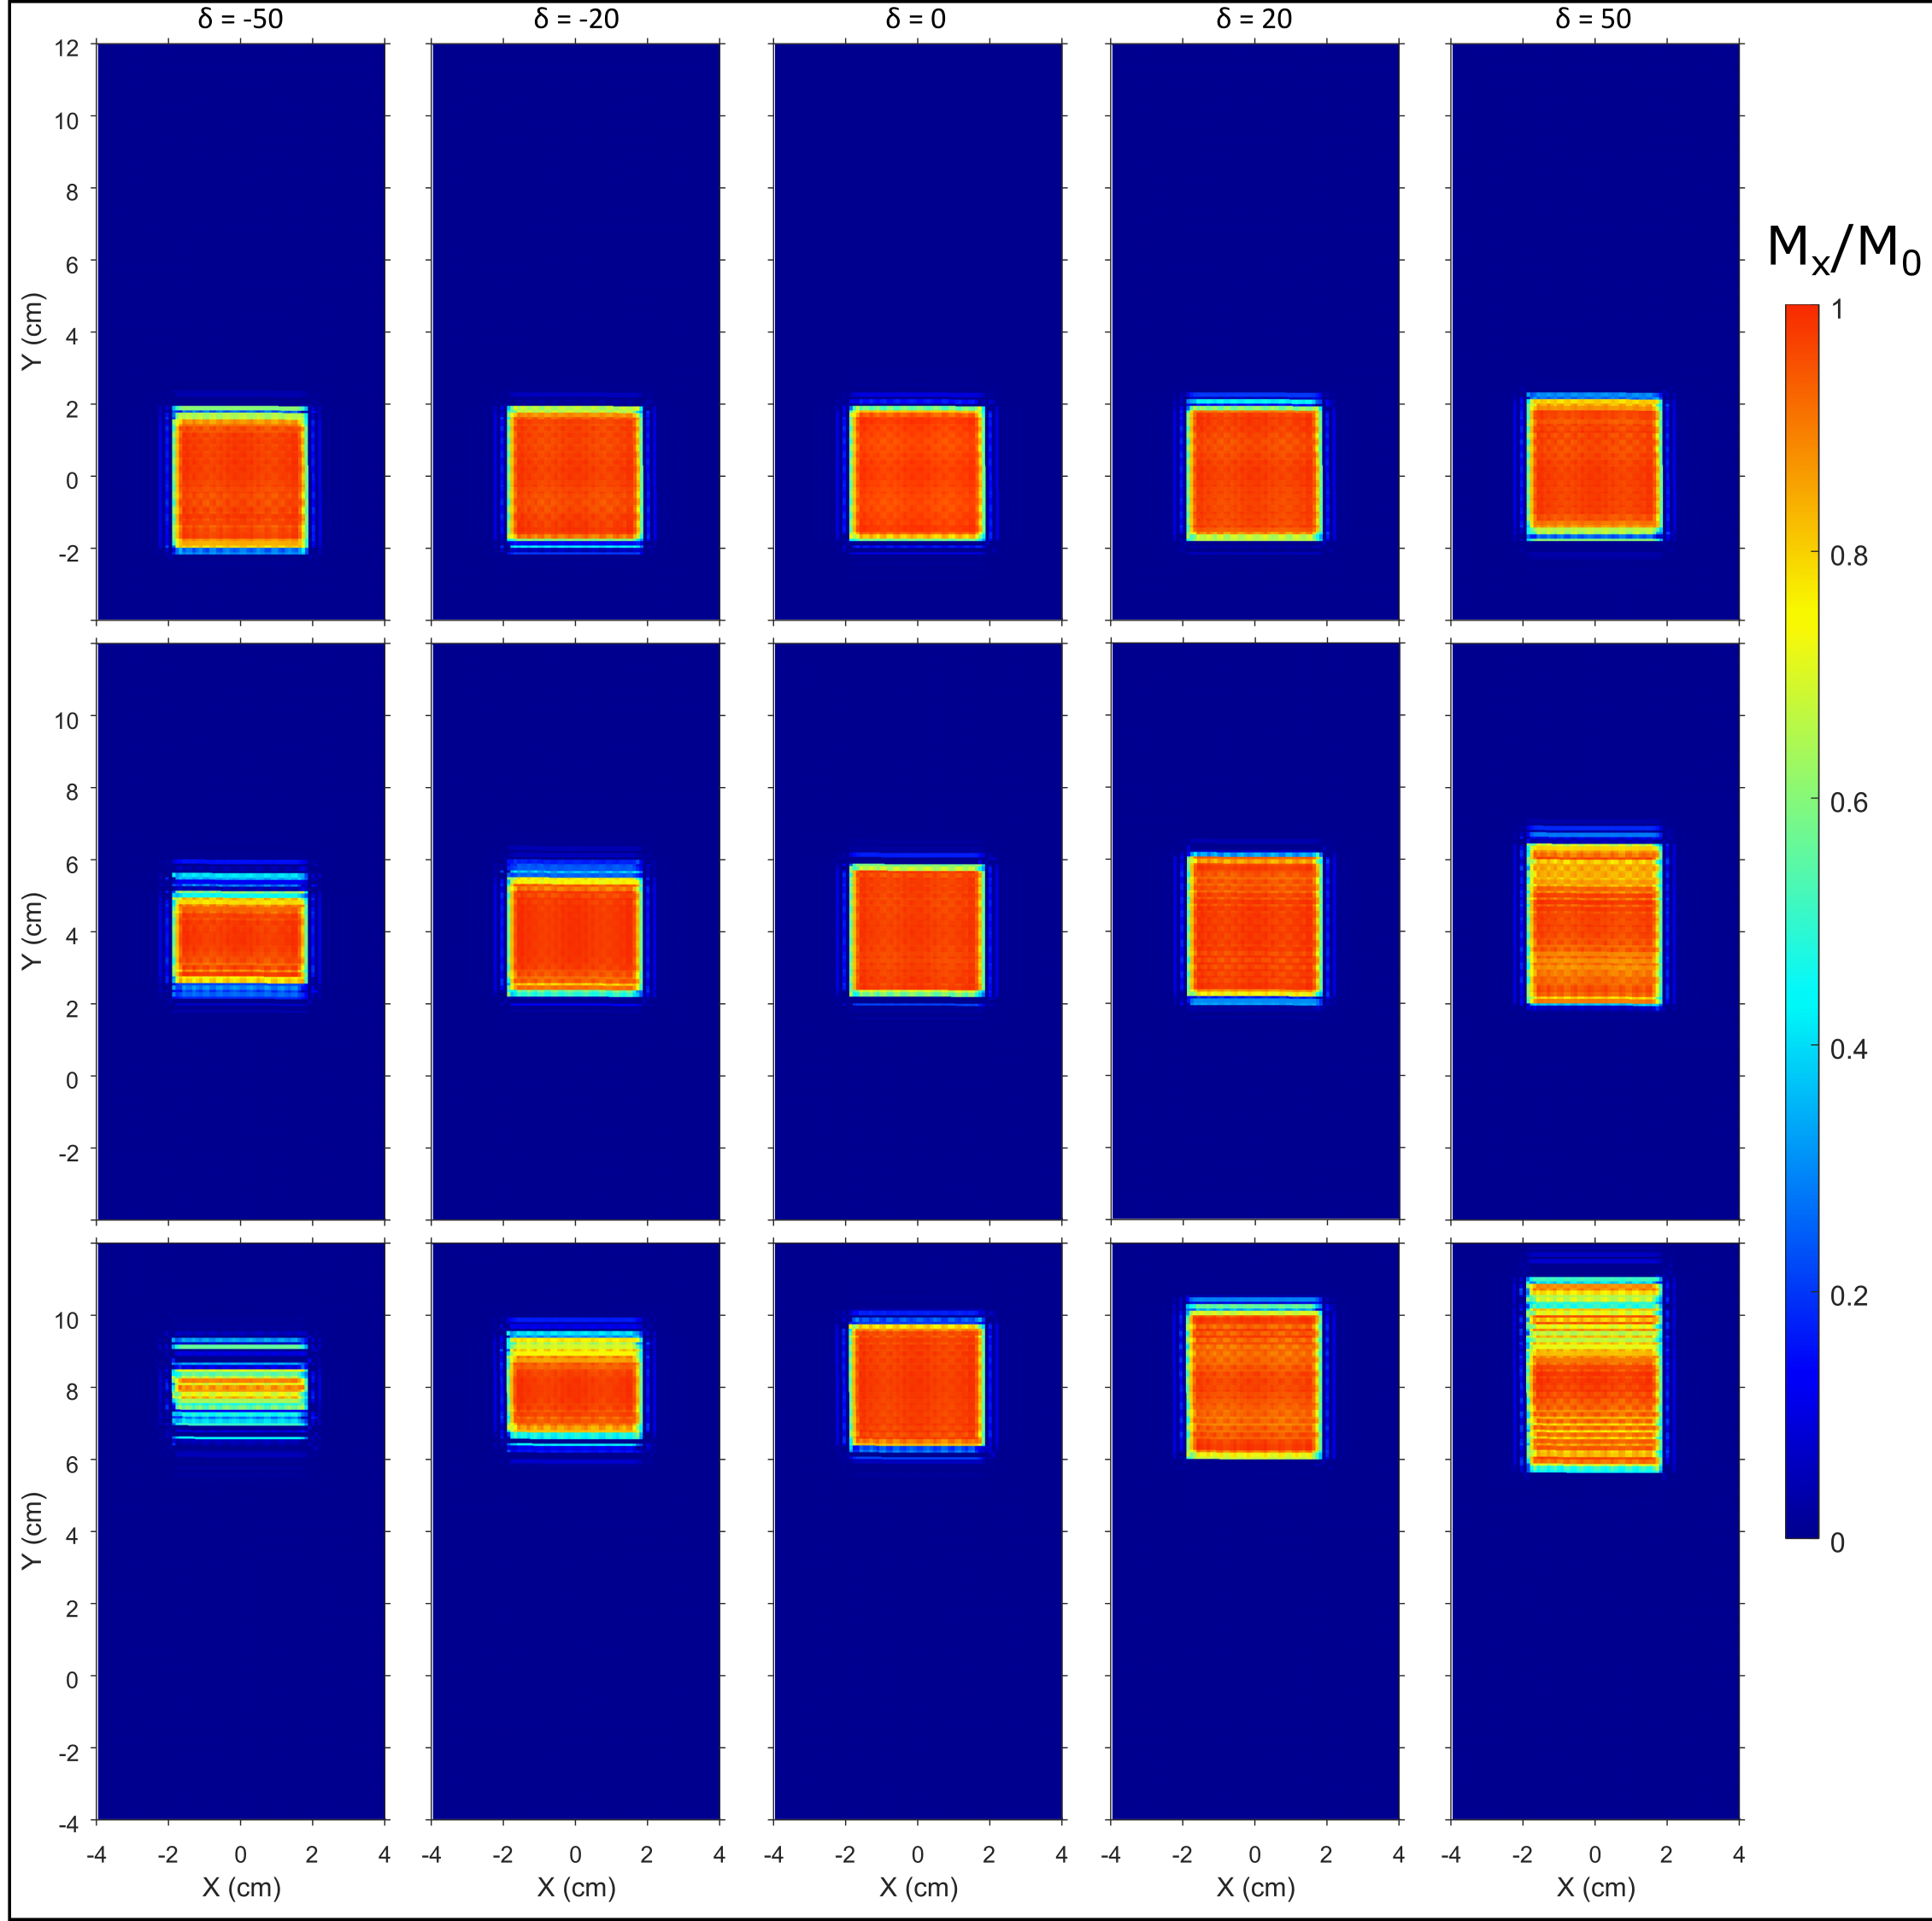
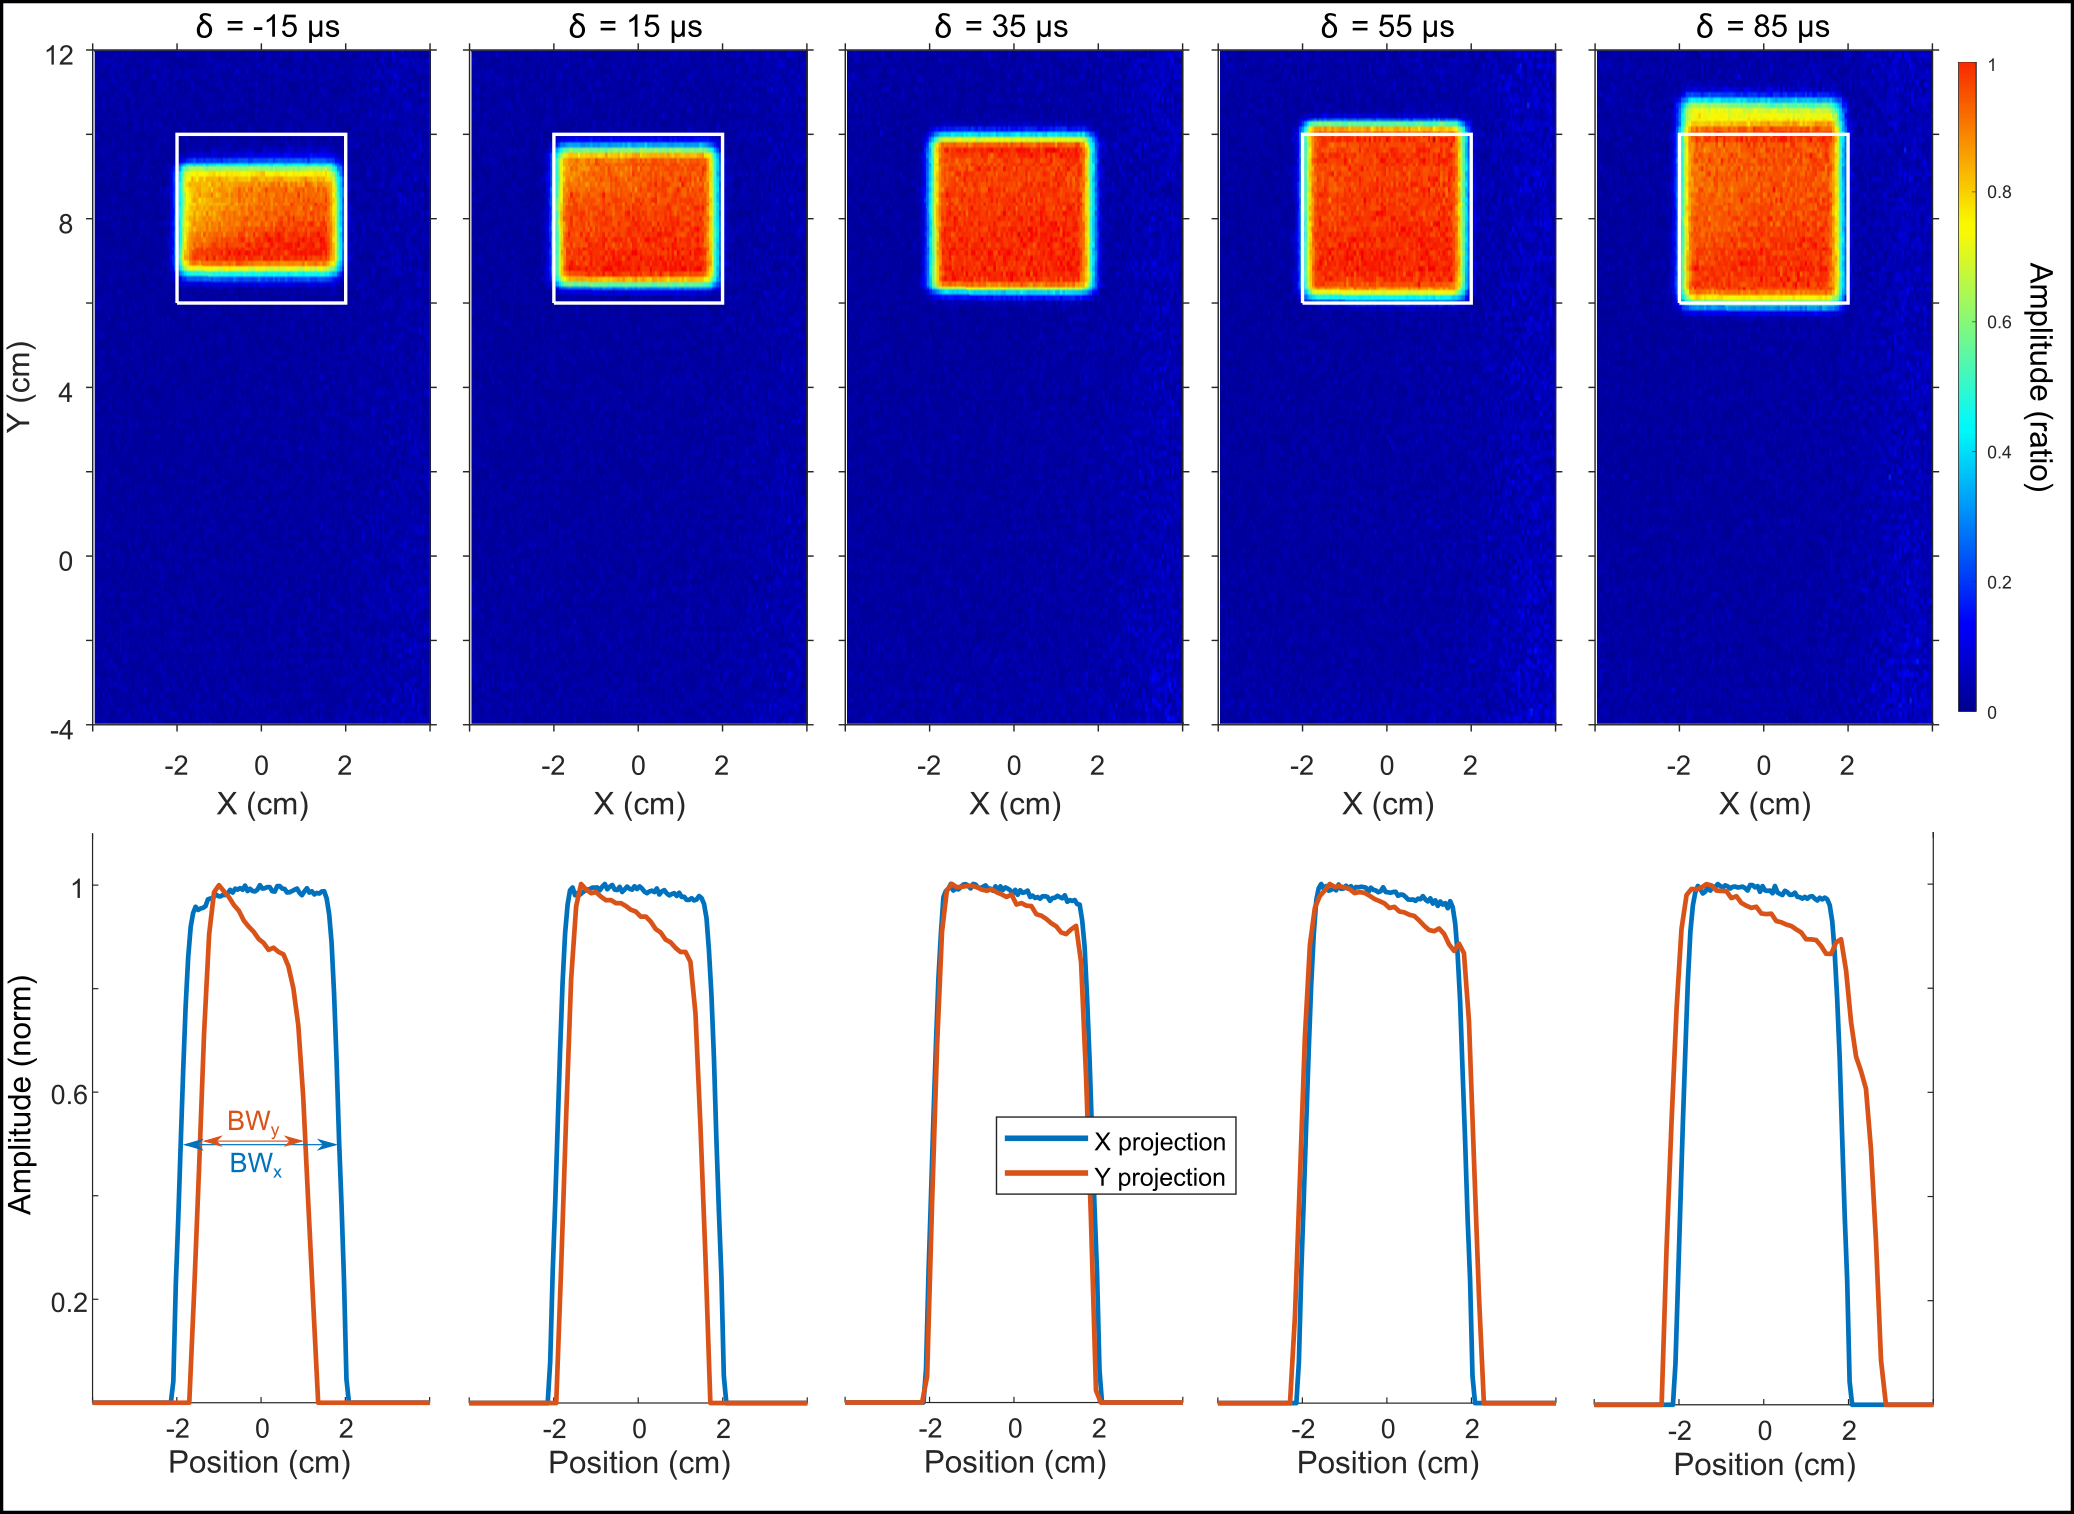
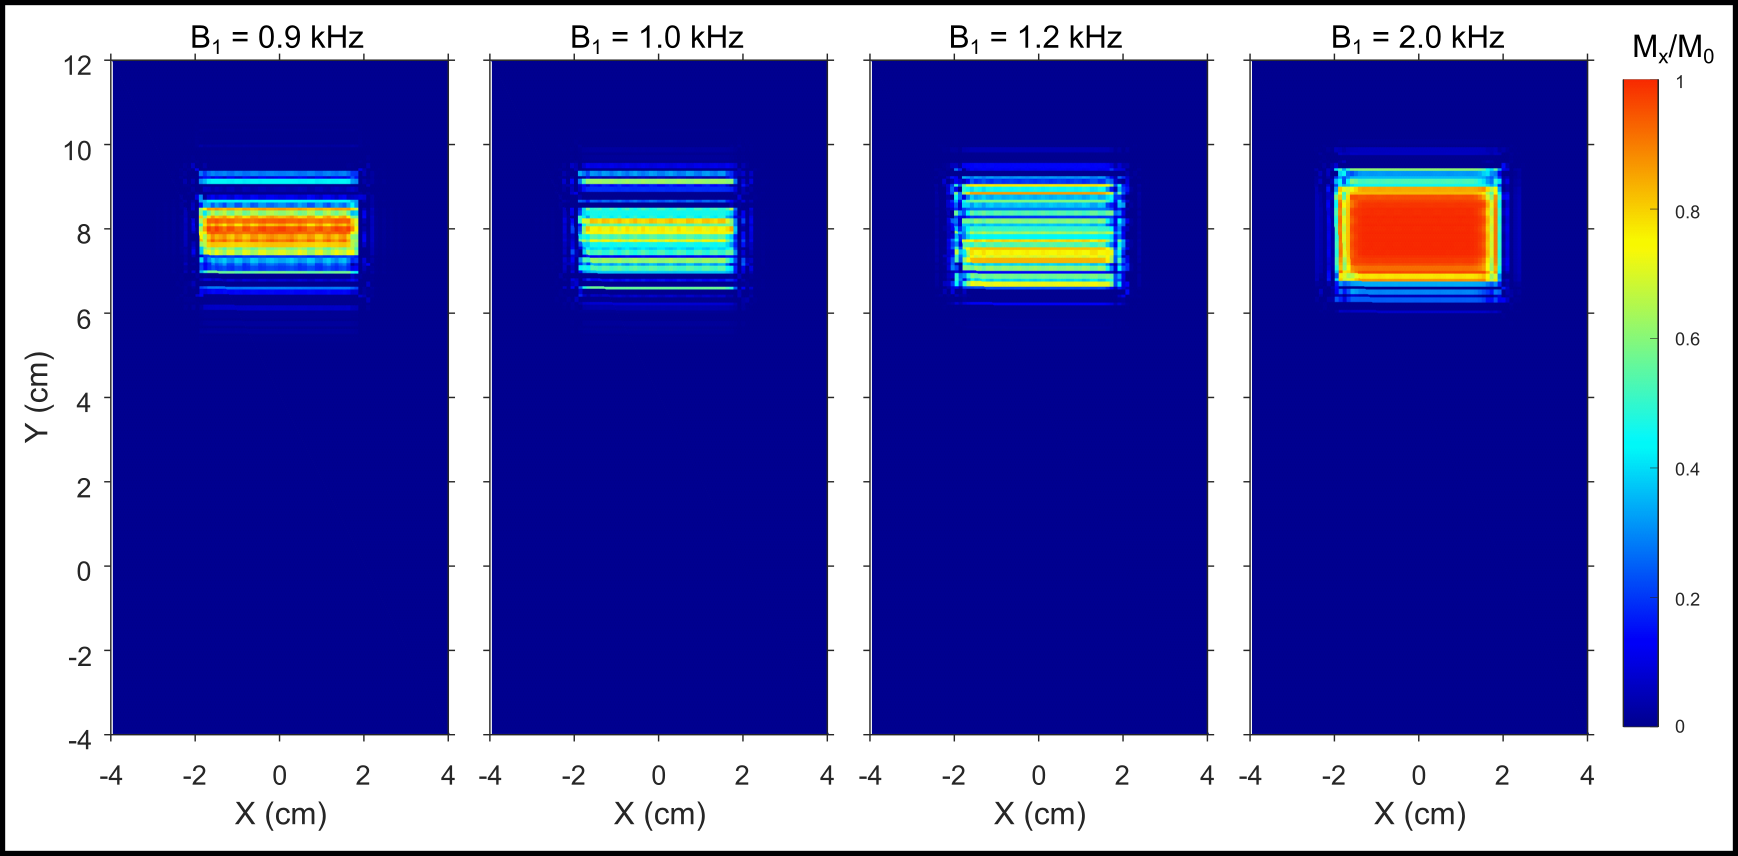
Simulated localization profiles for a 3 ms GOIA-WURST(12-4,7) pulse are illustrated in Figure 1 with spatial offsets and δ delays. The peak B1 amplitude was set at 0.95 kHz (a ~10% overdrive relative to B1, 95%). The top row of localization profiles demonstrates that a δ delay spanning -50 to +50 µs has negligible effect on localization performance for non-translated voxel placements. However, translation along the y-axis (middle and bottom rows) results in a distorted profile along the y-axis and reduced signal amplitude when | δ | > 0 and are accentuated with increased RF offset or increased lead/lag between gradient and RF components. Experimental localization profiles with the GOIA-WURST (12,4-7) pulse, similar to those in Figure 1, for an 8 cm offset with δ delays spanning - 50 to + 50 µs is illustrated in Figure 2. Below each 2D profile the corresponding x-projection, and y-projection are illustrated. Similar to simulation findings, the y-projection is reduced for δ < 0, and elongated for δ > 0. Simulation findings demonstrate that a discrepancy in x and y dimensions for an isotropic voxel (in 2D) to be a result of |δ| > 0, and can easily be calibrated out by comparing x and y projection slice bandwidths as illustrated in the lower panel of Figure 2. Based on a third order polynomial fit of BW as a function of δ, δ was determined to be + 39.5 ± 1.2 µs, specific to our Bruker 4 T system. The undesired localization of |δ| > 0 can be partially compensated with increased peak B1 as illustrated in Figure 3, hence calibration should be performed at a B1 ~ B1, 95% to maintain sensitivity to the profile distortion.Discussion
A discrepancy of δ = ± 20 µs between RF and GM waveforms was directly observable with 40 x 40 mm2 voxel projections acquired at a 30 kHz RF offset (8 cm translation) for the 3 ms GOIA-WURST (12,4-7) pulse. This demonstrates that a projection-based calibration is practical and straightforward on clinical systems utilizing short GOIA pulses. The GOIA pulse under test, and its phase reversed counterpart can alternatively be used to calibrate δ, whereby δ needs to be adjusted till identical localization profiles are achieved with both pulses at a large RF offset.Acknowledgements
This research was supported by NIH grant R01- EB014861.References
[1] Tannus A, Garwood M. Adiabatic pulses. NMR in Biomedicine 1997;10(8):423–434.
[2] Andronesi OC, Ramadan S, Ratai E, Jennings D, Mountford C, Sorensen AG. Spectroscopic imaging with improved gradient modulated constant adiabaticity pulses on high-field clinical scanners, Journal of Magnetic Resonance 2010; 203: 283-293.
[3] Deelchand DK, Berrington A, Noeske R, et al. Across-vendor standardization of semi-LASER for single-voxel MRS at 3T. NMR in Biomedicine 2019;e4218.
[4] van der Veen J, shen J. Effect of digitization in gradient modulation adiabatic pulses with a spatial offset. Proceedings of the Anuual Joinnt Meeting ISMRM, Virtual-2021; 1995.
[5] Kumaragamage C, Coppoli A, Brown P, McIntyre S, Nixon T, De Feyter H, Mason G, and de Graaf R. Short-TE ECLIPSE for Macromolecular-Nulled MRSI in the Human Brain. Proceedings of the Anuual Joinnt Meeting ISMRM, Virtual-2021; 0287.
Figures