4499
Experimental and Numerical Simulation of the Miniature Flexible Coil for High-SNR Pituitary MRI1Electrical and Computer Engineering, University of California Los Angeles, Los Angeles, CA, United States, 2Department of Radiological Sciences, University of California Los Angeles, Los Angeles, CA, United States, 3Department of Neurosurgery, University of California Los Angeles, Los Angeles, CA, United States, 4Department of Radiology, University of Utah, Salt Lake City, UT, United States, 5California NanoSystems Institute, Los Angeles, CA, United States
Synopsis
We simulate and experimentally verify SNR improvement from a miniature flexible coil with the ultimate goal to identify microadenomas in the pituitary gland that are currently undetectable. Through scans of a phantom at multiple angles, we show a maximum of 12 to 20 times, and a minimum of 2 to 4 times of SNR improvements compared to the commercial head coil. We also perform high-resolution PD-TSE scans to confirm the visual improvement of our flexible coil.
INTRODUCTION
There is a strong clinical need to improve the resolution of pituitary MRI1,2. Cushing’s disease is a potentially fatal disorder that is typically caused by small pituitary tumors, microadenomas. The median size of microadenomas is 5mm3, and a significant percentage of them are less than 3mm in size4. A novel miniature flexible coil was recently developed to increase the SNR of pituitary MRI by placing it close to the pituitary gland intra-operatively5. In this study, we measure the potential SNR improvement of the flexible coil compared to a commercial head coil, validated by both experiments and a numerical simulation model.METHODS
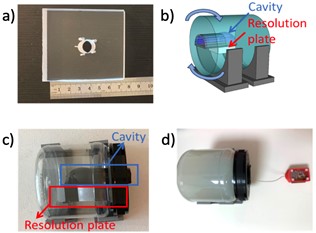
Clinical proton density turbo spin echo (PD-TSE) scans were performed for both the miniature coil and a Siemens commercial head coil using 3T Siemens Prisma scanner (Siemens Healthineers, Erlangen, Germany). An agar phantom and an acrylic resolution plate were designed for the scanning, and a 3D printed igloo cavity was placed in the phantom to mimic the sphenoid sinus (Figure 1). The coil was placed inside the cavity during the scanning. The SNR improvement was measured with various rotation angles relative to the B0 field6.Coil Performance Simulation:
A 3D coil model was developed in COMSOL Multiphysics® (COMSOLAB, Stockholm, Sweden) to study the magnetic field distributions of the coil. The amplitude of the effective transverse field at a rotation angle θ at the resonance frequency was simulated and then compared with the MRI scan results:
$$B_{1xy~effective}= \sqrt{ B_{1x}{B_{1x}}^{*} +(B_{1y}\cdot cos \theta- B_{1z}\cdot sin \theta){(B_{1y}\cdot cos \theta- B_{1z}\cdot sin \theta)}^{*} }$$
where B1x, B1y, and B1z are the magnetic field components for our RF receiving coil in x, y, z directions at θ = 0°.
SNR Measurements:
For the flexible coil, SNR measurements were calculated for each angle from two repeated multi-slice 2D clinical PD-TSE scans. The region of interest (ROI) was divided into five cylindrical slices, each with 1cm diameter and 3mm thickness, with a size comparable to a typical pituitary gland7. SNR was calculated with methods described by Constantinides et al. for magnitude images of a single-coil array8.
For the 20-channel commercial head coil, the SNR was calculated based on Kellman’s method for root-sum-of-squares magnitude combining images9. Two repeated noise only scans and two repeated clinical PD-TSE scans were used for the calculation.
High-resolution MRI Scans:
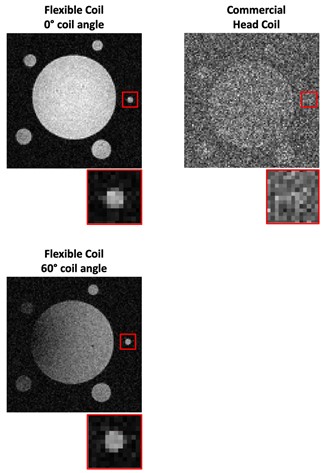
To assess the visual improvement of the flexible coil, a high-resolution 2D PD-TSE sequence of voxel size 0.2 × 0.2 × 0.7 mm3 was scanned for both the miniature coil and the commercial head coil. Images were reconstructed directly via inverse Fast Fourier Transform (iFFT). The head coil images were sum-of-square combined after coil reduction.
RESULTS
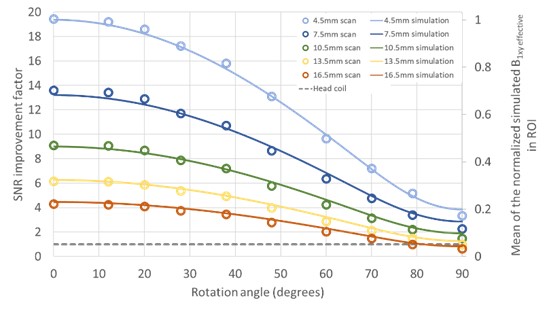
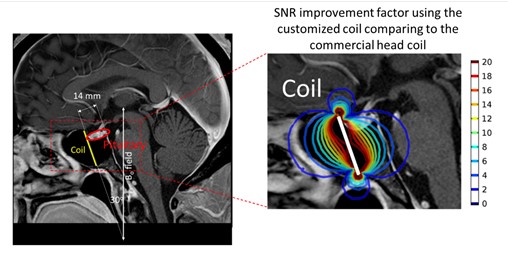
The mean SNR of the ROI in the phantom scan using the miniature coil were compared with the mean SNR using the head coil at various rotation angles and distances below the coil. The factor of the SNR improvement is shown in Figure 2. The mean B1xy effective field within the ROI from the simulation was also plotted in Figure 2, normalized based on the maximum field at 4.5 mm below the coil. The mean of the simulated effective field agrees with the mean of scan experiment SNR with an error of 1.1% ± 0.8%.An example of the hypothetical miniature coil surgical placement with the simulated SNR improvement in the pituitary region is shown in Figure 3. The gradient line represent the SNR improvement factor of the coil compared to the head coil. In this case, the pituitary gland enjoys a 12 to 20 times of SNR improvement at the region close to the coil, and at least 2 to 4 times of SNR improvement at the region further away. To show the improved quality of phantom images, high-resolution PD-TSE images from the head coil and the miniature coil are shown in Figure 4. Though the SNR decreases with increasing rotation angle, the image SNR is high enough to clearly show the 1 mm hole on the resolution plate.
DISCUSSION
Comparison of SNR between the miniature coil and the head coil demonstrates the potential of the miniature coil to be used for high-resolution pituitary MRI. A maximum of 20-fold SNR improvement is achieved. Within θ = 60° and a depth of 16.5 mm, the miniature coil maintains a reasonably high SNR for pituitary MRI that is at least 2 times higher than the commercial head coil. Validated with the scan experiment, this coil simulation model is helpful for optimizing the coil designs for future studies and predicting the SNR results for specific patients, which is much more convenient and more cost and time-efficient than conducting MRI scans. Simulations could also be used to select from a menu of coils to find the optimal coil for each patient, as the anatomy of the sphenoid sinus can vary between patients.CONCLUSION
A flexible miniature coil has been developed for high-SNR pituitary gland MRI scanning. This work demonstrated an improved SNR (between a factor of 12 and 20) and improved quality of phantom images of the coil. The retrospective surgical placement example showed the feasibility of using the simulation model to streamline and accelerate the future coil designs.Acknowledgements
This study was supported by the DGSOM Seed Grant Program Award (The Spitzer Grant Research Program) and American Association of Neurological Surgeons.References
1.Chittiboina P, Talagala SL, Merkle H, et al. Endosphenoidal coil for intraoperative magnetic resonance imaging of the pituitary gland during transsphenoidal surgery. J Neurosurg. 2016;125(6):1451-1459. doi:10.3171/2015.11.JNS151465
2.Law M, Wang R, Liu CSJ, et al. Value of pituitary gland MRI at 7 T in Cushing’s disease and relationship to inferior petrosal sinus sampling: Case report. J Neurosurg. 2018;1-5. doi:10.3171/2017.9.JNS171969
3.Jagannathan J, Smith R, Devroom HL, et al. Outcome of using the histological pseudocapsule as a surgical capsule in Cushing disease. J Neurosurg. 2009;111(3):531-539. doi:10.3171/2008.8.JNS08339
4.Hamid O, Fiky L El, Hassan O, Kotb A, Fiky S El. Anatomic Variations of the Sphenoid Sinus and Their Impact on Trans-sphenoid Pituitary Surgery. Skull Base. 2008;18(1):9-15. doi:10.1055/S-2007-992764
5.Lin J, Hadley R, Li L, Merrill R, Bergsneider M, Candler R, Sung K. Development of a Local Pituitary Coil for Assessment of Pituitary Microadenomas. Proc ISMRM. 2019.
6.Lin J, Liu S, Hadley R, Bergsneider M, Prashant G, Peeters S, Candler R, Sung K. Exploration of the Surgical Placement of the Local Pituitary Coil for Microadenomas. Proc ISMRM. 2021.
7. Amar AP, Weiss MH. Pituitary anatomy and physiology. Neurosurg Clin N Am. 2003;14(1):11-v. doi:10.1016/S1042-3680(02)00017-7
8.Constantinides CD, Atalar E, McVeigh ER. Signal-to-noise measurements in magnitude images from NMR phased arrays. Magn Reson Med. 1997;38(5):852-857. doi:10.1002/mrm.1910380524
9. Kellman P, McVeigh ER. Image reconstruction in SNR units: a general method for SNR measurement. Magn Reson Med. 2005;54(6):1439-1447. doi:10.1002/mrm.20713
Figures