4494
Determining Relative Diglyceride to Triglyceride Levels with STEAM MRS at 3 T1Department of Oncology, University of Alberta, Edmonton, AB, Canada, 2Department of Medical Physics, Cross Cancer Institute, Edmonton, AB, Canada
Synopsis
Diglyceride levels have been found elevated with some disease. Previously, STEAM (mixing time=TM=20ms) with an echo time (TE) of 100ms was shown to resolve triglyceride glycerol resonances from that of water of 3T while yielding adequate glycerol signal. The purpose of this work is to determine if STEAM with a TE of 100ms facilitates relative quantification of diglyceride/triglyceride levels at 3 T. Spectra were measured from phantoms containing 1,3-dicaprylin/tricaprylin with varying weight/weight contents of 2.5%/97.5%, 5%/95%, 10%/90% and 20%/80%. Concentration ratios of 1,3-dicaprylin/tricaprylin estimated from STEAM (TM=20ms, TE=100ms) resulted in a linear correlation with expected concentration ratios (R2 > 0.99).
Introduction
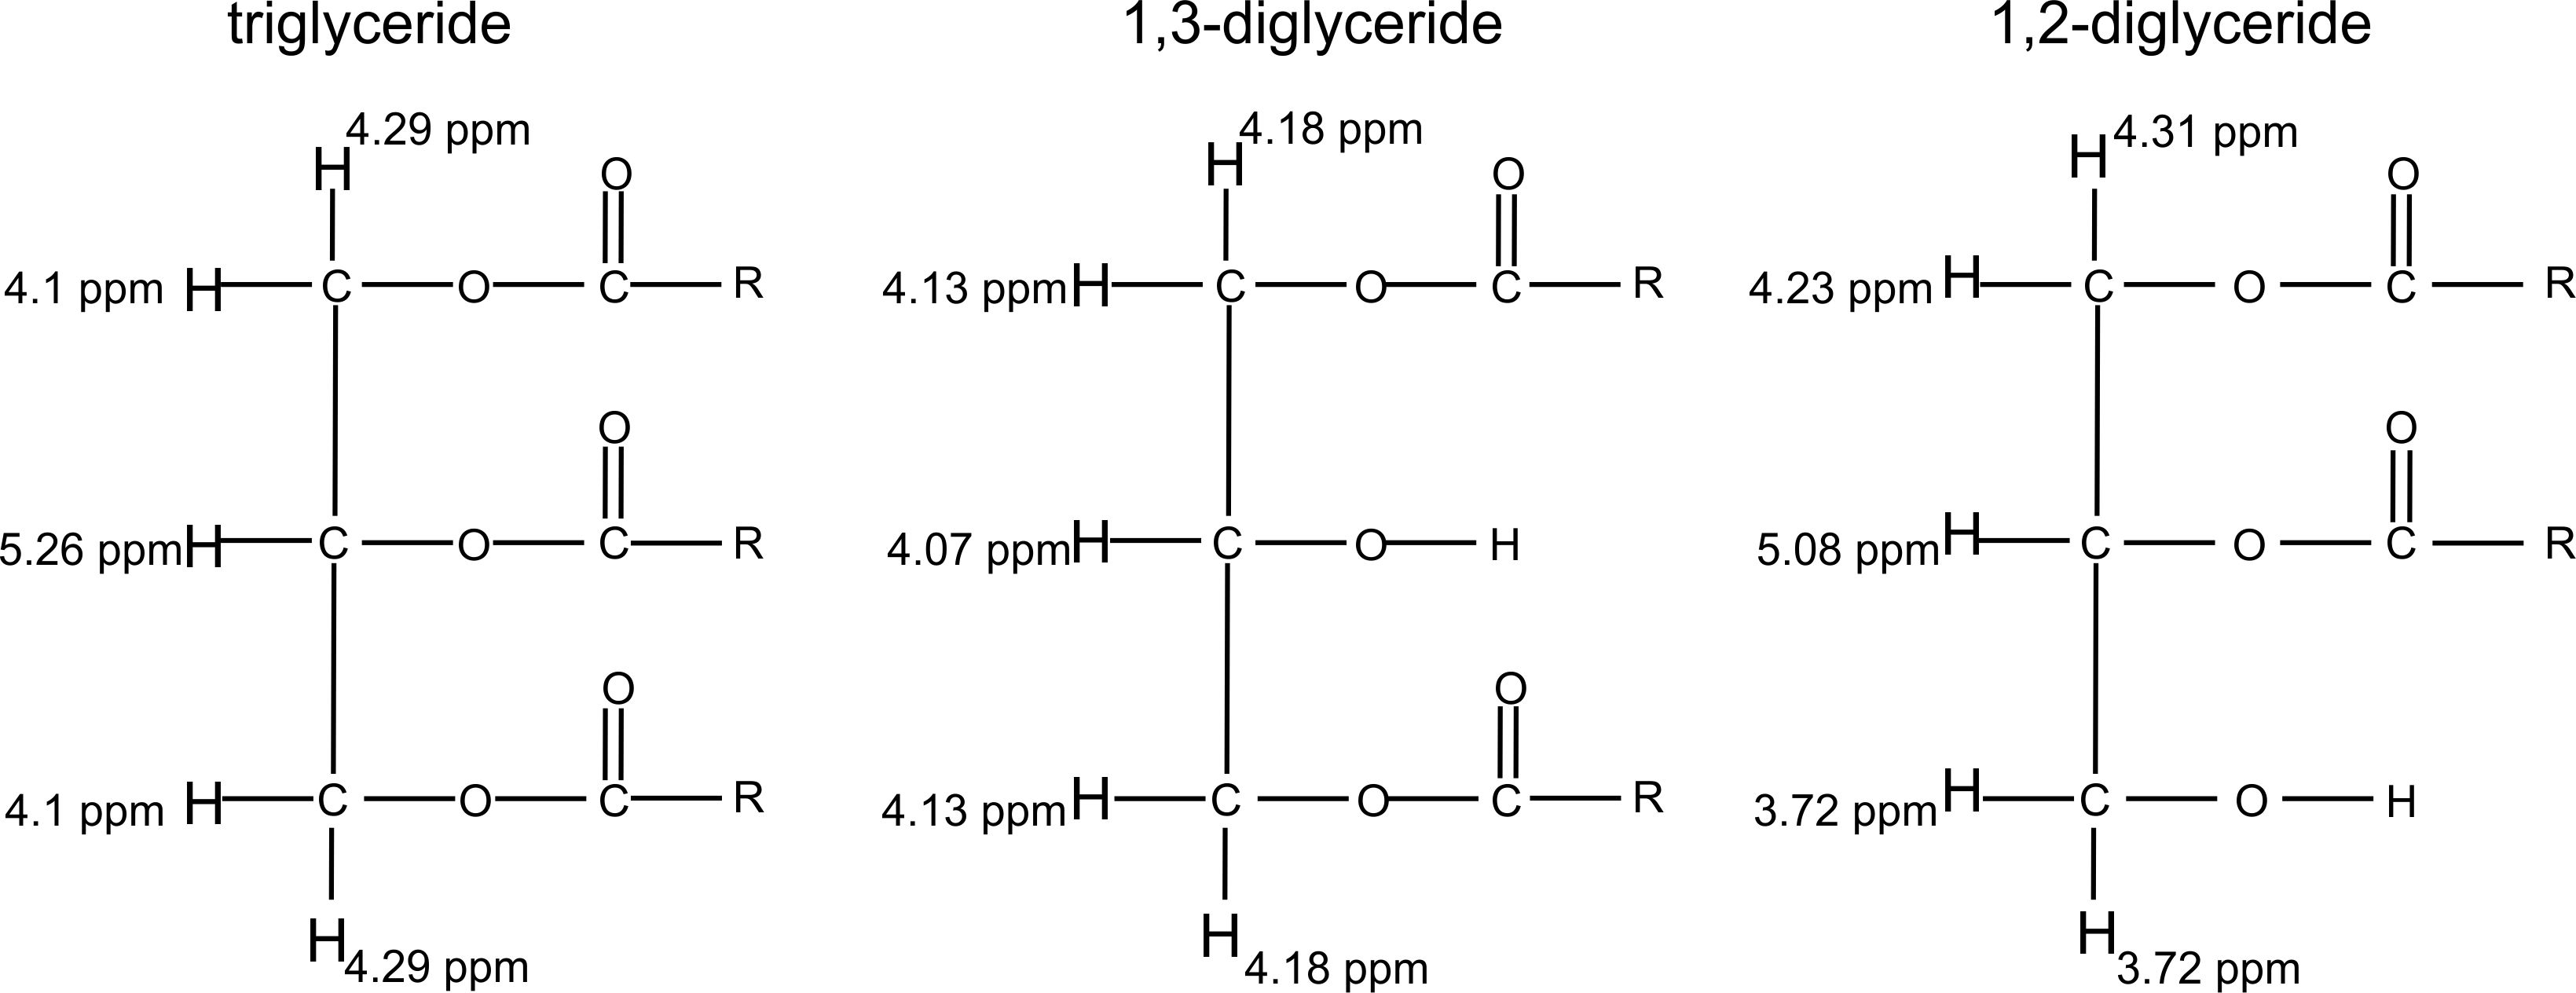
Body fat is primarily stored in the form of triglycerides; however, elevated diglyceride levels have been reported with liver disease (1,2) and with elevated levels of adrenocorticotropic hormone (3). Therefore, it is of interest to be able to estimate relative levels of diglycerides and triglycerides with magnetic resonance spectroscopy (MRS) in vivo. The molecular structures of a triglyceride, a 1,3-diglyceride, and a 1,2-diglyceride are shown in Figure 1 (4-6). Chemical shifts of the diglyceride glycerol protons differ for 1,3- and 1,2-diglycerides. It has been reported that 60-70 % of diglycerides are in the 1,3 form in oils (7,8). Triglyceride glycerol proton resonances in the 4 – 4.5 ppm spectral range overlap with those from diglyceride protons. Resonances outside that region include peaks from the C2 protons of triglycerides at ≈ 5.3 ppm, 1,2-diglycerides at ≈ 5.1 ppm, and the ≈ 3.7 ppm 1,2-diglyceride peak. The J-coupling evolution response of the triglyceride glycerol protons (4 – 4.5 ppm) have been previously characterized (9). It was found that STEAM (STimulated Echo Acquisition Mode) with an echo time (TE) of 100 ms resolved the glycerol resonances from that of water (about 4.7 ppm) at 3 T while yielding adequate glycerol signal (9). The objective of this work is to investigate the response of diglyceride glycerol resonances to STEAM to assess whether a TE of 100 ms enables relative quantification of diglycerides to triglycerides.Methods
Experiments were performed with a 3 T Philips MRI scanner using a transmit/receive radiofrequency (RF) birdcage head coil. STEAM (TE = 100 ms, mixing time, TM = 20 ms) spectra were acquired from tricaprylin (a triglyceride) and dicaprylin (1,3- and 1,2- diglyceride) as 2048 complex data points sampled at 2000 Hz from 10 x 10 x 10 mm3 voxels (repetition time = 3 seconds, signal averages = 32). Spectra were also acquired from four custom made phantoms (Nu-check Prep, Inc.), containing mixtures of w/w content of 1,3-dicaprylin and tricaprylin of 2.5%/97.5%, 5%/95%, 10%/90% and 20%/80% corresponding to concentration ratios of diglyceride/triglyceride of 0.035, 0.072, 0.15 and 0.34, respectively. Spectral fitting with Philips spectroscopy software was performed to obtain peak areas of the ≈ 3.7, ≈ 4.1, ≈ 4.4, and ≈ 5.1 ppm peaks of the spectrum acquired from the 1,3- and 1,2-dicaprylin mixture and for the ≈ 4.1 and ≈ 4.3 ppm resonances of spectra obtained from the 1,3-dicaprylin/tricaprylin phantoms.Results
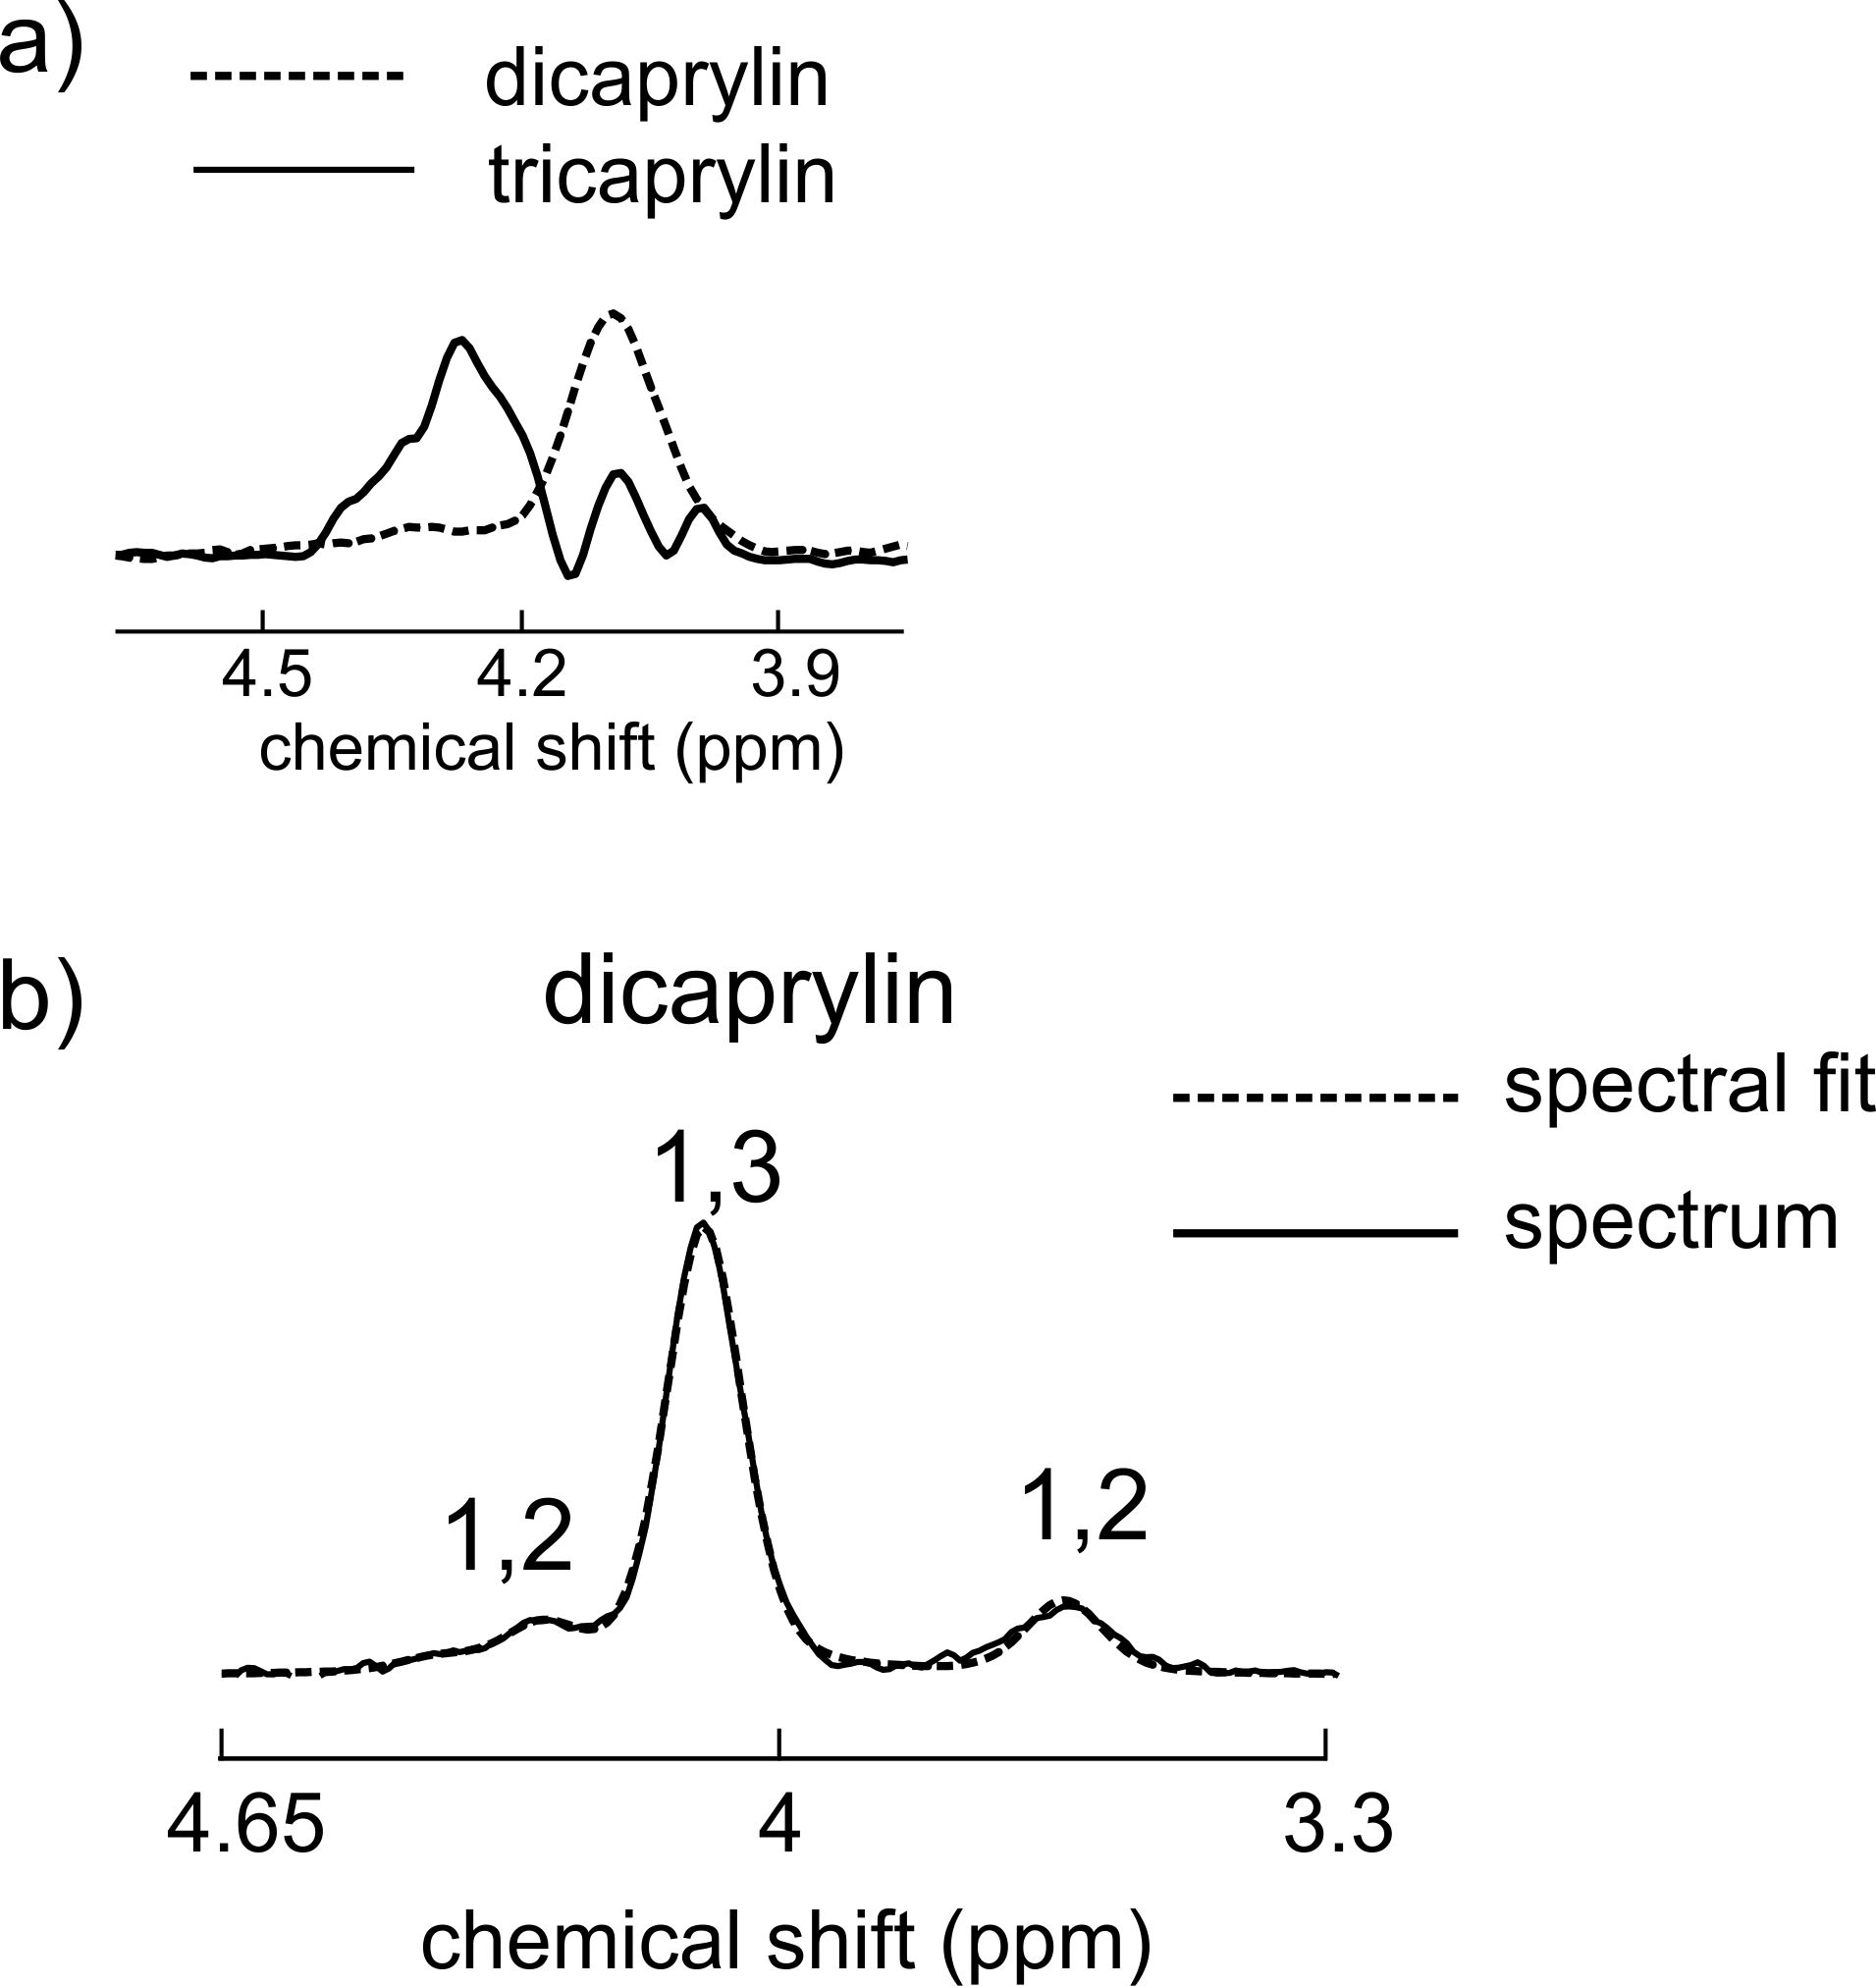
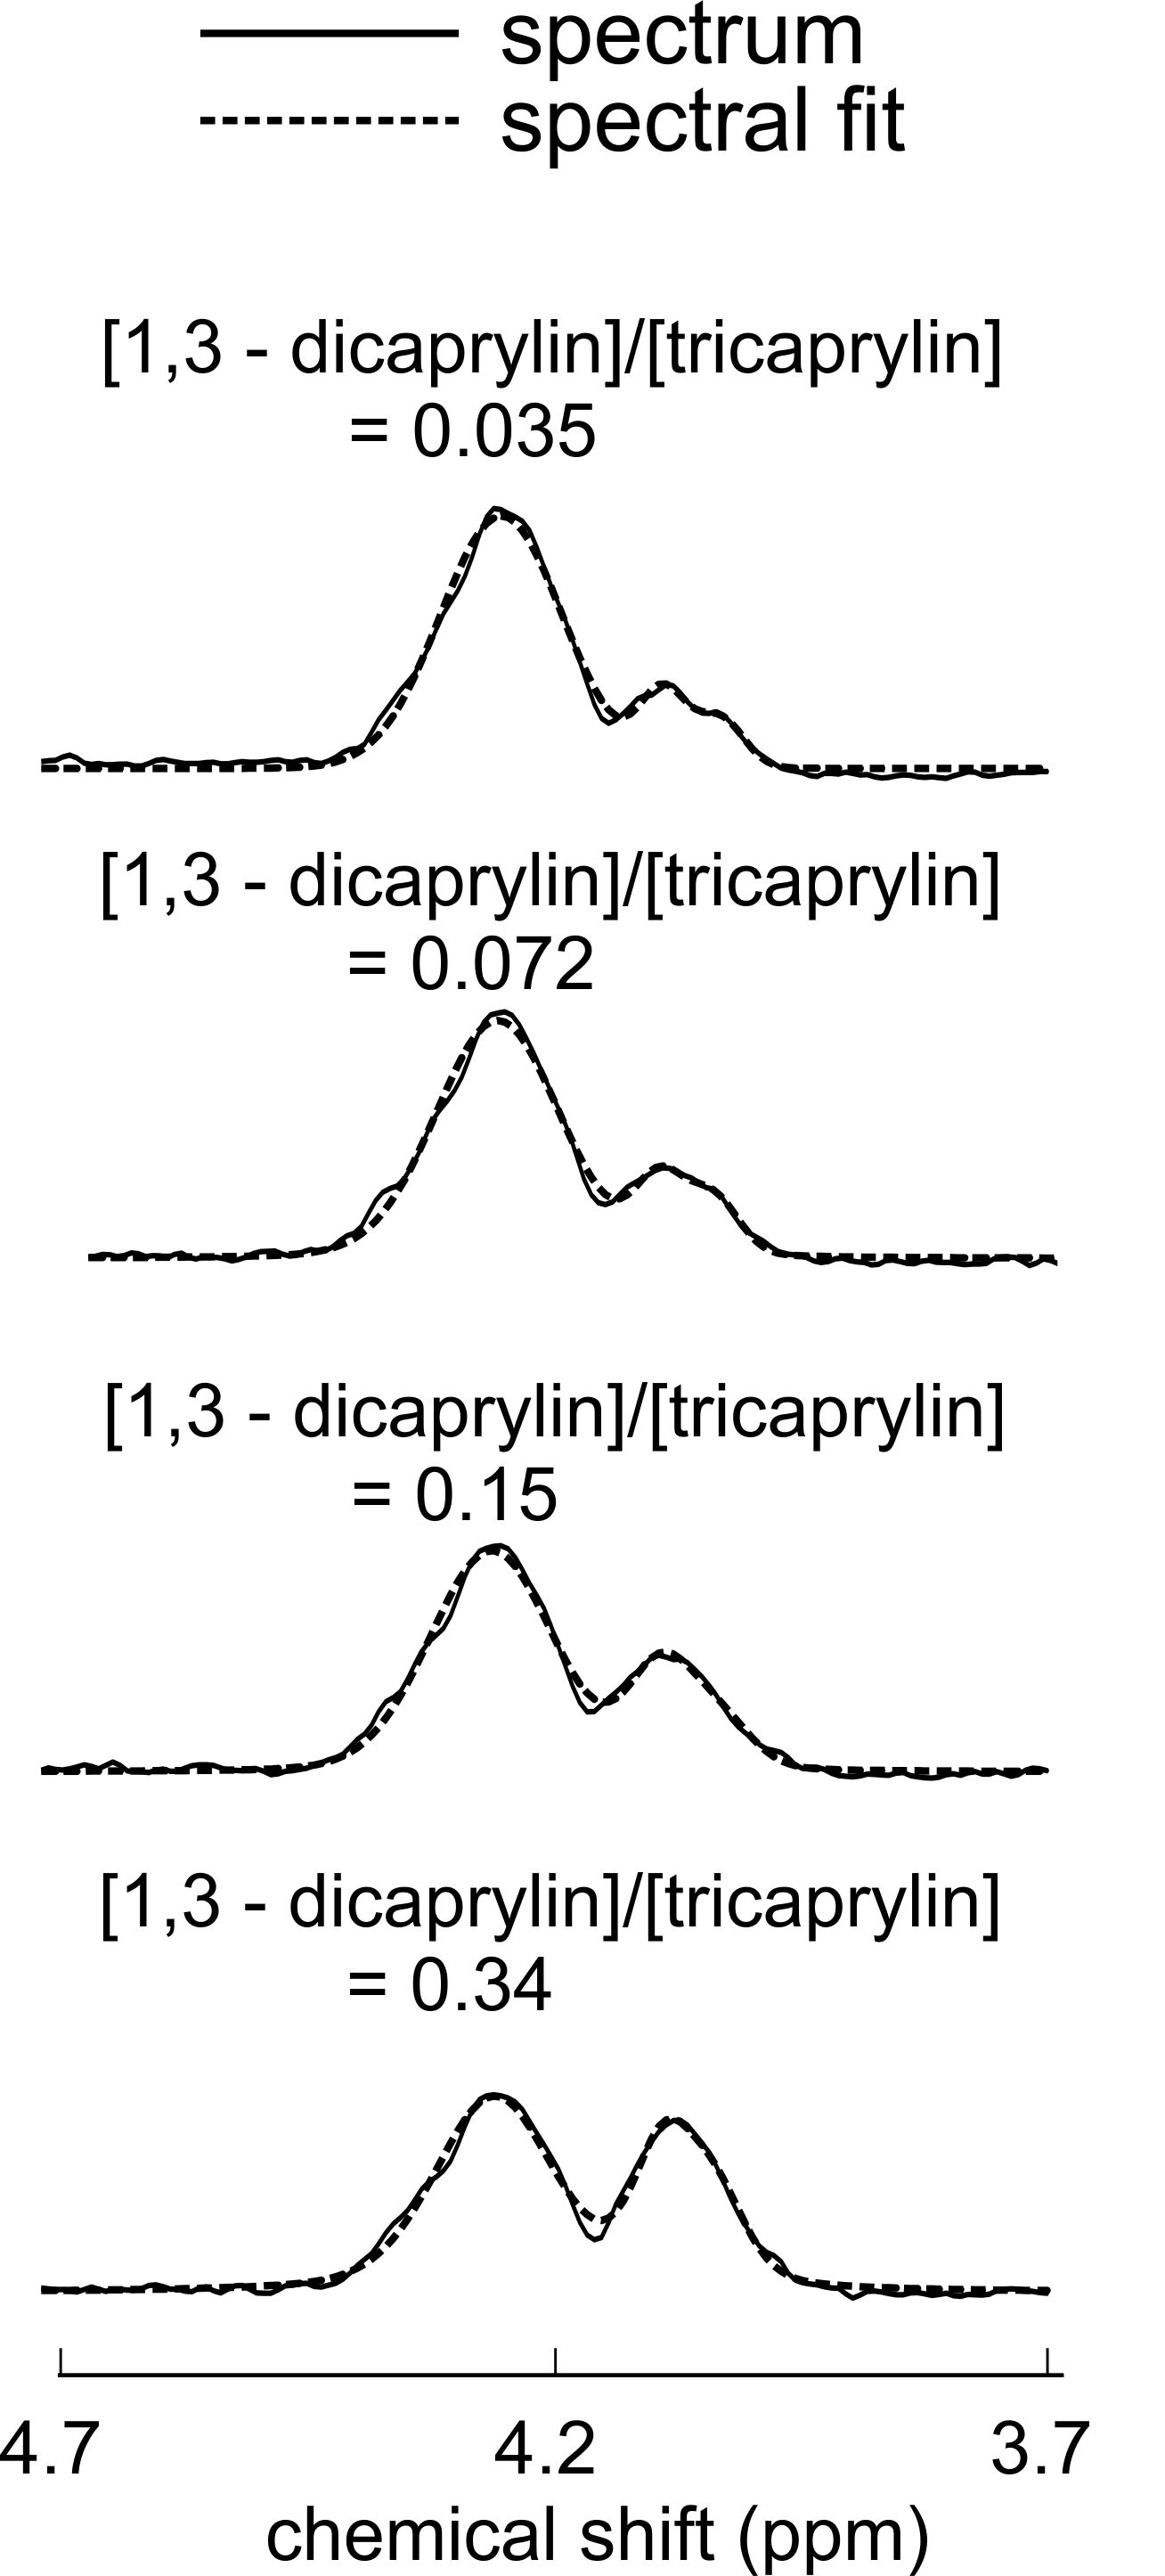
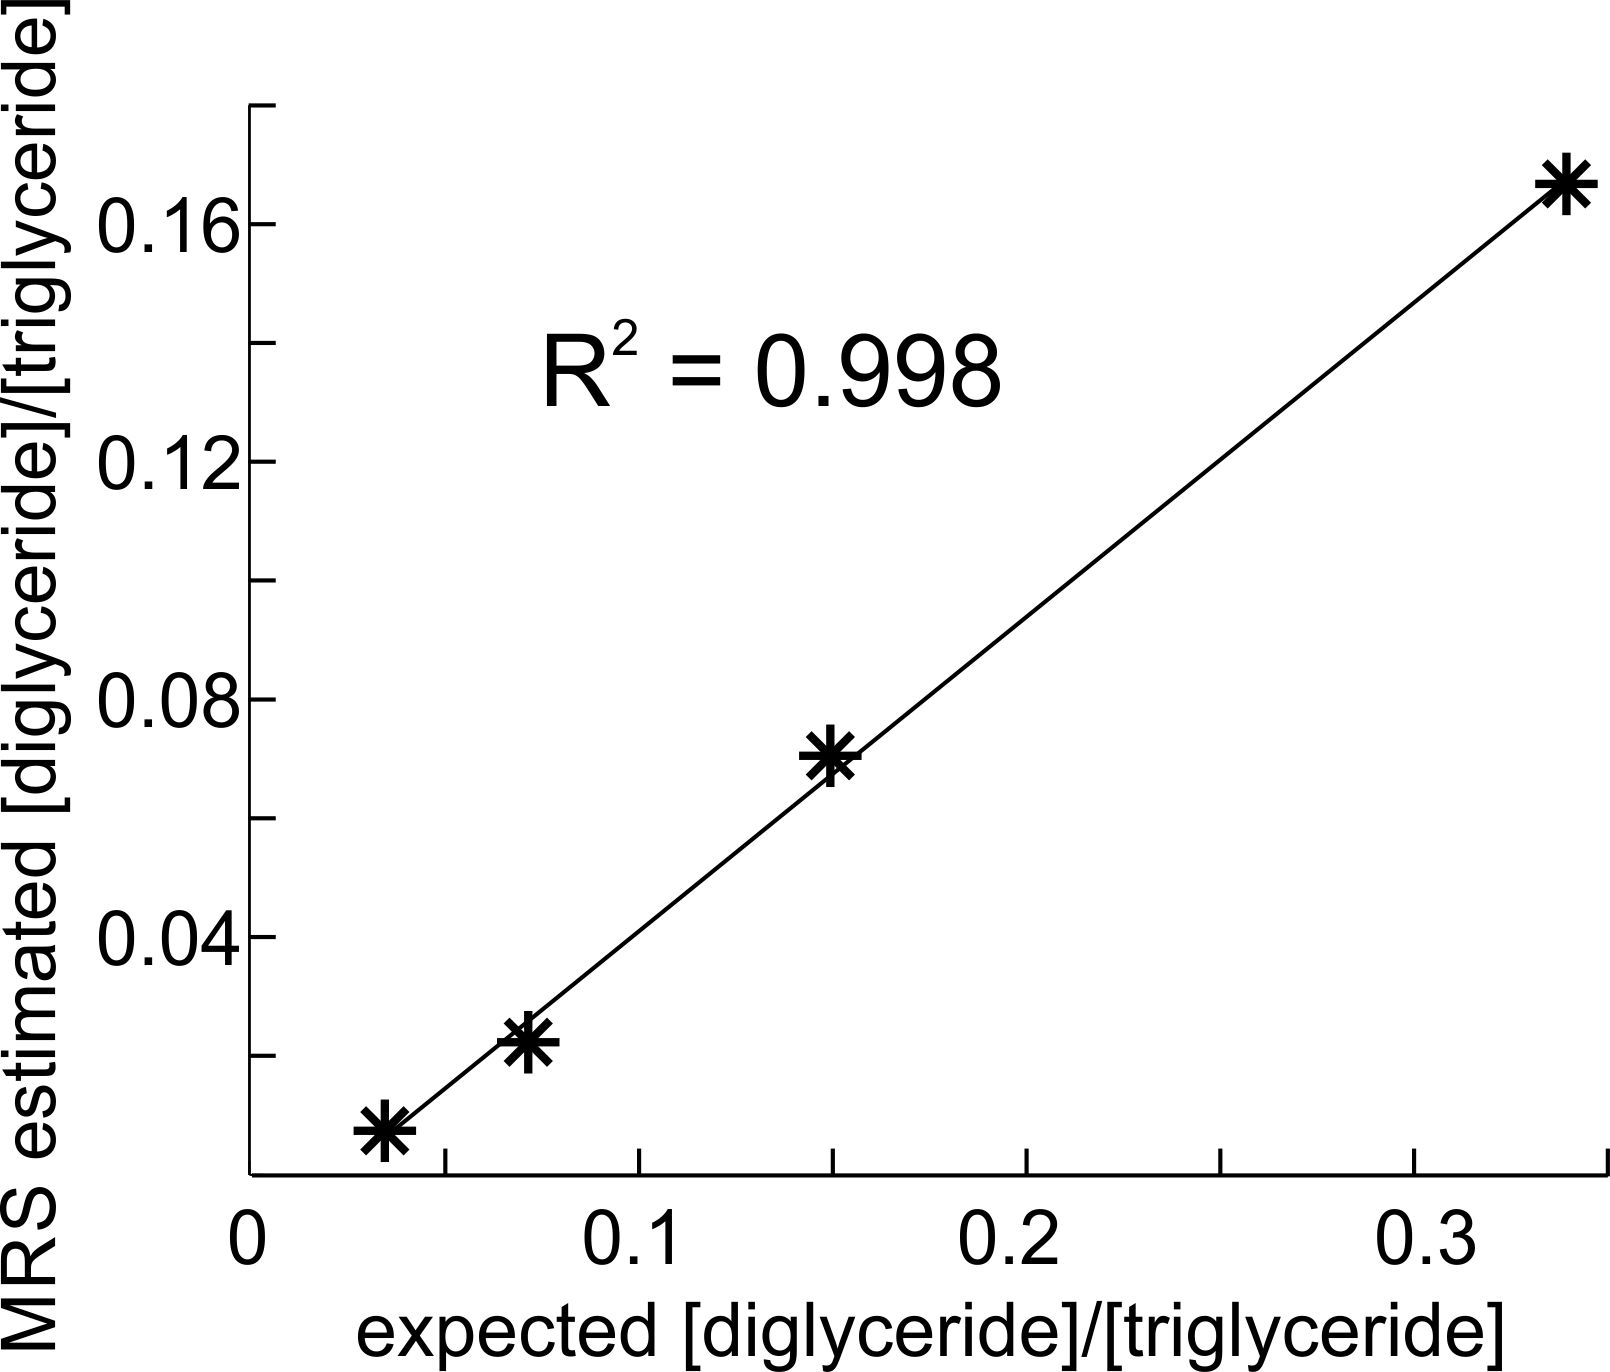
Figure 2(a) displays spectra acquired from dicaprylin and tricaprylin with STEAM with a TE of 100 ms. Two groups of resolvable triglyceride resonances (two glycerol protons contributing to each), one in the 3.85 – 4.2 ppm (the right peaks) and the other in the 4.2 – 4.6 ppm (the left peak) spectral region are seen. Integration of the resonances yields that the right peaks have an area that is 0.17 times that of the left. Spectral fitting of the dicaprylin spectrum is shown in Figure 2(b). The area of the 4.4 ppm resonance was found to be about 0.63 times that of the 3.7 ppm peak. Two glycerol protons contribute to each of the 3.7 ppm and the 4.4 ppm resonances. The 1,3- resonance results from the contribution of all five glycerol protons. Figure 3 displays glycerol spectra acquired from the phantoms containing a mixture of 1,3-dicaprylin and tricaprylin along with their spectral fits. The left peaks are from tricaprylin since there is no 1,2-dicaprylin present (confirmed by the absence of a 3.7 ppm peak). The right peak is a mixture of signal from 1,3-dicaprylin and tricaprylin. The tricaprylin contribution to the right peaks can be estimated as 0.17 times the area of the left peak. Subtracting this contribution from the right peak area yields the area that arises solely from 1,3-dicaprylin. Dividing the resulting area by the left tricaprylin peak area and multiplying by 2/5 (to compensate for the different number of contributing protons) yields an estimate of the diglyceride/triglyceride concentration ratio. The MRS estimated diglyceride/triglyceride amounts plotted against expected values are shown in Figure 4.Discussion
The linear correlation in Figure 4 shows that the spectra enable assessment of relative quantification of diglyceride/triglyceride levels. The methodology can be applied to detect relative differences in diglyceride/triglyceride content but not to provide absolute quantification because differences in J-coupling evolution and T2 relaxation of the diglyceride and triglyceride glycerol protons likely affect quantification. The technique could have application measuring diglycerides/triglycerides level changes in vivo; for example, diglyceride/triglyceride amounts close to 20 % were observed in some alcoholic liver disease patients (2). Quantification was performed on phantoms that contained negligible amounts of 1,2-diglyceride. If 1,2-diglycerides are present, they can be detected by the existence of a peak at about 3.7 ppm. From the dicaprylin spectrum shown in Figure 2(b), the 1,2-diglyceride contribution to the left glycerol resonance (4.2 – 4.6 ppm) was calculated to be about 0.63 times that of the 3.7 ppm peak and can be subtracted from the left glycerol resonance resulting in the area contribution from tricaprylin.Conclusion
STEAM (TM = 20 ms) with a TE of 100 ms at 3 T can enable relative diglyceride/triglyceride concentrations to be estimated in samples with a concentration ratio as low as 3.5 %.Acknowledgements
We are thankful to the Natural Sciences and Engineering Research Council of Canada for funding.References
1.Gorden DL, Ivanova PT, Myers DS, et al. Increased Diacylglycerols Characterize Hepatic Lipid Changes in Progression of Human Nonalcoholic Fatty Liver Disease; Comparison to a Murine Model. PLoS ONE 2011(6):e22775.
2. Mavrelis PG, Ammon HV, Gleysteen JJ, Komorowski RA, Charaf UK. Hepatic Free Fatty Acids in Alcoholic Liver Disease and Morbid Obesity. Hepatology 1983;3:226-231.
3. Scow RO, Stricker FA, Pick TY, Clary TY. Effect of ACTH on FFA Release and Diglyceride Content in Perfused Rat Adipose Tissue. Ann N Y Acad Sci 1965;131:288-301.
4. Alexandri E, Ahmed R, Siddiqui H, Choudhary MI, Tsiafoulis CG, Gerothanassis IP. High Resolution NMR Spectroscopy as a Structural and Analytical Tool for Unsaturated Lipids in Solution. Molecules 2017;22:1663.
5. Hatzakis E, Agiomyrgianaki A, Kostidis S, Dais P. High-resolution NMR spectroscopy: An alternative fast tool for qualitative and quantitative analysis of diacylglycerol (DAG) oil. J Am Oil Chem Soc 2011;88:1695-1708.
6. Kosugi Y, Matsubara K. Conformational analysis of triacylglycerols by means of Nuclear Magnetic Resonance and Molecular Mechanics. J Jpn Oil Chem Soc 1989;38:415-420.
7. Matsuo N. Nutritional characteristics and health benefits of diacylglycerol in foods. Food Sci Technol Res 2004;10:103-110.
8. Nicholson RA, Marangoni AG. Diglycerides. Encyclopedia of Food Chemistry 2019;1:70-73.
9. Fairgrieve-Park L, Fallone CJ, Yahya A. Long TE PRESS and STEAM for measuring the triglyceride glycerol CH2 protons at 3 T. NMR Biomed 2018;32:e4021.
Figures