4493
Incorporating data heterogeneity for improved regression models: application to stroke
Anuja Sharma1 and Edward DiBella1
1Dept. of Radiology and Imaging Sciences, University of Utah, Salt Lake City, UT, United States
1Dept. of Radiology and Imaging Sciences, University of Utah, Salt Lake City, UT, United States
Synopsis
Symbolic data regression provides a systematic way to bring together heterogenous data from imaging and non-imaging sources in the form of histograms, intervals and scalar-valued observations. Classic multiple linear regression is adapted to mixed symbolic features and applied to data from diffusion spectrum images and clinical measurements for stroke recovery prediction. By utilizing the implicit variability within observations and natural grouping within features, the amount of information available to the modelling process is increased. This provides increased stability for model parameters over traditional regression and is especially beneficial with low sample sizes.
Introduction
Knowledge discovery from medical data usually requires working with data heterogeneity. A single patient can generate data in the form of MRI images, multiple clinical measurements, and demographic information. To handle this, information is generally simplified or discarded. For example, MRI image analysis commonly involves simplifying large voxel neighborhoods from structures of interest to a single value, like the mean of the image intensities in a region1. Clinical measurements acquired at multiple time points occasionally have missing data points, and can also be prone to errors. This creates inconsistencies in the data table which are further compounded by the often limited sample size available in many clinical studies. Classic regression methods discard samples with missing data points, further reducing the available sample size and amplifying the curse of dimensionality2.To improve regression models in such cases, we propose a symbolic data analysis approach that allows combining different variable types in the same regression model3-5. For example, histograms of MRI intensities from a region of interest, the interval range of a clinical score measured at multiple timepoints, and classic scalar-valued data like age and weight can be combined efficiently.
Method
Stroke data from 7 subjects is compiled in two ways- classic scalar-valued samples and their symbolic data counterparts (3T scanner, diffusion spectrum imaging, 203 directions, max b=4000, see Fig. 1 for two examples). All baseline measurements, including MRI, were acquired in the subacute phase (within 2 weeks post-stroke). Follow-up Fugl Meyer measurements were acquired at 52±21 days post-stroke. Average ODI (Orientation dispersion index from the NODDI model6) values from the posterior limb of the internal capsule (PLIC) are represented as ODI histograms. ODI from PLIC has shown to be an effective biomarker for stroke recovery7. Clinical measurements collected weekly post-stroke are summarized as interval-valued variables (clinical scores like mRS, NIHSS and systolic and diastolic blood pressure values). Patient’s age is included as a scalar value. Apart from the above predictor variables, a 3-month Fugl Meyer score is used as a scalar response variable in the regression model.We implement a symbolic multiple linear regression method which allows mixing different data types to estimate a linear regression fit with a closed-form solution. The descriptive statistics (mean, variance and covariance) are extended to symbolic data by considering different partitions of the inherent variability within each observation4,5,8 (Fig 2). These values are then used within the classic ordinary-least-squares framework. Standard errors for the estimated regression coefficients are calculated via bootstrap resampling (1000 iterations) and compared with those from the classic regression approach applied to averages of the same variables.
Results
We demonstrate three experimental models with various combinations of symbolic predictor features, including histograms, intervals and single-valued numbers. Results are compared with their corresponding scalar-valued summaries employed in a classic regression setting (Fig. 3). Most regression coefficients report a reduced standard error. This indicates that owing to the additional knowledge content retained and utilized by the symbolic regression (given the same overall sample size of 7 subjects), the stability of the regression model estimates is improved. This is particularly true for a low sample size because exposure to more inherent variability information within each measurement, prevents overfitting to the available sample’s mean values. It therefore improves the ability to generalize to new, unseen subjects from the larger population.Another benefit of the method is in incorporating a larger information content within the same number of features, effectively leading to dimensionality reduction by tapping into the naturally present grouping or classes within the observed variables. For a limited sample size, this can free up essential degrees of freedom allowing additional features. The flexibility of symbolic representations also naturally addresses missing data points that would otherwise be discarded in the classic approach (for example, missing week 1,2 values for subject 2 in Fig. 1).
Conclusion
The proposed method provides a structured, intuitive way to condense large, complex data tables, including missing observations. By reducing multiple features into a handful and capturing the implicit variations of these features in the process, more information is extracted from a limited sample size. The method provides simple analytical solutions and uses the familiar framework of multiple linear regression as the foundation. This enhances the potential utility and applicability of the method to incorporate heterogeneous data sources from MRI images and non-imaging data.Acknowledgements
We are grateful to Dr. Jennifer Majersik for leading and Dr. Ganesh Adluru and Kinga Aitken of University of Utah for assisting with the stroke data set for this study.References
- Sharma A., Fletcher P.T., Gerig G., et al. Spatiotemporal modeling of distribution-valued data applied to dti tract evolution in infant neurodevelopment. In 2013 IEEE 10th International Symposium on Biomedical Imaging. April 2013; 684-687.
- Hastie T., Tibshirani R. and Friedman J. The Elements of Statistical Learning: Data Mining, Inference, and Prediction (Ed. 2). 2009. Springer.
- Billard L. and Diday E. Symbolic Data Analysis: Conceptual Statistics and Data Mining. 2006. John Wiley.
- Sharma A., Fletcher P.T., Gerig, G., et al. Parametric regression scheme for distributions: Analysis of DTI fiber tract diffusion changes in early brain development. In 2014 IEEE 11th International Symposium on Biomedical Imaging (ISBI). April 2014; pp. 559-562.
- Sharma A. Temporal Modeling and Analysis of Distribution-valued Functional Curves: Application to Diffusion Tensor Imaging (Doctoral dissertation). 2021. The University of Utah.
- Zhang H., Schneider T., Wheeler-Kingshott C.A., et al. NODDI: practical in vivo neurite orientation dispersion and density imaging of the human brain. Neuroimage. 2012;61(4):1000-1016.
- Hodgson K., Adluru G., DiBella E., et al. Predicting motor outcomes in stroke patients using diffusion spectrum MRI microstructural measures. Front Neurol. 2019;10:72.
- Billard L. and Diday E. Clustering methodology for symbolic data. 2019. John Wiley & Sons.
Figures
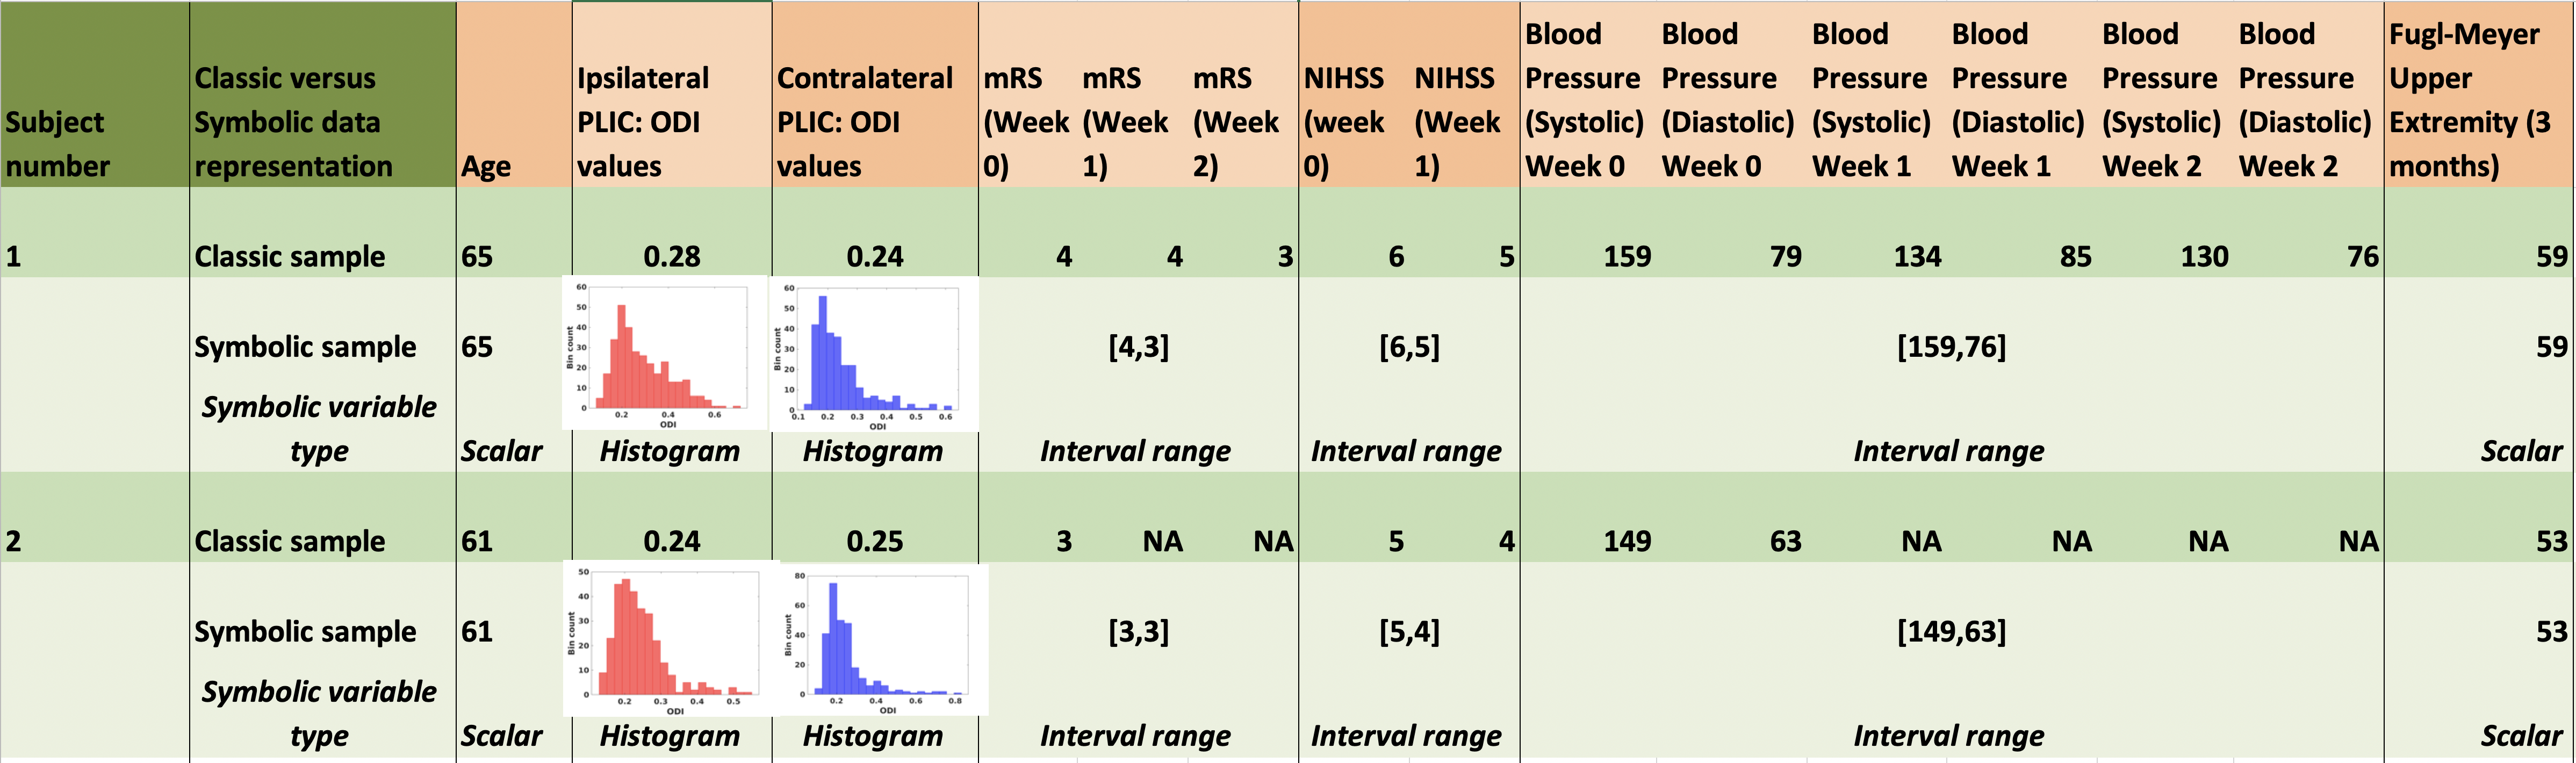
Fig 1: Various available data features shown for two (out of 7) stroke patients. The classic sample observation for each subject contains scalar-valued measurements. The corresponding symbolic sample observation combines features based on natural grouping and represents them as histograms, intervals or scalar values. Missing data is marked as NA.
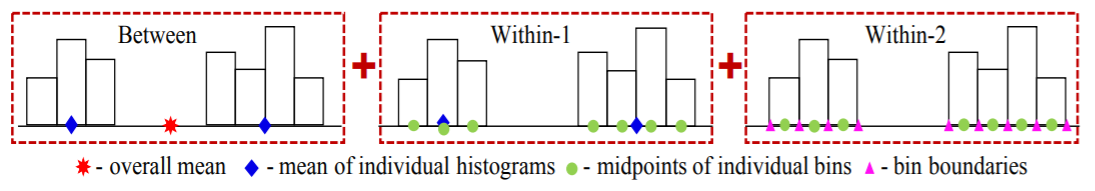
Fig 2: Total variation between different symbolic observations represented as a sum of three variation components. 1) 'Between': Based on observations’ overall mid-points 2) 'Within-1': each observation's midpoint and bins' mid-points 3) 'Within-2': Variation within each bin of each observation. This basic principle is applied across all symbolic data types (histograms, intervals, scalars) to calculate the mean, variance and covariance across multiple variables (mathematical details in5,8).
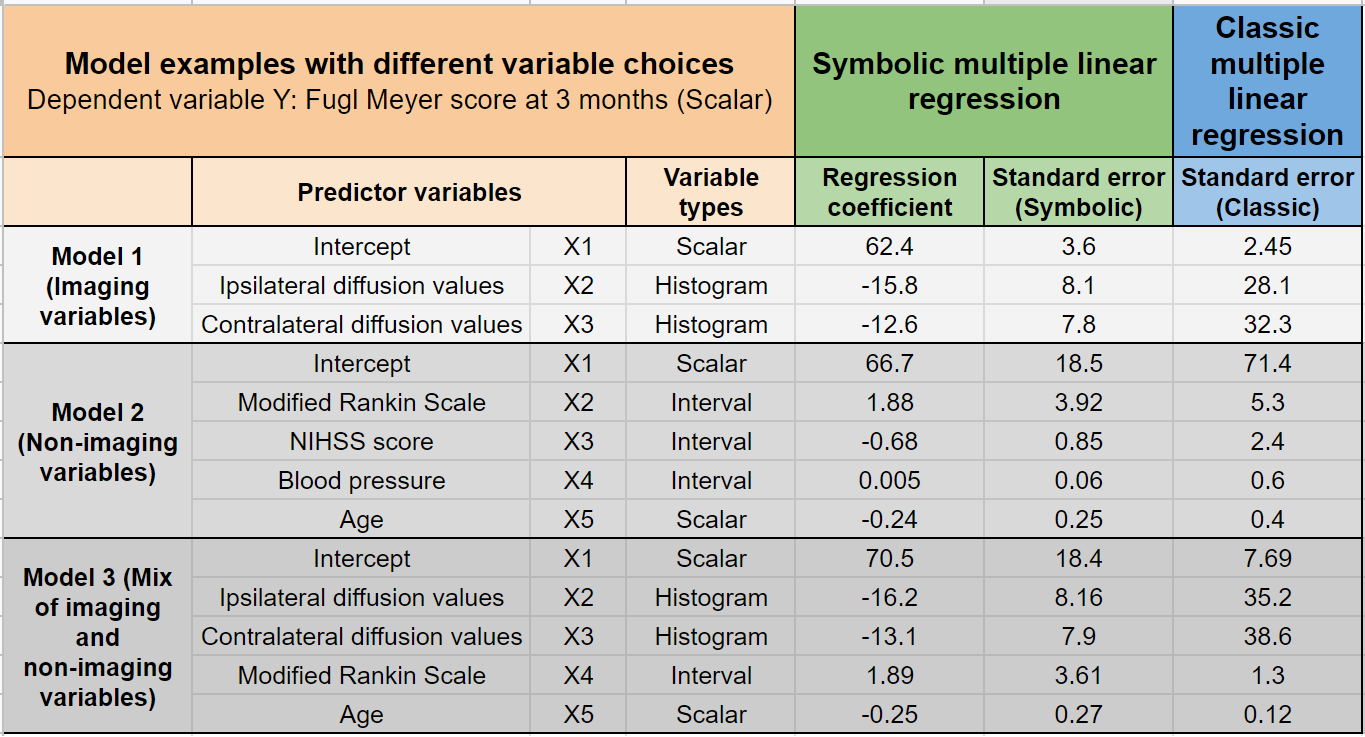
Fig 3: Symbolic multiple regression model examples that combine histograms, intervals and scalar-valued ‘symbolic’ features (imaging and non-imaging sources) from the first 2 weeks post-stroke. We predict a scalar follow-up clinical score (Fugl-Meyer at 3 months). Note that the response variable Y can be symbolic as well. Comparison with classic multiple regression shown via standard errors of the estimated regression coefficients.
DOI: https://doi.org/10.58530/2022/4493