4491
Measurement of model-free diffusion tensor distribution using Connectome MRI and application in an anaplastic astrocytoma1Athinoula A. Martinos Center for Biomedical Imaging, Department of Radiology, MGH, Charlestown, MA, United States, 2John A Paulson School of Engineering and Applied Sciences, Harvard Univ, Cambridge, MA, United States, 3Stephen E. and Catherine Pappas Center for Neuro-Oncology, MGH, Boston, MA, United States, 4Department of Biomedical Engineering, College of Precision Instruments and Optoelectronics Engineering, Tianjin University, Tianjin, China, 5Department of Pathology, MGH, Boston, MA, United States, 6Department of Neurosurgery, MGH, Boston, MA, United States
Synopsis
The availability of the Connectome MRI scanner with gradient strengths up to 300 mT/m enables resolution of a wider range of diffusion coefficients. This is particularly important for capturing the complexity and heterogeneity of biological tissues. Here, we outline a framework for analyzing diffusion MRI data to obtain a model-free diffusion tensor distribution (FDTD) with a wide variety of diffusion tensor structures and test it on a healthy subject. We apply this method and use K-means clustering to identify features in FDTD to visualize and characterize tissue heterogeneity in a subject with a World Health Organization grade 3 anaplastic astrocytoma.
Introduction
It is well-known that diffusion MRI (dMRI) is capable of characterizing tissue microstructure and differentiating between different types of tissues in the central nervous system1-6. However, the analysis of dMRI data often considers three components7: 1) the signal associated with axons with an anisotropic diffusion behavior, 2) the signal associated with the tissue with the isotropic restricted diffusion, and 3) the signal from an unrestricted water pool8,9. This is a simplified model because the details of the tissue microstructure may vary, including axon diameters, axonal orientation, and the degree of restricted diffusion. Several other models have expanded the diffusion tensor structures but remain significantly constrained 7,9-15. In this work, we leverage the higher gradients afforded by the Connectome scanner 16-19 to better characterize tissue microstructure by further expanding the range of diffusion tensors to obtain a model-free diffusion tensor distribution (FDTD).Methods
Two subjects (one healthy subject, one subject with an anaplastic astrocytoma) were scanned on a high-gradient 3 Tesla MRI scanner (MAGNETOM CONNECTOM, Siemens Healthcare, Erlangen, Germany) with a maximum gradient strength of 300 mT/m using a 64-channel head coil 20. For the healthy subject, the multishell acquisition consisted of two diffusion times (19 and 49 ms) and eight gradient strengths per diffusion time, which were linearly spaced from 30 to 290 mT/m with a maximum b value of 17,800 s/mm2. Diffusion-weighted images were acquired with spatial resolution of 2 × 2 × 2 mm3 voxels, echo time/repetition time =77/3600 msec, parallel imaging acceleration factor R = 2, simultaneous multislice imaging with a slice acceleration factor of 2, and anterior-to-posterior phase encoding. Interspersed b = 0 images were acquired every 16 images. Further details of the protocol can be found in Ref. 21 and 22. For the subject with an anaplastic astrocytoma, 4-5 gradient increments were used for each diffusion time with a similar b value range. Additionally, T1-MPRAGE and T2-SPACE-FLAIR sequences were obtained and the T2/FLAIR-hyperintense region was defined as the tumor region of interest (ROI).The dMRI data (S) is a sum of signals from all components characterized by their diffusion tensor, $$$D$$$ defined by the three eigenvalues (λ1, λ2, and λ3) and the three Euler angles,
$$ S(b)/S(0) = \int dD\cdot f(D)\exp(-b:D)$$
Here, $$$f(D)$$$ is the FDTD function, and $$$b$$$ the diffusion weighting factor. FDTD is obtained using the Fast Laplace Inversion (FLI) algorithm 23,24. All diffusion tensors were allowed as long as the eigenvalue is less than the bulk value.
To visualize the FDTD analysis, a K-means clustering algorithm [25] was applied to classify tissues to group the data points into several clusters based on their similar FDTD properties. Five clusters (c1-c5) were chosen empirically to perform K-means algorithm.
Results
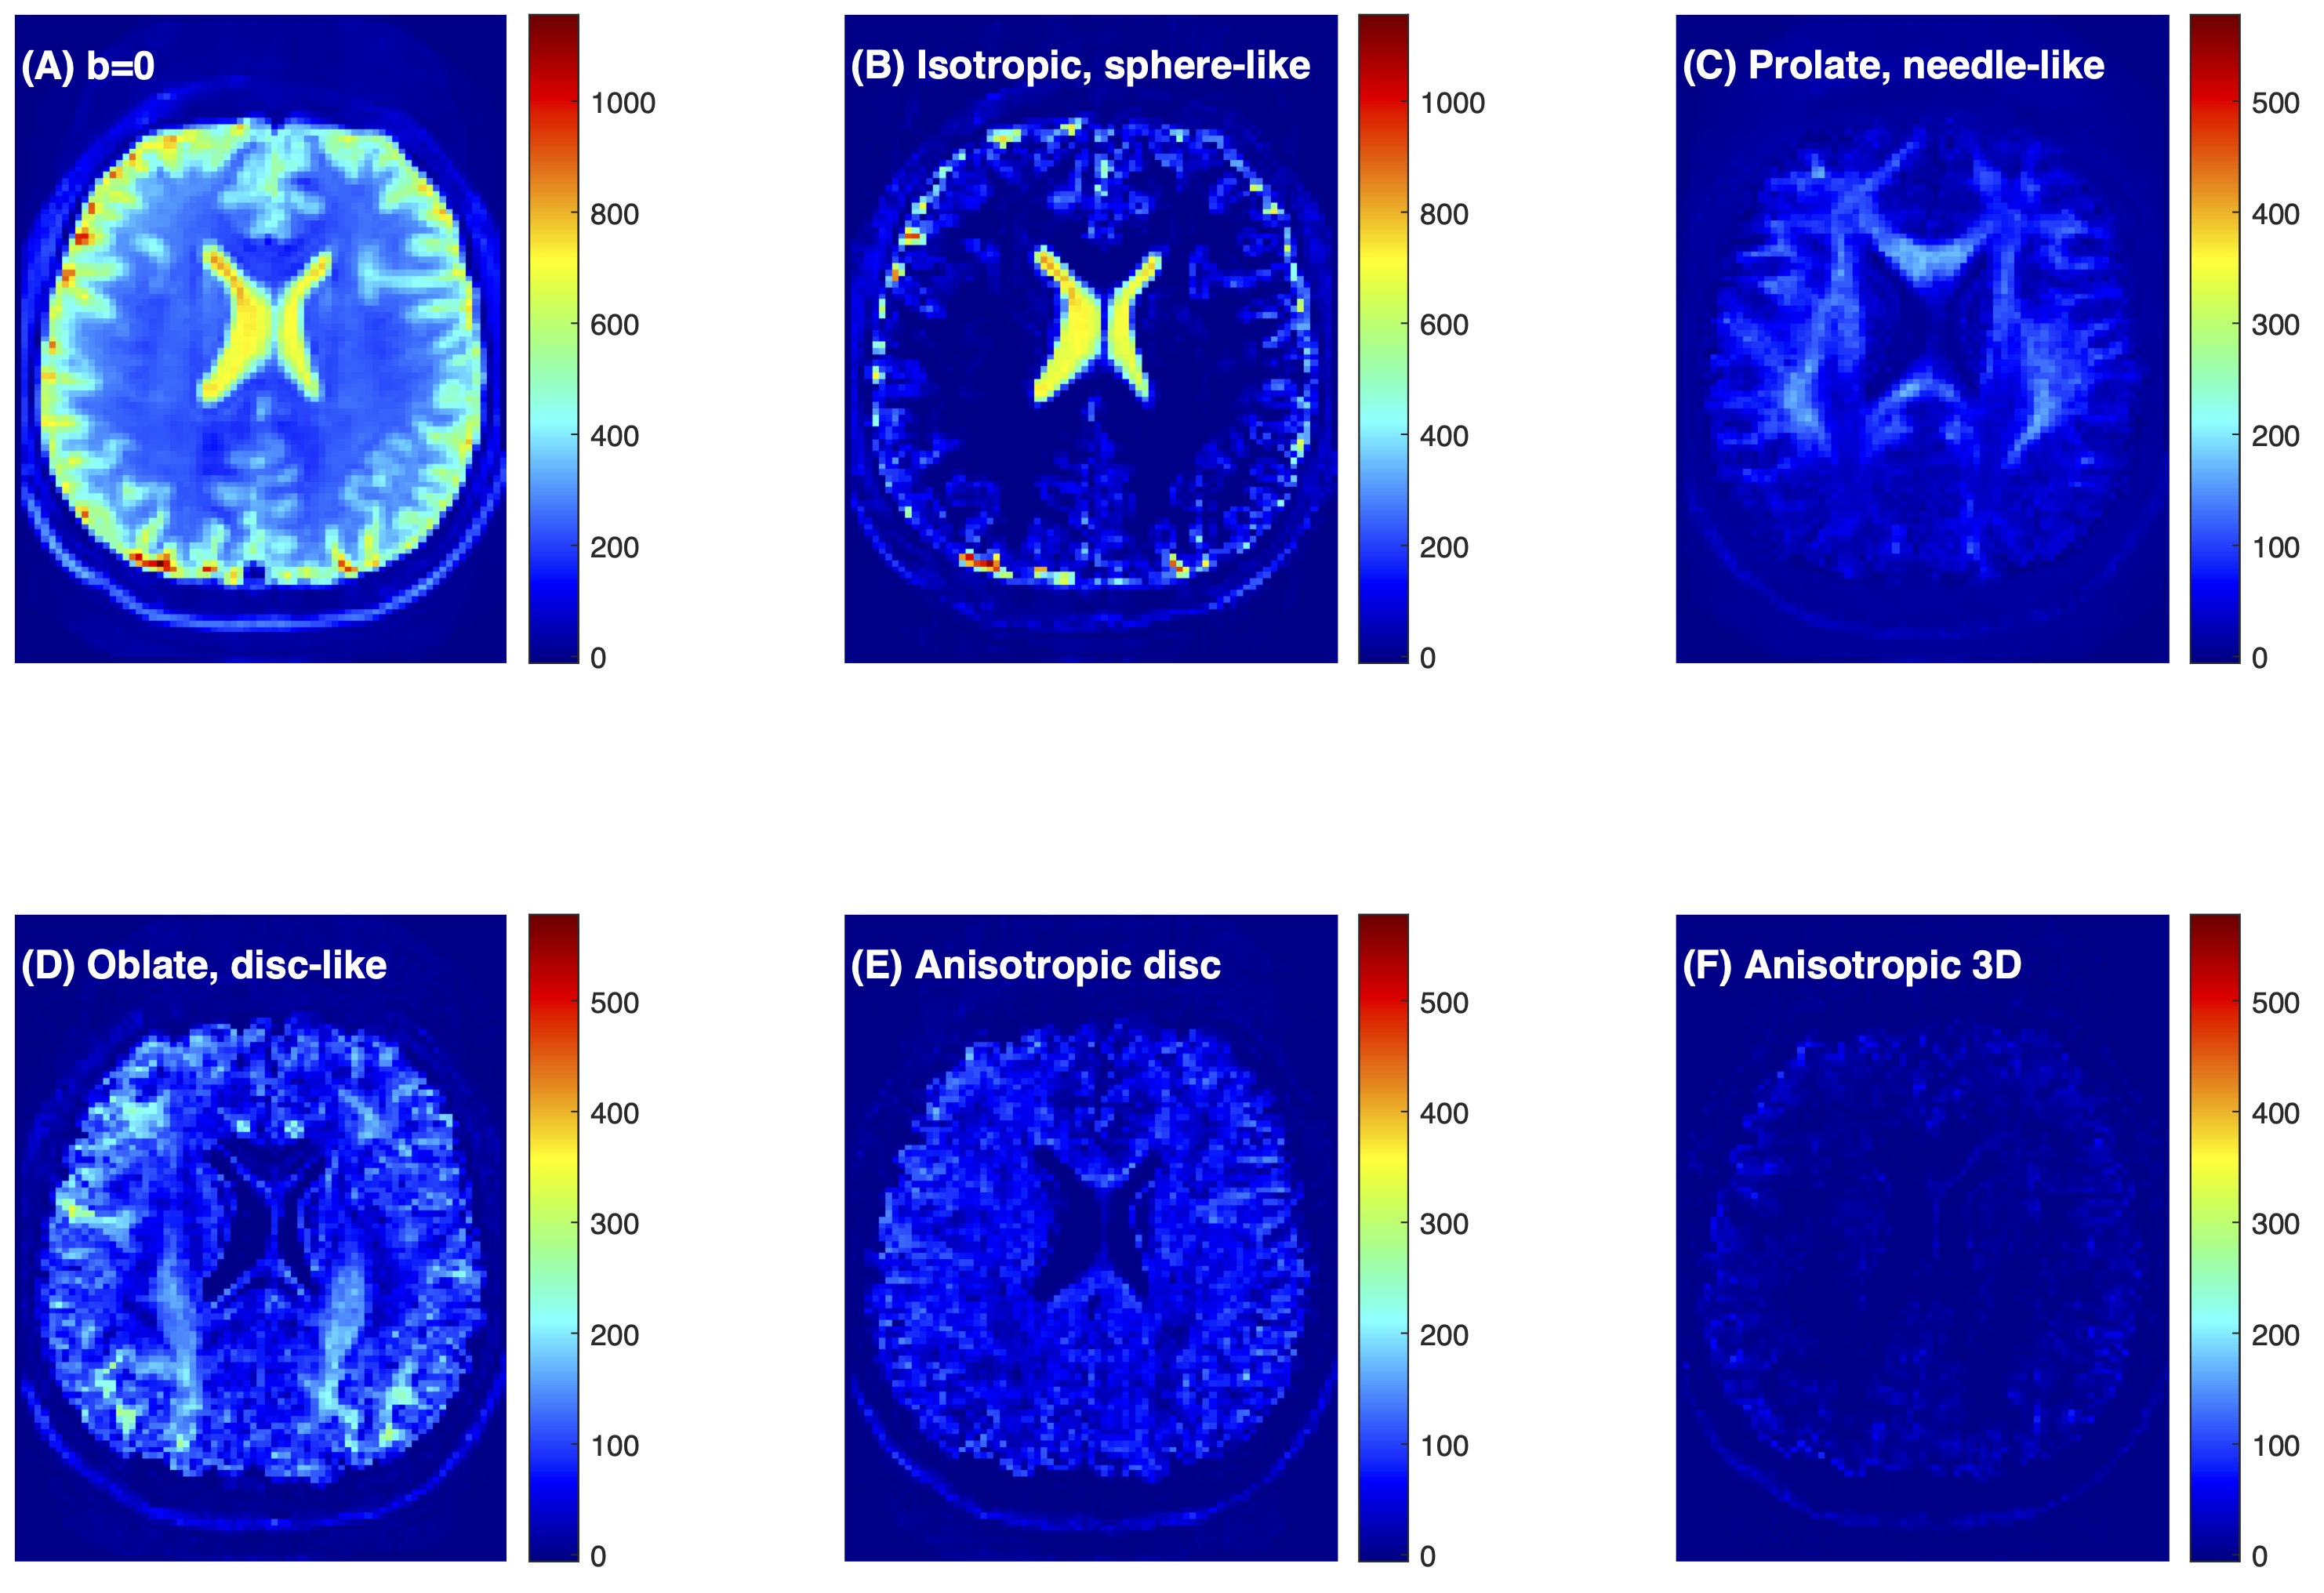
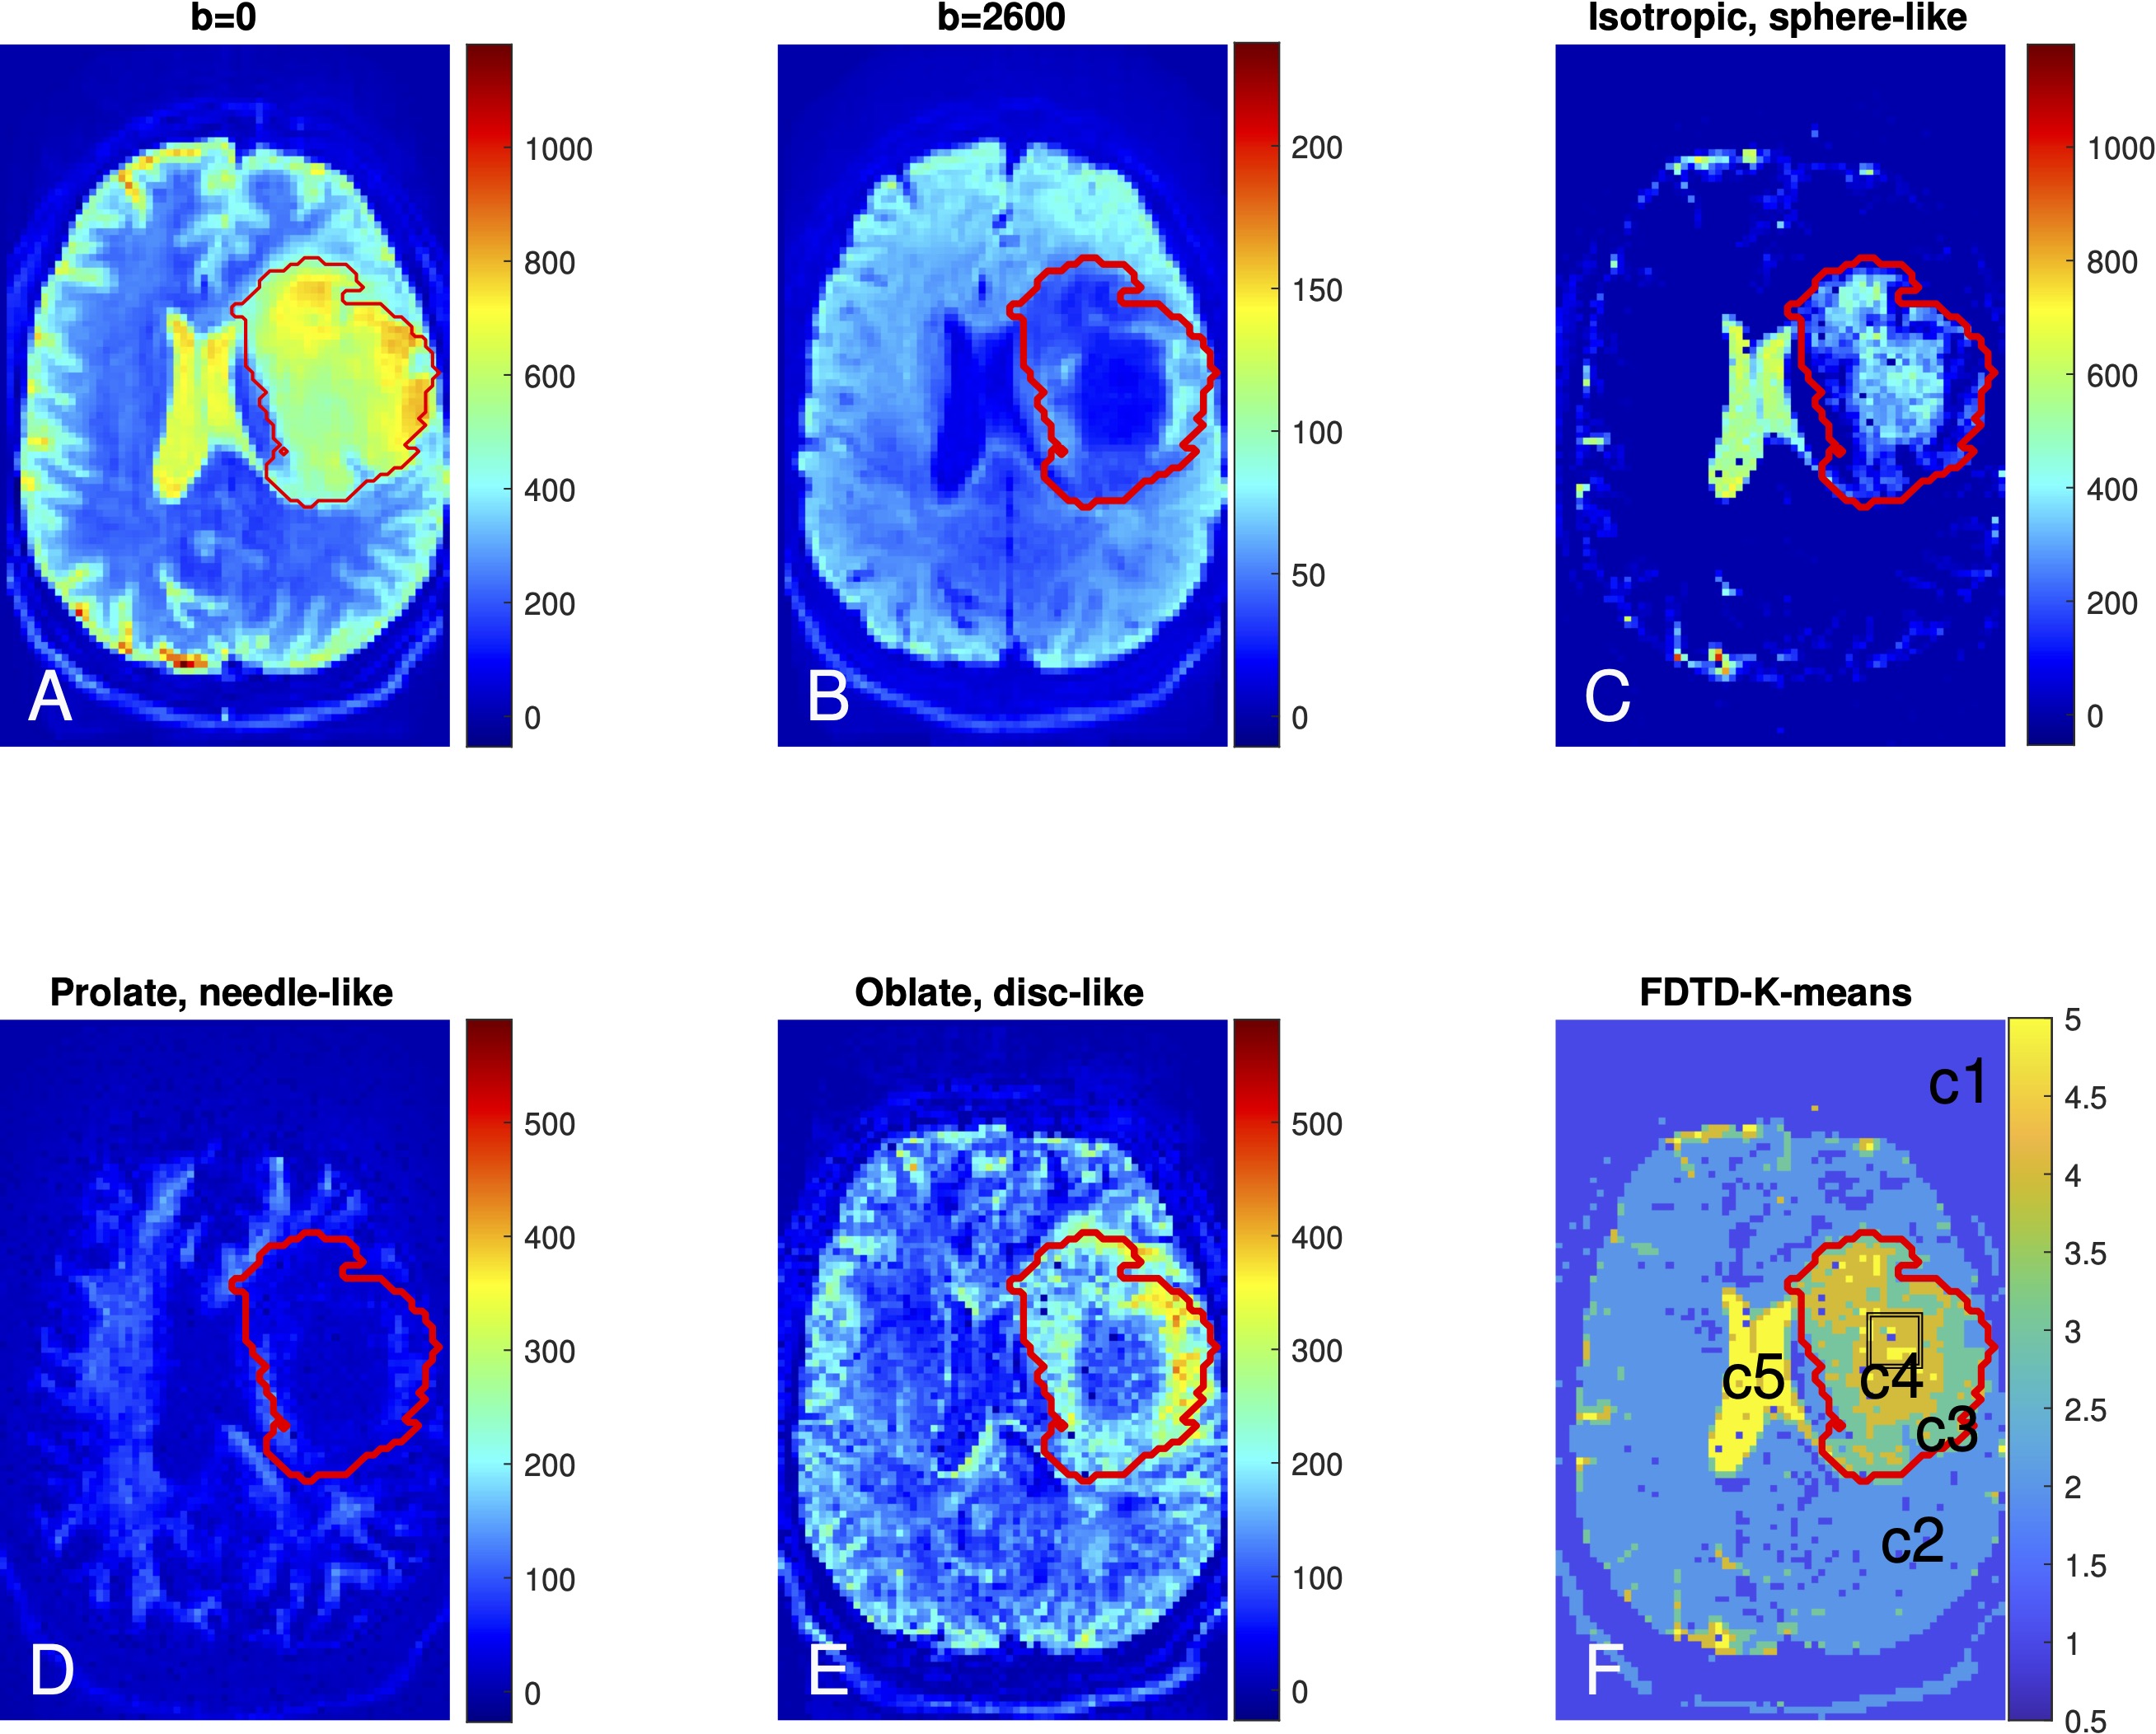
Figure 1 shows the raw dMRI image for a healthy volunteer and the inversion FDTD results. Strong signals with prolate (needle-like) symmetry (Fig. 1C) were found along white matter regions (e. g. corpus callosum). Oblate water (disc-like) signal (Fig. 1D) is not commonly used to analyze dMRI, but was seen throughout the brain, and absent in the corpus callosum. Anisotropic disc-like water (Fig. 1E) is similar to oblate symmetry except that λ2 and λ3 are significantly different and was characterized by a uniform spatial distribution throughout the brain except in the ventricles.The FDTD results from the astrocytoma patient are shown in Fig. 2. The tumor ROI exhibited increased signal at b = 0 s/mm2, which decayed greatly at b = 2600 s/mm2 in the central region of the tumor, indicating the presence of highly diffusive components. This was reflected in the significant amount of isotropic water (Fig. 2C) and a reduction of prolate water (Fig. 2D) in the center of the tumor. A similar pattern of fewer axonal structures in the center of gliomas has been reported using a DTI fibre tracking technique 26. Fig. 2E shows accumulation of the oblate water signal along the lateral margins of the tumor ROI, suggesting that the tissue microstructure along the tumor periphery differs from that within the tumor center. Fig. 2F shows the K-means map identifying different tissue types: c5 is found primarily in the ventricles, c4 in the central tumor ROI, c3 along the tumor periphery, c2 in the healthy tissue, and c1 outside brain.
Discussion
We show that the multi-shell DTI data acquired on the Connectome allow us to apply a model-free approach to the analysis of diffusion tensor distribution. Our results suggest the presence of a significant amount of signals associated with planar tissue geometries (both with and without axial symmetry). The FDTD-K-means analysis demonstrates tissue heterogeneity within an anaplastic astrocytoma tumor that is not evident on conventional T2/FLAIR sequences. It is interesting to note that c3 and c4 localized well to the tumor ROI without the K-means algorithm knowing about the T2/FLAIR data or the tumor ROI, in keeping with our model-free approach.Conclusion
We demonstrate the feasibility and reproducibility of our model-free approach to analyze in vivo multi-shell DTI data and promising results of automated tissue classification in a subject with an anaplastic astrocytoma.Acknowledgements
We thank Dr. Barbara Wichtmann for helpful discussions and Dr. Qiyuan Tian for assistance in data processing.
References
1. Alexander DC, Dyrby TB, Nilsson M, Zhang H. Imaging brain microstructure with diffusion MRI: practicality and applications. NMR in Biomedicine 32 (2019) e3841.
2. Topgaard D. Diffusion tensor distribution imaging. NMR in Biomedicine 32 (2019) e4066–12.
3. Novikov DS, Fieremans E, Jespersen SN, Kiselev VG. Quantifying brain microstructure with diffusion MRI: Theory and parameter estimation. NMR in Biomedicine 32 (2019) e3998.
4. Assaf Y, Johansen-Berg H, Schotten MTd. The role of diffusion MRI in neuroscience. NMR in Biomedicine 32 (2019) e3762.
5. Huang SY, Witzel T, Keil B, Scholz A, Davids M, Dietz P, et al. Connectome 2.0: Developing the next-generation ultra-high gradient strength human MRI scanner for bridging studies of the micro-, meso- and macro-connectome. NeuroImage243 (2021) 118530.
6. White NS, McDonald C, McDonald CR, Farid N, Kuperman J, Karow D, et al. Diffusion-Weighted Imaging in Cancer: Physical Foundations and Applications of Restriction Spectrum Imaging. Cancer Research 74 (2014) 4638–4652.
7. Zhang H, Schneider T, Wheeler-Kingshott CA, Alexander DC. NODDI: Practical in vivo neurite orientation dispersion and density imaging of the human brain. NeuroImage 61 (2012) 1000–1016.
8. Vangelderen P, Despres D, Vanzijl P, Moonen C. Evaluation of Restricted Diffusion in Cylinders. Phosphocreatine in Rabbit Leg Muscle. Journal of Magnetic Resonance, Series B 103 (1994) 255–260.
9. White NS, Leergaard TB, D’Arceuil H, Bjaalie JG, Dale AM. Probing tissue microstructure with restriction spectrum imaging: Histological and theoretical validation. Human Brain Mapping 34 (2013) 327–346.
10. Jian B, Vemuri BC, O’zarslan E, Carney PR, Mareci TH. A novel tensor distribution model for the diffusion-weighted MR signal. NeuroImage 37 (2007) 164–176.
11. Lampinen B, Szczepankiewicz F, Martensson J, Westen Dv, Sundgren PC, Nilsson M. Neurite density imaging versus imaging of microscopic anisotropy in diffusion MRI: A model comparison using spherical tensor encoding. NeuroImage147 (2017) 517–531.
12. Yablonskiy DA, Bretthorst GL, Ackerman JJ. Statistical model for diffusion attenuated MR signal. Magnetic Resonance in Medicine 50 (2003) 664–669.
13. Basser PJ, Pajevic S. A Normal Distribution for Tensor-Valued Random Variables: Applications to Diffusion Tensor MRI. IEEE Transactions on Medical Imaging 22 (2003) 785–794.
14. Scherrer B, Schwartzman A, Taquet M, Sahin M, Prabhu SP, Warfield SK. Characterizing brain tissue by assessment of the distribution of anisotropic microstructural environments in diffusion-compartment imaging (DIAMOND). Magnetic Resonance in Medicine 76 (2016) 963–977.
15. Magdoom KN, Pajevic S, Dario G, Basser PJ. A new framework for MR diffusion tensor distribution. Scientific Reports 11 (2021) 2766.
16. Setsompop K, Kimmlingen R, Eberlein E, Witzel T, Cohen-Adad J, McNab J, et al. Pushing the limits of in vivo diffusion MRI for the Human Connectome Project. NeuroImage 80 (2013) 220–233.
17. McNab JA, Edlow BL, Witzel T, Huang SY, Bhat H, Heberlein K, et al. The Human Connectome Project and beyond: Initial applications of 300mT/m gradients. NeuroImage 80 (2013) 234–245.
18. Huang SY, Nummenmaa A, Witzel T, Duval T, Cohen-Adad J, Wald LL, et al. The impact of gradient strength on in vivo diffusion MRI estimates of axon diameter. NeuroImage 106 (2015) 464–472.
19. Fan Q, Nummenmaa A, Witzel T, Zanzonico R, Keil B, Cauley S, et al. Investigating the Capability to Resolve Complex White Matter Structures with High b-Value Diffusion Magnetic Resonance Imaging on the MGH-USC Connectom Scanner. Brain Connectivity 4 (2014) 718–726.
20. Keil B, Blau JN, Biber S, Hoecht P, Tountcheva V, Setsompop K, et al. A 64-channel 3T array coil for accelerated brain MRI. Magnetic Resonance in Medicine 70 (2013) 248–258.
21. Huang SY, Fan Q, Machado N, Eloyan A, Bireley JD, Russo AW, et al. Corpus callosum axon diameter relates to cognitive impairment in multiple sclerosis. Annals of Clinical and Translational Neurology 6 (2019) 882–892.
22. Huang SY, Tian Q, Fan Q, Witzel T, Wichtmann B, McNab JA, et al. High-gradient diffusion MRI reveals distinct estimates of axon diameter index within different white matter tracts in the in vivo human brain. Brain Structure and Function 225 (2020) 1277–1291.
23. Song YQ, Venkataramanan L, Hurlimann MD, Flaum M, Frulla P, Straley C. T1-T2 correlation spectra obtained using a fast two-dimensional Laplace inversion. J. Magn. Reson. 154 (2002) 261–268.
24. Venkataramanan L, Song YQ, Hurlimann MD. Solving fredholm integrals of the first kind with tensor product structure in 2 and 2.5 dimensions. IEEE Trans. Signal Proc. 50 (2002) 1017–1026.25. Bishop CM. Pattern recognition and machine learning (New York: Springer Science+Business Media, LLC) (2006).
26. Stadlbauer A, Buchfelder M, Salomonowitz E, Ganslandt O. Fiber Density Mapping of Gliomas: Histopathologic Evaluation of a Diffusion-Tensor Imaging Data Processing Method. Radiology 257 (2010) 846–853.
Figures