4485
Comparison of analytical BOLD-fMRI models against Two-Photon Microscopy and Monte Carlo simulations1Physics, Engineering Physics and Optics, Laval University, Quebec City, QC, Canada, 2Physics, University of Sherbrooke, Sherbrooke, QC, Canada, 3Radiology and Nuclear Medicine, Laval University, Quebec City, QC, Canada
Synopsis
BOLD fMRI arises from a complex physiological and physical cascade of events taking place at the level of the cortical microvasculature which constitutes a medium with complex geometry. Several analytical models of the BOLD contrast have been developed but these have not been compared directly against detailed bottom-up modeling methods. Using a recent 3D modeling method based on Two-Photon Microscopy and Monte Carlo simulations, we tested the accuracy of two analytical models to predict the amplitude of the BOLD response at 1.5T, 3T, 4.7T and 7T for both gradient echo and spin echo acquisition protocols.
Introduction
The BOLD contrast in fMRI arises from the combination of a complex cascade of physiological events together with physical phenomena taking place inside and outside the cortical microvasculature which itself has a complex geometry. Since the advent of fMRI, several analytical models have been developed1-4 to better understand the origin of the signal and to predict its behavior with respect to different acquisition parameters and scanner magnet strengths. These models relied on several physical, geometrical and physiological assumptions, some of which have been proven to be more or less accurate5. With the advent of Two-Photon Microscopy (TPM), new computational models have been developed to better take into account the complex geometry and physiology of the cortical microvasculature6. While these new modeling methods better capture the complexity of the BOLD signal, their heavy computational requirement limits their utilization in statistical parametric mapping and in physiological parameter estimation i.e. inverse problems. Our goal was to test the accuracy of some widely used analytical models3-4 to predict the amplitude of the BOLD response at 1.5T, 3T, 4.7T and 7T as a function of the echo time (TE) in both the gradient echo (GRE) and spin echo (SE) acquisition protocol.Methods
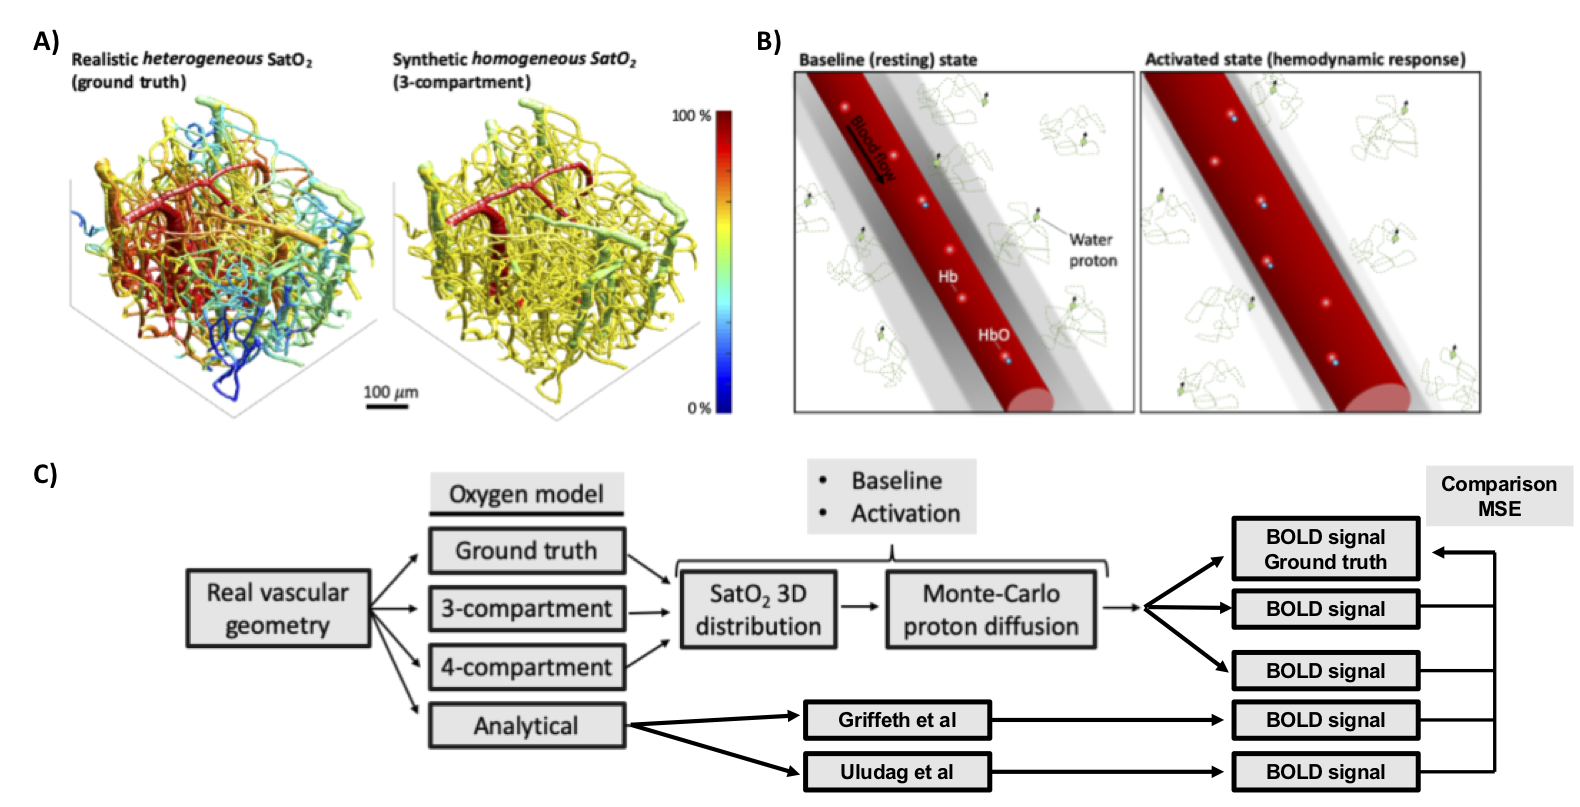
Our approach used a bottom-up model of BOLD fMRI based on Monte-Carlo (MC) simulations of proton diffusion in a realistic vascular network spanning a 600 x 600 x 600 μm3 voxel. The realistic vascular geometry was provided by 3D images of the cortical vasculature measured using TPM in 5 mice. The vessel diameters and the oxygen distribution (SatO2) during baseline state and neuronal activation were computed using our vascular anatomical network (VAN) model together with TPM measurements of SatO2 and cerebral blood flow (CBF) as inputs and boundary conditions6. This model has been previously published and validated against experimental data. This model was considered our ground truth against which the other reduced VAN models and analytical models were quantitatively compared using a mean square error (MSE) metric. Four different reduced models were compared to the ground truth:1-A reduced 3D model where the real two-photon microvascular geometry was populated with mean SatO2 values for each vascular compartment e.g. arteries, capillaries and veins (MC 3 Comp) as used in Genois et al7.
2-Same as model 1 but where the venous compartment was further subdivided into two sub-compartments based on a vessel branching order threshold e.g. arteries, capillaries, venules and veins (MC 4 Comp).
3-The analytical model developed by Uludag et al3
4-The analytical model developed by Griffeth et al4 at 3T and extended from 1.5T to 7T using physical and physiological parameters used in the literature.
A schematic over view of the method is shown in Fig 1.
Results
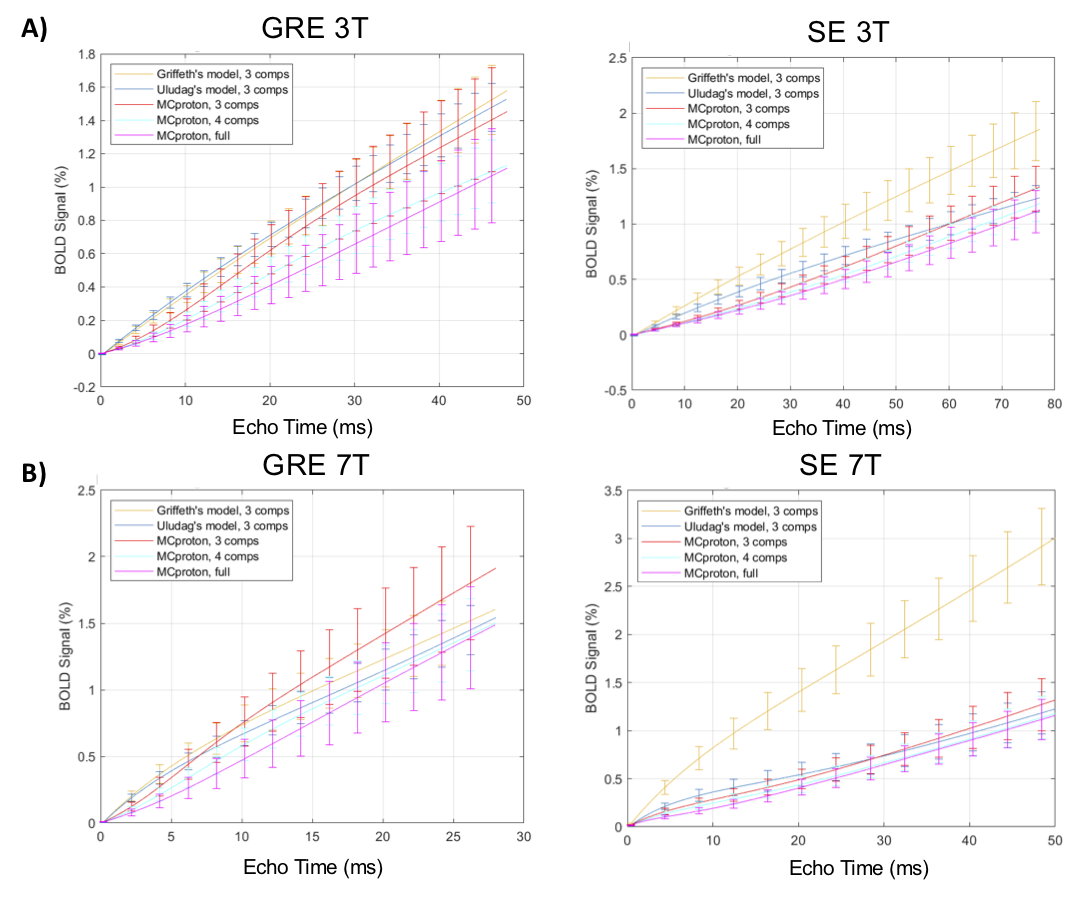
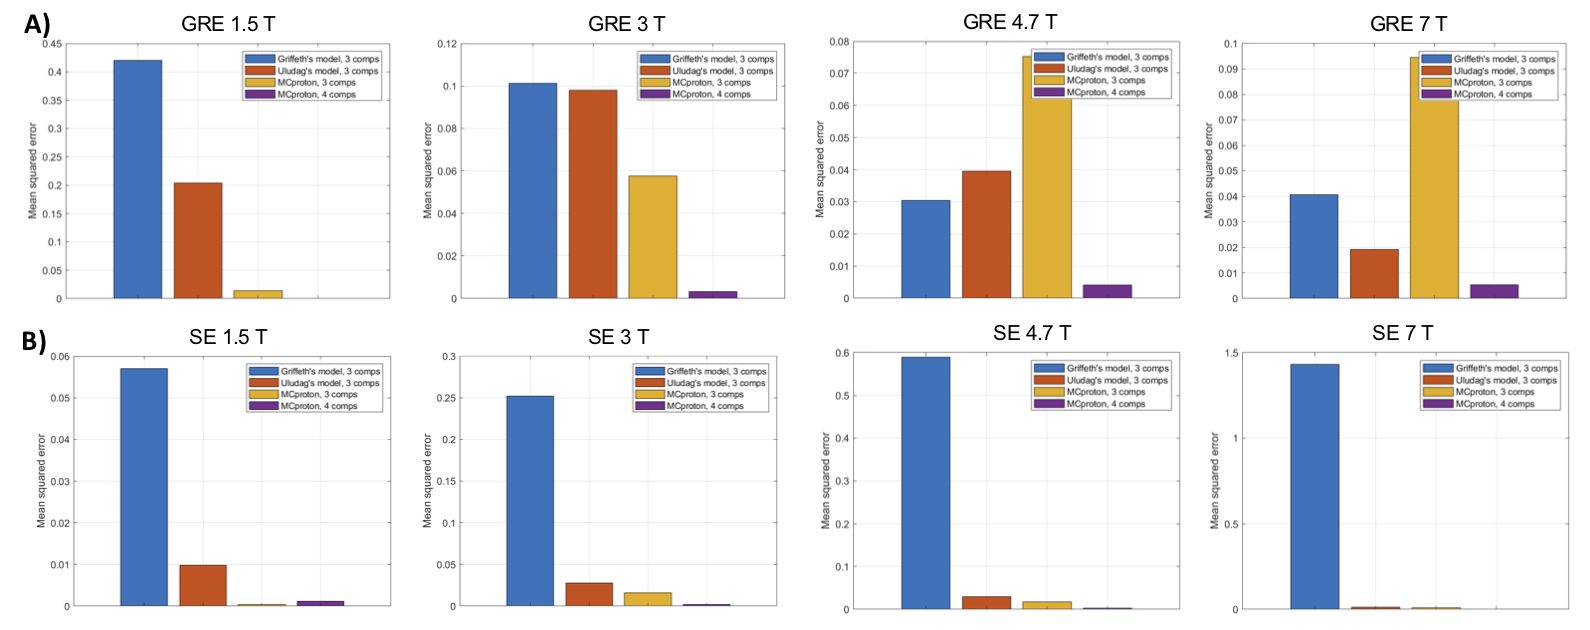
The time evolution of the BOLD signals simulated with our MC methods and the two analytical model are shown in Fig 2A for 3T and in Fig 2B for 7T. The qualitative behavior of the time evolution is very similar whether a MC or an analytical model is used i.e. a monotonic, close to linear increasing curve is obtained in each case. Small differences in the amplitudes are obtained. The MSEs computed between the ground truth model and each of the other four models are shown in Fig 3 for both GRE and SE at 1.5T, 3T, 4.7T and 7T. We see that the analytical models perform as well as MC model to predict the amplitude of the BOLD signal given the magnet field strength, the acquisition scheme (GRE or SE) and the TE used. As the magnet strength increases from 1.5T to 7T, we see that compartmentalizing the VAN model in three compartments results in erroneous larger GRE BOLD responses but that further subdividing the venous compartment of the synthetic VAN removed this erroneous offset.Discussion
Good performance of the two widely used analytical BOLD models are not surprizing since these models were developed by updating existing early models and further optimizing them based on more than 15 years of experimental data. However, our results confirm using a novel and validated bottom-up approach that these analytical models are accurate. The amplitude offset of the SE signal simulated with the Griffeth model at all B0-field strength (Fig 3B) can be explained by the fact that this model was originally developed for GRE and naïvely extended to SE in our work. The better performance of the four-compartment MC model over the three-compartment MC indicates that taking into account the biphasic behavior of SatO2 as a function of branching order provides a more realistic description of the physical and physiological origins of the BOLD response. Further statistical analysis of the SatO2 distributions in our TPM stack will be required to better identify the causal mechanism responsible for this biphasic behavior.Conclusions
Our work provides confidence that widely used analytical BOLD models are accurate to predict the amplitude of the BOLD response. This will allow researchers to better optimize their acquisition schemes and parameter selection to improve the signal-to-noise given their experimental constrains. Our results also indicate that more work needs to be done to better characterize the distribution of oxygen in the venous compartment and its impact on the BOLD response.Acknowledgements
We thank David Boas and Anna Devor for sharing their microscopy data.References
1. Ogawa et al. Functionnal brain mapping by blood oxygenation level-dependent contrast magnetic resonance imaging A comparison of signal characteristics with a biophysical model. Biophys J. 1993(64):803-812
2. Buxton et al. Dynamics of blood flow and oxygenation changes during brain activation: the balloon model. Mag. Reson. Med. 1998(39):855-864
3. Uludag et al. An integrative model for neuronal activity-induced signal changes for gradient and spin echo functional imaging. Neuroimage 2009(48):150-165
4. Griffeth et al. A theoretical framework for estimating cerebral oxygen metabolism changes using the calibrated-BOLD method: modeling the effects of blood volume distribution, hematocrit, oxygen extraction fraction, and tissue signal properties on the BOLD signal. Neuroimage 2011(58):198-212
5. Drew et al. Fluctuating and sensory-induced vasodynamics in rodent cortex entend arteriole capacity. PNAS 2011(108):8473-8478
6. Gagnon et al. Quantifying the Microvascular Origin of BOLD-fMRI from First Principles with Two-Photon Microscopy and an Oxygen-Sensitive Nanoprobe. J Neuroscience 2015(35):3663-3675
7. Genois et al. Modeling of vascular space occupancy and BOLD functional MRI from first principles using real microvascular angiograms. Mag. Reson. Med 2021(85):456-468
Figures