4484
A simulation study of the negative impact of fat on the accuracy of T1 measurements1Department of Radiology, Stanford University, Palo Alto, CA, United States, 2Biomedical Engineering and Imaging Institute and Department of Radiology, Icahn School of Medicine at Mount Sinai, New York, NY, United States
Synopsis
A simulation study examining the effects of fat in the accurate assessment of T1. The study looks at both the variable flip angle and Look-Locker methods, and different fat fractions and different T1 values are used in the simulation. The results indicated that while both VFA and Look-Locker methods’ accuracy are affected by fat, VFA method’s biases increases more rapidly as fat fraction goes up, and the bias for larger spin species with larger T1s are more severely impacted by the presence of fat.
Introduction
Quantitative measurement of the spin-lattice relaxation time has various applications in the clinic1–3. There are generally two types of T1 measurement techniques that have wide clinical deployment. One is the variable flip angle (VFA) technique4 and the other one is the Look-Locker5 method. T1 values from an accurate quantitative measurement technique should be independent from the imaging parameters used. However, it has been shown that the Look-Locker method is sensitive to variation of echo time (TE) when fat is present in the target tissues6. In this abstract, we aimed to perform Bloch simulation to demonstrate this and to compare the performance of the VFA and Look-Locker methods for T1 estimation in presence of fat.Technique and Methods
VFA method acquires multiple sets of images with different flip angles (FA) to measure the T1 values. The signal model for the VFA method7 is as follows:$$S_{SPGR}=\frac{\rho(1-e^{-TR/T_{1}})\sin\alpha_{n}}{1-e^{-TR/T_{1}}\cos\alpha_{n}}$$
where ρ is the proton density, TR is the echo time, and $$$\alpha_{n}$$$ is the multiple FAs used in the imaging process. This equation can be rewritten into a linear form:
$$ \frac{S_{SPGR}}{\sin{\alpha_{n}}}=\frac{S_{SPGR}}{\tan\alpha_{n}}e^{-TR/T_{1}}+\rho(1-e^{-TR/T_{1}})$$
with Eq. 2, the T1 and proton density can be fitted by measuring the slope (m) and intercept (b) of the line equation:
$$T_{1}=-TR/ln(m)$$
$$\rho=b/(1-m)$$
For the Look-Locker method, the signal model under a small FA can be expressed as follow8:
$$M(t)=A-Be^{-t/T_{1}^{*}}$$
where
$$A=M_{ss}=\frac{M_{0}(1-e^{-TR/T_{1}})}{1-\cos\alpha e^{-TR/T_{1}}}=\frac{M_{0}(1-e^{-TR/T_{1}})}{1-e^{-TR/T_{1}^{*}}}\approx M_{0}\frac{T_{1}^{*}}{T_{1}}$$
$$B=M+M_{ss}=M+M_{0}\frac{T_{1}^{*}}{T_{1}}$$
$$$T_{1}^{*}$$$ is the apparent recovery time under a constant imaging FA. With the 3-parameter model, T1 can be calculated as:
$$T_{1}=T_{1}^{*}(\frac{B}{A}-1)$$
Since fat signal has a different phase than water, both VFA and Look-Locker methods’ T1 measurement accuracy will be affected by the presence of fat. In this abstract a detailed Bloch simulation will be used to analyze the impact of different fat fraction to both methods’ accuracy.
Results and discussion
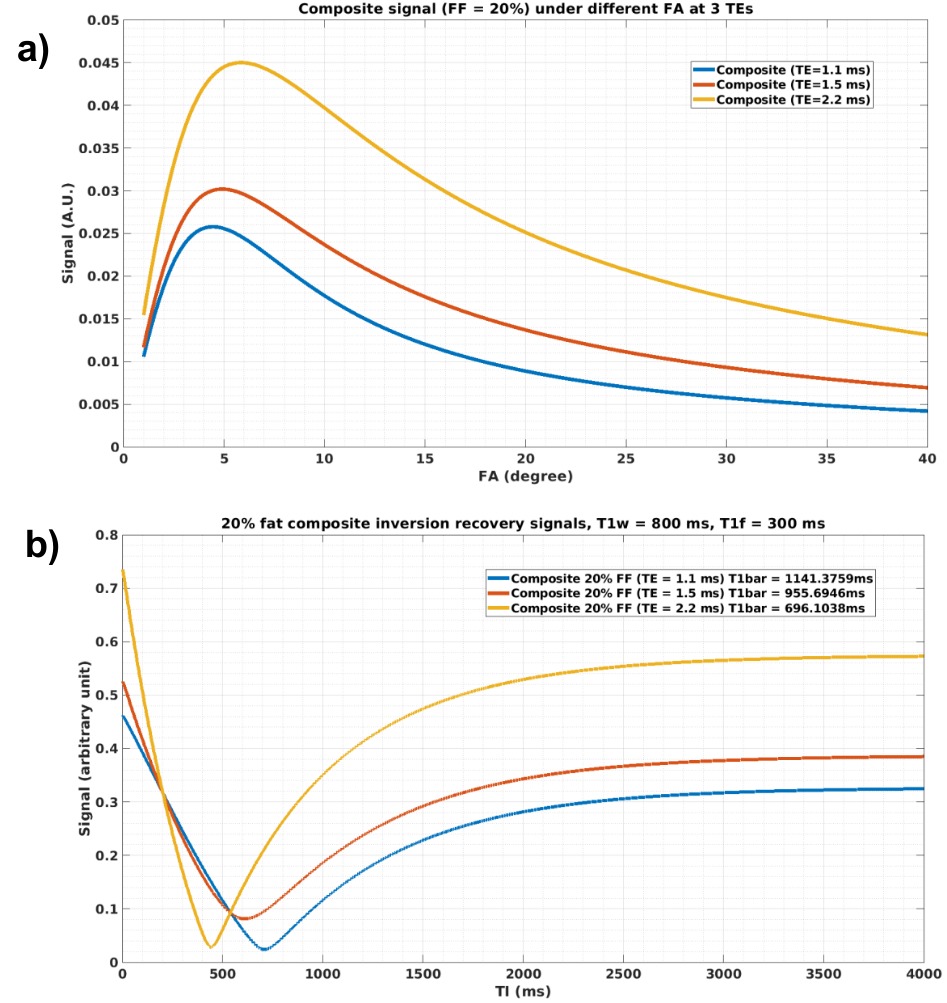
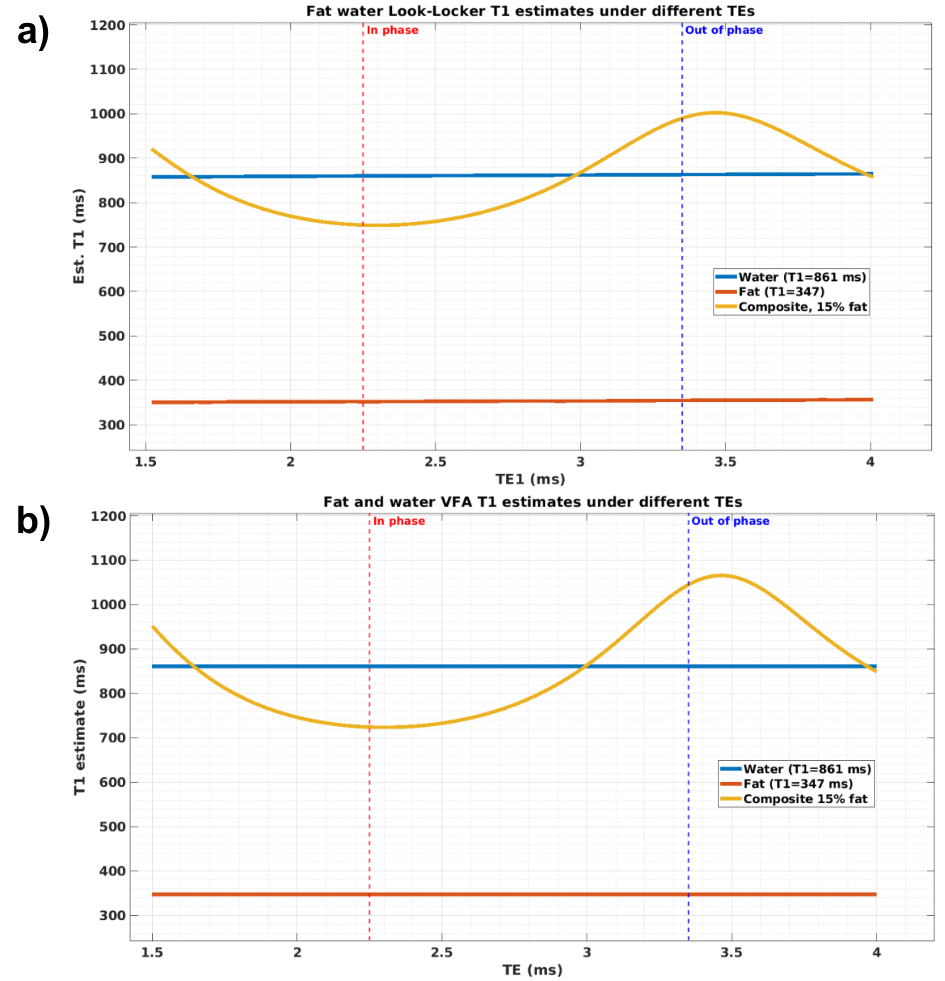
The signal evolution of both VFA and Look-Locker technique is shown in Figure 1. In presence of fat, both methods have signal evolution that changes significantly with the different choices of TEs. For the VFA method, varying TE leads to a different Ernst angle, resulting in a bias in the estimated T1. For the Look-Locker method, varying TE leads to changes in both the recovery curve’s zero crossing point as well as the steady state signal level, ultimately ends up with a biased T1 estimation. Another detail to note is that due to the different phases the water and multiple peaks of fat component have, there is no longer a true zero-cross any more for the Look-Locker method, which could potentially affect the T1 estimate as well.A closer analysis of the biases due to the change of TE is shown in Figure 2 with a fat fraction of 15%. The figure shows that both the VFA and Look-Locker methods have a similar T1 pattern with respect to variation of TE. The largest underestimation of T1 occurs at a TE when the main fat peak and the water component are in phase, and the highest overestimation of T1 occurs when the main fat peak and the water component are out of phase. Although both methods have a similar T1 pattern over TEs, the VFA method has a larger bias with the same fat fraction.
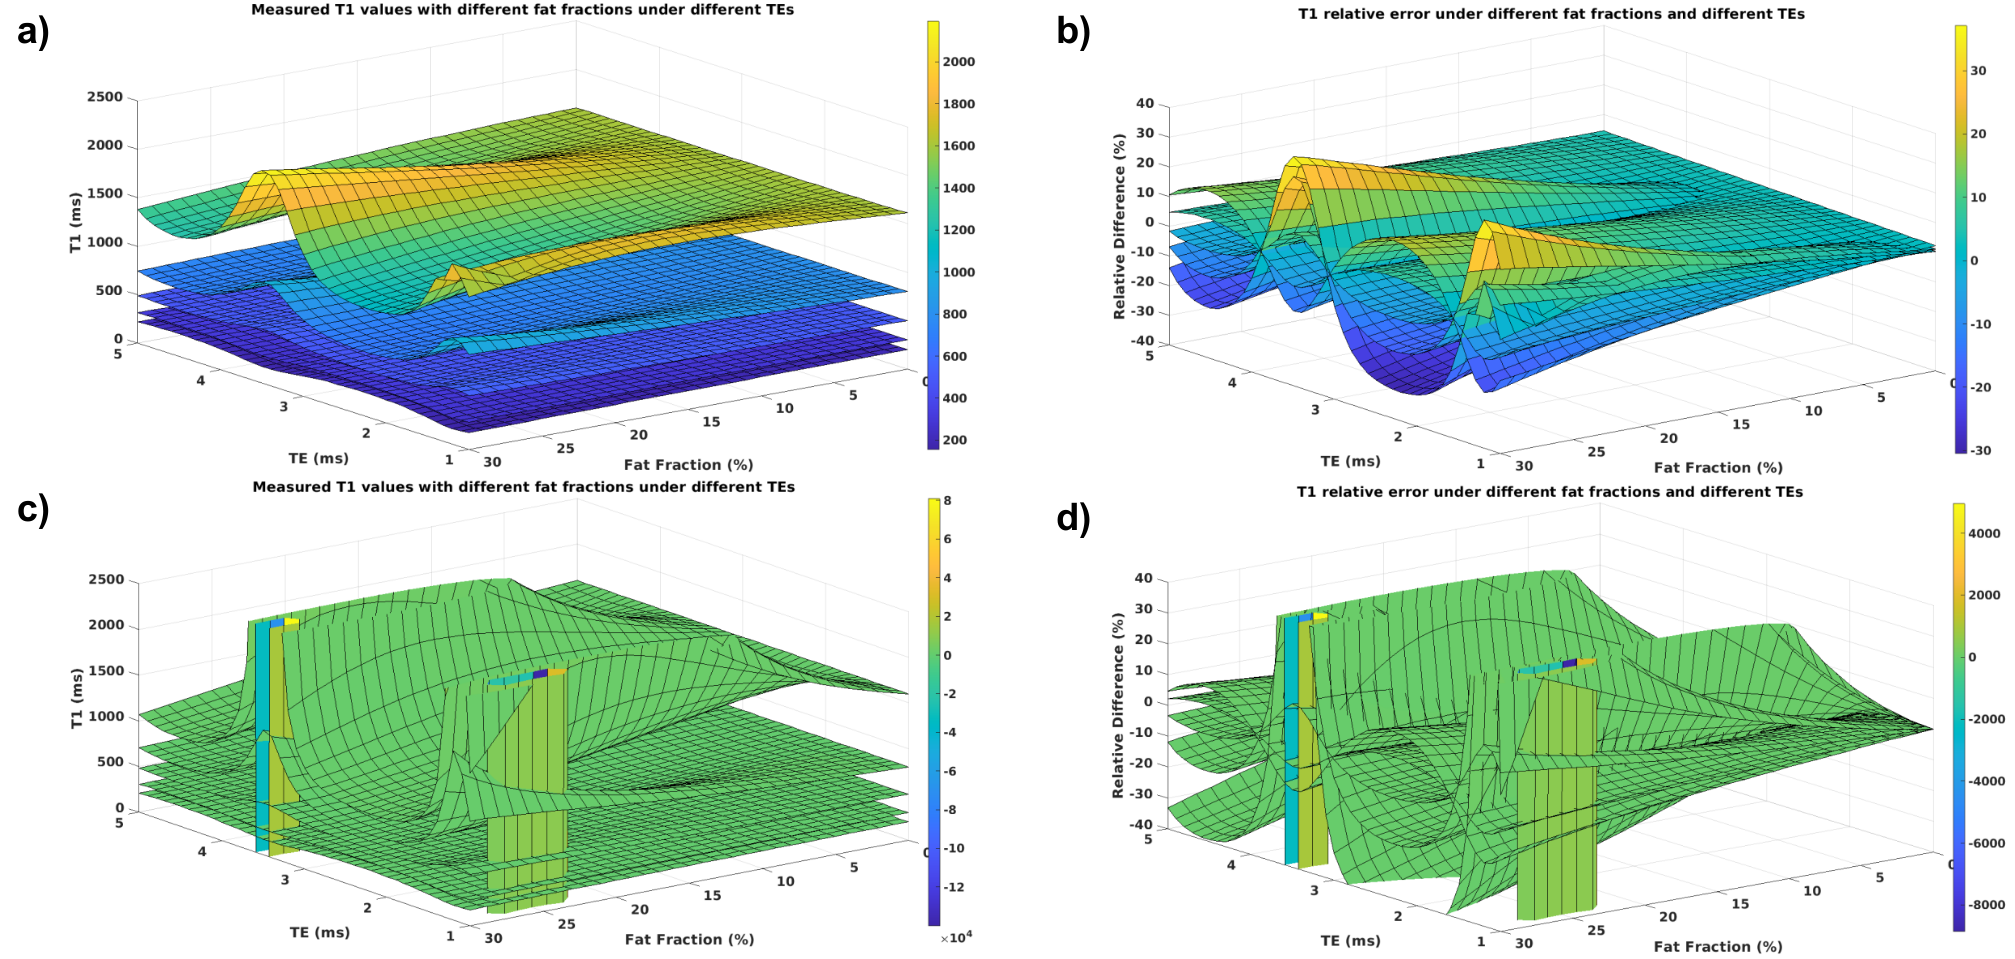
A further study with different fat fractions is shown in Figure 3. As the fat fraction increases, both methods start to have increased biases in T1 estimation. However, the VFA method has larger biases compared to the Look-Locker method.
Considering the fact that the VFA method is also sensitive to the B1 inhomogeneity, the Look-Locker method has clear advantages for more accurate T1 estimation in presence of fat, and the fat-induced biases in Look-Locker also makes it important to have a T1 method that is capable to generate water-specific T1 values.
Conclusion
In this abstract, we have analyzed the impact of fat on the accuracy of T1 estimations for two most commonly used T1 mapping techniques via detailed Bloch simulations. The results indicated that the Look-Locker method can have a better accuracy with better robustness in T1 estimation than the VFA method in presence of fat.Acknowledgements
NIH R01 EB030549, NIH R01 EB009690, NIH U01 EB029427, and GE HealthcareReferences
1. Woermann FG, Free SL, Koepp MJ, Ashburner J, Duncan JS. Voxel-by-voxel comparison of automatically segmented cerebral gray matter - A rater-independent comparison of structural MRI in patients with epilepsy. Neuroimage. 1999;10(4):373-384. doi:10.1006/nimg.1999.0481
2. Coolen BF, Poot DHJ, Liem MI, et al. Three-dimensional quantitative T1 and T2 mapping of the carotid artery: Sequence design and in vivo feasibility. Magn Reson Med. 2016;75(3):1008-1017. doi:10.1002/mrm.25634
3. Fennessy FM, Fedorov A, Gupta SN, Schmidt EJ, Tempany CM, Mulkern R V. Practical considerations in T1 mapping of prostate for dynamic contrast enhancement pharmacokinetic analyses. Magn Reson Imaging. 2012;30(9):1224-1233. doi:10.1016/j.mri.2012.06.011
4. Christensen KA, Grant DM, Schulman EM, Walling C. Optimal determination of relaxation times of Fourier transform nuclear magnetic resonance. Determination of spin-lattice relaxation times in chemically polarized species. J Phys Chem. 1974;78(19):1971-1976. doi:10.1021/j100612a022
5. Look DC, Locker DR. Time saving in measurement of NMR and EPR relaxation times. Rev Sci Instrum. 1970;41(2):250-251. doi:10.1063/1.1684482
6. Mozes FE, Tunnicliffe EM, Pavlides M, Robson MD. Influence of fat on liver T1 measurements using modified Look–Locker inversion recovery (MOLLI) methods at 3T. J Magn Reson Imaging. 2016;44(1):105-111. doi:10.1002/jmri.25146
7. Deoni SCL. High-resolution T1 mapping of the brain at 3T with driven equilibrium single pulse observation of T1 with high-speed incorporation of RF field inhomogeneities (DESPOT1-HIFI). J Magn Reson Imaging. 2007;26(4):1106-1111. doi:10.1002/jmri.21130
8. Deichmann R, Haase A. Quantification of T1 values by SNAPSHOT-FLASH NMR imaging. J Magn Reson. 1992;96(3):608-612. doi:10.1016/0022-2364(92)90347-A
Figures