4479
High-resolution, high-contrast MRI protocol with extended delayed imaging for peritoneal mesothelioma1Department of Radiology, The University of Chicago, Chicago, IL, United States, 2Department of Surgery, The University of Chicago, Chicago, IL, United States, 3Department of Surgery B, Chaim Sheba Medical Center, Ramat Gan, Israel, 4Department of Surgery, University of Iowa, Iowa City, IA, United States, 5Department of Medicine, The University of Chicago, Chicago, IL, United States
Synopsis
Improved methods for visualizing malignant peritoneal mesothelioma are needed. A high-resolution, high-contrast MRI protocol at 3T, including multiple delayed phases, was tested in 18 patients scheduled for laparoscopy/laparotomy. Both contrast washout and ongoing uptake was observed in individual lesions, pointing to a need for imaging with both short and long post-contrast delay times for optimal sensitivity. The per-patient average uptake/washout rate was significantly correlated with the cumulative nuclear score on pathology. The tested MRI protocol is feasible and may allow for more accurate visualization of peritoneal lesions and better guidance of management options.
INTRODUCTION
Malignant peritoneal mesothelioma (MPM) necessitates careful diagnostic assessment prior to attempting definitive surgical resection, yet radiographic assessment is challenging due to frequently small tumor size or thickness, similar density and signal intensity to adjacent structures, variable distribution of disease, and unpredictable contrast enhancement.1,2 MRI can provide significantly better tissue discrimination of disease, relative to the current standard of CT imaging, and affords the ability to optimize for contrast enhancement.3-6 We introduce a novel, high-resolution (HR) MRI protocol with extended delayed imaging for improved visualization of MPM. We examine the pattern of MPM signal enhancement and washout to identify optimal post-contrast imaging delay time.METHODS
In this IRB-approved study, 18 patients (mean age 58 years ± 12; 67% male) with MPM scheduled for laparoscopy/laparotomy were imaged with a novel MRI protocol on a 3T Philips Ingenia dStream scanner. The first 4 patients were scanned for purposes of protocol development and their data was not included in further analysis. The standard clinical portion of the MRI protocol included pre-contrast axial 2D T2w and coronal 2D T2w, pre-contrast free breathing axial T2w with fat saturation, and pre-and post-contrast (10 min delay) axial 3D T1w sequences at spatial resolutions of 1.2-1.7 mm in-plane. Novel sequences introduced were (1) a pre-contrast free breathing HR coronal 2D T2w sequence at 0.8 mm spatial resolution and (2) pre- and post-contrast 3-breatholds HR coronal 3D T1w mDixon sequences with 1.2 mm spatial resolution, centered on the liver dome and acquired with an approximately 7, 13, 16, and 20 min delay after injection of a double dose of gadoterate meglumine.An experienced radiologist identified MPM lesions with reference to laparoscopy and outlined regions of interest (ROIs) for lesions, muscle, fat, and liver. Lesion and tissue signal were measured as ROI-averaged on the HR coronal 3D T1w images, and lesion signal was normalized to that of fat at each post-contrast timepoint. The contrast agent kinetics was assessed by modeling the normalized lesion signal as a linear function of time, with the slope Sl > 0 signifying continuing contrast agent uptake, and Sl < 0 signifying contrast washout.
The correlation of Sl with lesion shape (mass vs linear) was analyzed on a per-lesion basis. The average of Sl over all identified lesions was correlated with histologic grade, pathology score, presence of heart disease, prior chemotherapy status, and age on a per-patient basis. Qualitative image quality evaluations were performed by three blinded radiologists.
RESULTS
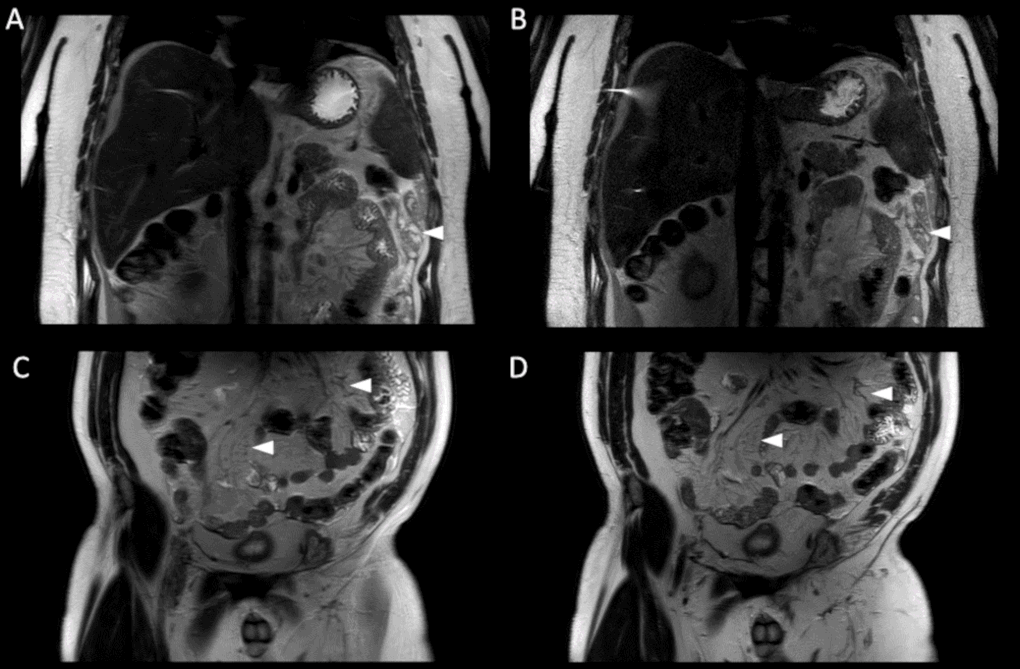
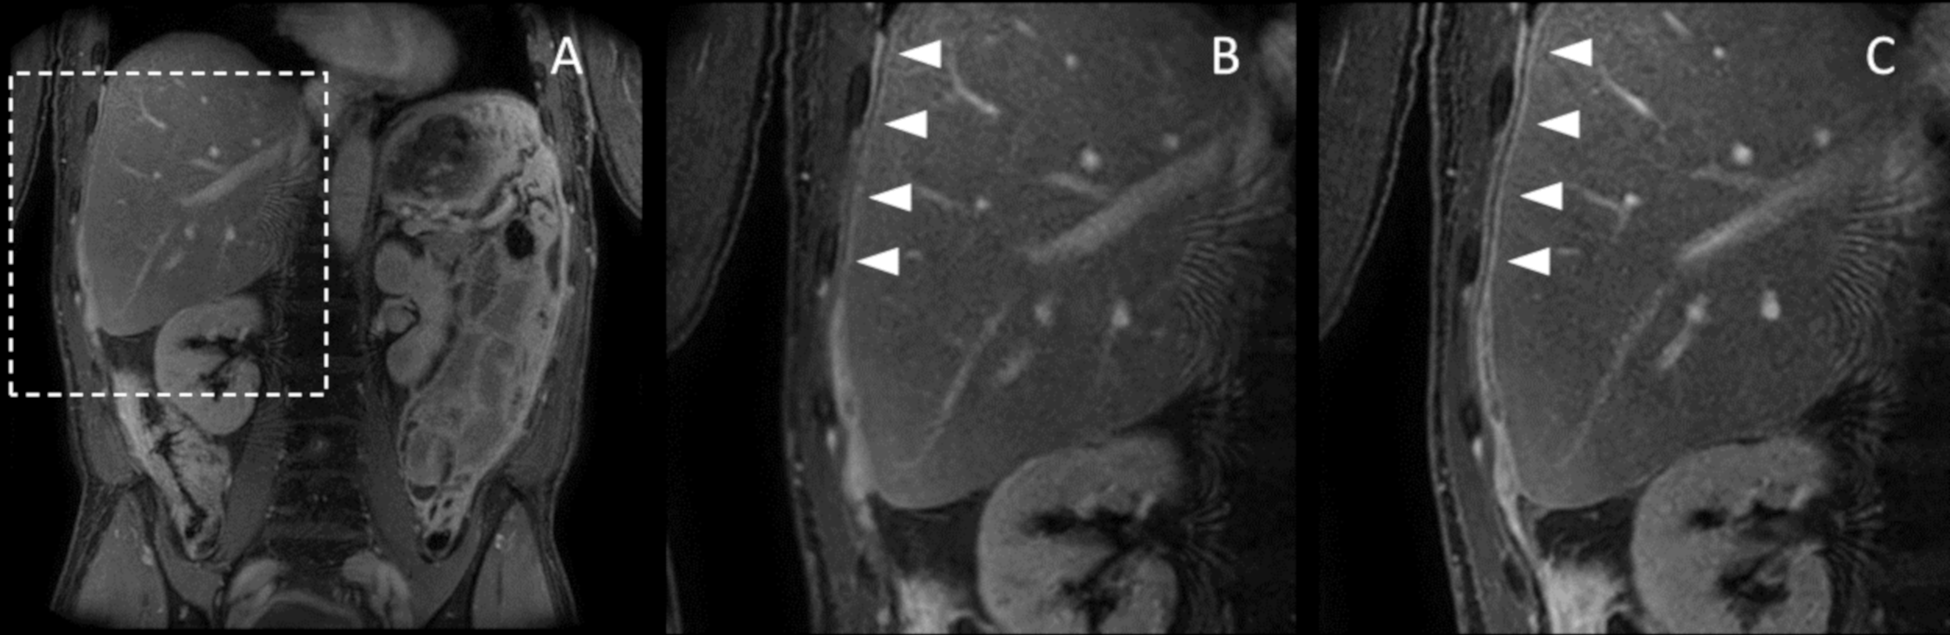
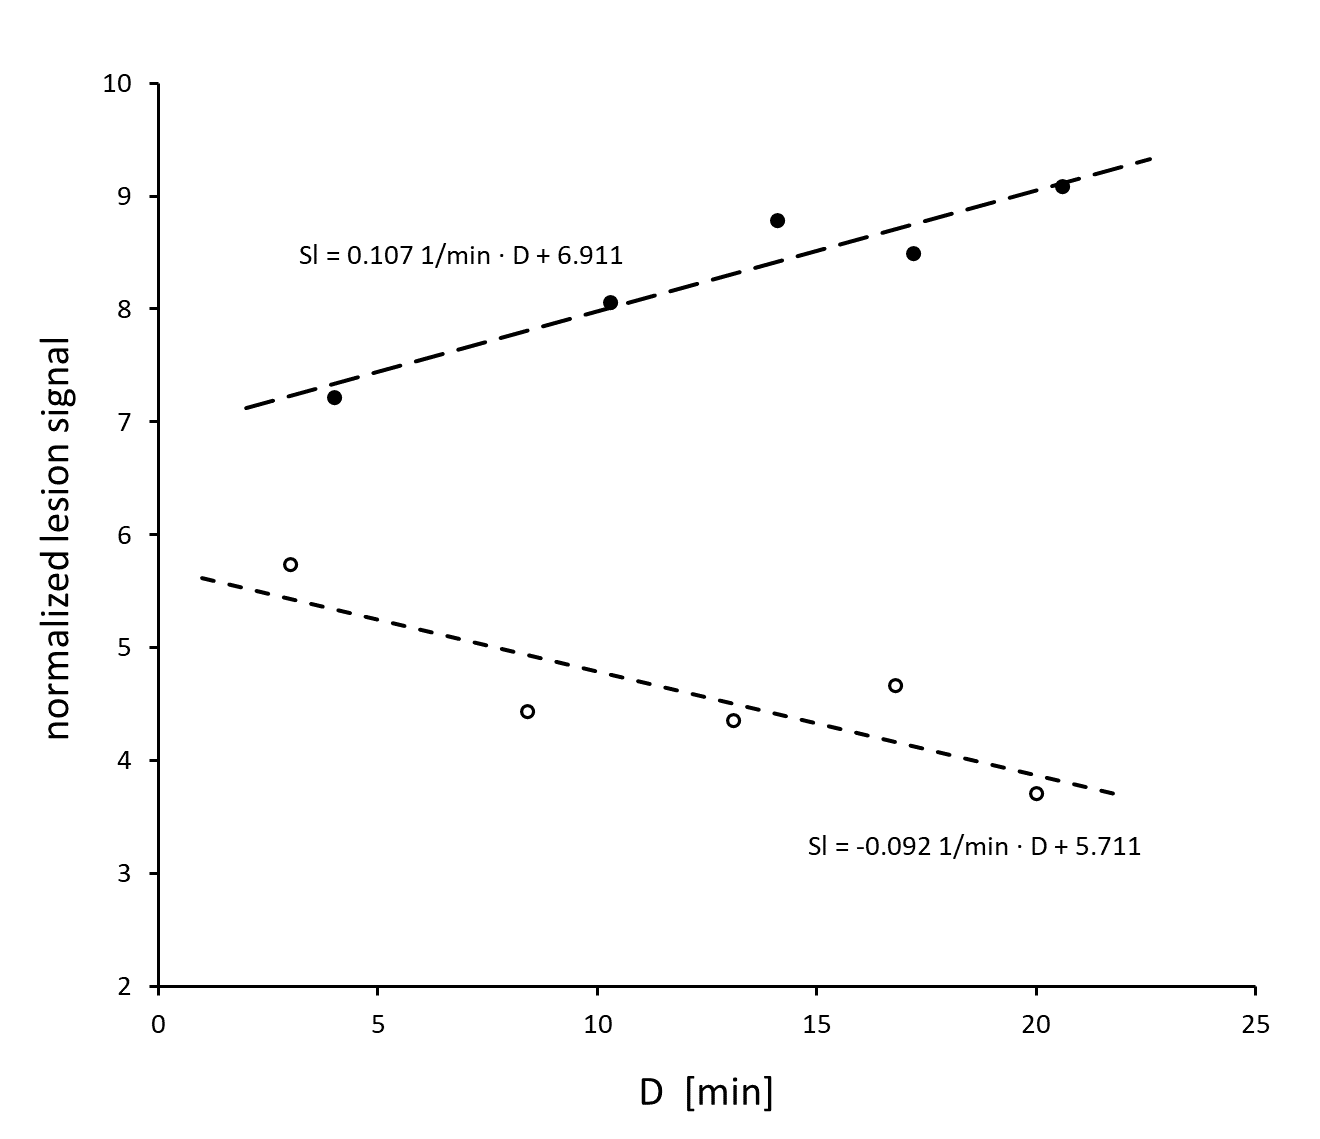
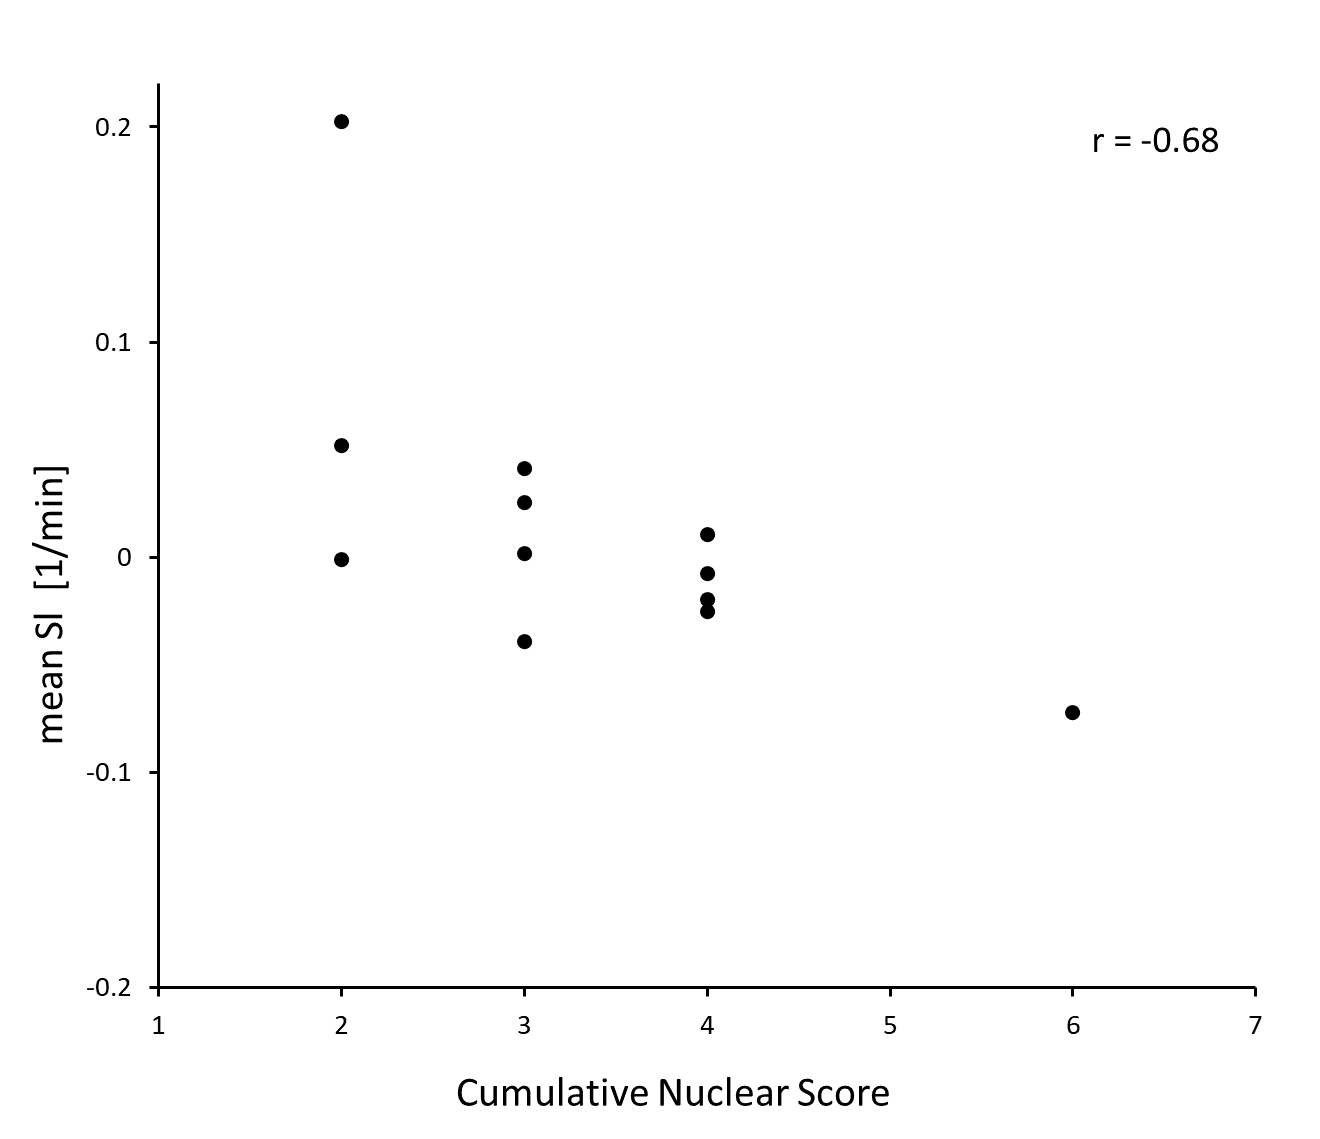
Figure 1 depicts examples of HR coronal 2D T2w images obtained through the abdomen and pelvis of two subjects. Although the high-resolution images are limited by signal-to-noise ratio (SNR), the structures are sharper than in standard-of-care T2-weighted images. Figure 2 depicts examples of delayed post-contrast HR coronal 3D T1w mDixon images in 4 subjects. Anatomical structures are shown with sharp detail and lesion enhancement is evident. Figure 3 illustrates frequently observed increase in lesion contrast with longer post-contrast delay times. Figure 4 depicts normalized signal dependence over time, for two representative lesions with contrast washout or ongoing uptake.On average, 3.7 lesion ROIs were outlined per subject (range: 2-6; total 52 lesions (38 mass, 14 linear type)). On per-lesion analysis, no statistically significant differences were observed between linear vs mass lesions in average slope or in proportion of lesions with positive slopes. On per-patient analysis, the Spearman’s coefficient of correlation between mean Sl and cumulative nuclear score was r = -0.68 (p < 0.02; Figure 5). On qualitative analysis of delayed post-contrast HR coronal 3D T1w mDixon images, the cumulative nuclear score was significantly correlated with reader preference (r = 0.65, p = 0.02) for one of the readers, but not for all readers combined. No statistically significant differences were found in mean Sl between groups with and without cardiac disease, prior chemotherapy, or prior cancer reduction surgery (p > 0.1).
DISCUSSION
Several technical advances were introduced: (1) two HR sequences were implemented, (2) a double dose of contrast agent was used to enhance lesion visibility, and (3) late delayed sequences were acquired for extended contrast kinetics monitoring. The observed correlation of Sl to pathology means that both earlier and later delayed phases could increase the diagnostic accuracy of an MRI exam. This finding is interesting, as earlier studies have not evaluated delay times longer than 10 minutes.7-11 Due to the similarity of contrast kinetics of CT and most MRI contrast agents, our results are generalizable and could lead to further optimization of the post-contrast imaging timing in peritoneal mesothelioma for both MRI and CT.CONCLUSION
We demonstrated the feasibility of a high-resolution, high-contrast MRI protocol for imaging of peritoneal mesothelioma and observed that both early and late delayed imaging could improve lesion visibility. A moderately delayed (7-12 min) T1w sequence may be more sensitive to high-grade MPM, while a longer delay (15+ min) may be more sensitive in patients with low-grade MPM.Acknowledgements
This work was supported by Irving Harris Foundation, The University of Chicago Comprehensive Cancer Center, and the following grants: NCATS/NIH UL1 TR000430 and NIH T32CA078586.References
1. Group CCW. The Chicago Consensus Guidelines for Peritoneal Surface Malignancies: Introduction. Ann Surg Oncol. 2020;27(6):1737-40.
2. Yan TD, Deraco M, Baratti D, et al. Cytoreductive surgery and hyperthermic intraperitoneal chemotherapy for malignant peritoneal mesothelioma: multi-institutional experience. J Clin Oncol. 2009;27(36):6237-42.
3. Kusamura S, Kepenekian V, Villeneuve L, et al. Peritoneal mesothelioma: PSOGI/EURACAN clinical practice guidelines for diagnosis, treatment and follow-up. Eur J Surg Oncol. 2021;47(1):36-59.
4. Laghi A, Bellini D, Rengo M, et al. Diagnostic performance of computed tomography and magnetic resonance imaging for detecting peritoneal metastases: systematic review and meta-analysis. Radiol Med. 2017;122(1):1-15.
5. Low RN, Barone RM, Rousset P. Peritoneal MRI in patients undergoing cytoreductive surgery and HIPEC: History, clinical applications, and implementation. Eur J Surg Oncol. 2021;47(1):65-74.
6. Yamamuro M, Gerbaudo VH, Gill RR, Jacobson FL, Sugarbaker DJ, Hatabu H. Morphologic and functional imaging of malignant pleural mesothelioma. Eur J Radiol. 2007;64(3):356-66.
7. Elsayes KM, Staveteig PT, Narra VR, Leyendecker JR, Lewis JS, Jr., Brown JJ. MRI of the peritoneum: spectrum of abnormalities. AJR Am J Roentgenol. 2006;186(5):1368-79.
8. Low RN. Gadolinium-enhanced MR imaging of liver capsule and peritoneum. Magn Reson Imaging Clin N Am. 2001;9(4):803-19, vii.
9. Low RN. Preoperative and surveillance MR imaging of patients undergoing cytoreductive surgery and heated intraperitoneal chemotherapy. J Gastrointest Oncol. 2016;7(1):58-71.
10. Patel A, Roshkovan L, McNulty S, et al. Delayed-Phase Enhancement for Evaluation of Malignant Pleural Mesothelioma on Computed Tomography: A Prospective Cohort Study. Clin Lung Cancer. 2021;22(3):210-7.e1.
11. Patel AM, Berger I, Wileyto EP, et al. The value of delayed phase enhanced imaging in malignant pleural mesothelioma. J Thorac Dis. 2017;9(8):2344-9.
Figures