4478
Monitoring Multi-Organ Stiffness Changes with MR Elastography in Amyloidosis Patients Treated with Stem Cell Therapy
Arvin Arani1, Jessica Magnuson1, Zheng Zhu1, Joshua D. Trzasko1, Yi Sui1, Devanshi Damani1, Kevin Glaser1, Matthew C. Murphy1, Meng Yin1, Angela Dispenzieri1, Richard L. Ehman1, Sudhakar K. Venkatesh1, and Philip A. Araoz1
1Mayo Clinic, Rochester, MN, United States
1Mayo Clinic, Rochester, MN, United States
Synopsis
Light chain (AL) cardiac amyloidosis is a disease where abnormal proteins are deposited in multiple organs and is associated with elevated tissue stiffness. In cases with poor prognosis, autologous hematopoietic stem cell transplantation (ASCT) is used for therapy. Organ response monitoring is currently limited and challenging. The objective of this study was to evaluate the feasibility of using magnetic resonance elastography (MRE) to monitor stiffness changes in multiple organs pre- and post- ASCT therapy. At 3 months post therapy, significant reduction in MRE stiffness (p<0.001) was observed in organs that exhibited successful therapy response (defined by 9 month clinical outcomes).
Introduction:
Amyloidosis is a disease in which abnormal proteins infiltrate organs, causing dysfunction. Amyloid is categorized by the type of protein and its folding. One of the most common types of amyloidosis is light chain (AL) amyloidosis. In AL amyloidosis plasma cell dyscrasias create excess immunoglobulin light chains, which form abnormal proteins that deposit in tissues including the heart, kidney, and liver(1). The worst prognosis in AL amyloidosis occurs with infiltration of the heart, which leads to myocardial thickening and heart failure(2). One popular treatment of AL amyloidosis is autologous hematopoietic stem cell transplantation (ASCT), which prevents further deposition of abnormal proteins. Organ response and progression is currently monitored with non-specific biomarkers like liver size and serum alkaline phosphatase. Amyloid infiltration causes increased tissue stiffness (3), including within the heart and liver. Shear wave elastography is an emerging imaging approach for measuring myocardial stiffness in vivo (4-13). Recently, cardiac magnetic resonance elastography (MRE) reported that patients with cardiac amyloidosis have significantly elevated myocardial stiffness (12) compared to healthy age-matched controls and that cardiac stiffness decreased 3-months after ASCT therapy(14). The goal of this study is to evaluate the feasibility of using magnetic resonance elastography (MRE) to monitor changes in stiffness in multiple organs (heart, liver, kidney, and spleen) before and after ASCT therapy for AL amyloidosis.Methods:
Five patients with AL amyloidosis were enrolled in this study prior to undergoing ASCT, and after receiving institutional review board and written informed consent approval. All subjects underwent cardiac and abdominal MRI/MRE prior to therapy (baseline) and at their scheduled approximate 3 month follow-up visit. Three patients had ASCT as part of their first line therapy; whereas 2 had ASCT as part of second line therapy. All patients achieved hematologic complete response to therapy. The mean age at time of enrollment to the MRE study was 58 (median: 59, max: 66, min: 51), with a mean follow-up time of 117.6 days (median: 114, max: 130, min: 106). MRE imaging was performed in 3 acquisitions using a vibration frequency of 140 Hz (heart), 60Hz (liver, spleen), and 90Hz (kidney) and 3 separate passive drivers using the same procedure as previously described (15). Two 1.5 hour imaging sessions at each timepoint were used to acquire all clinical cardiac MRI and multi-organ MRE data. The absolute change in mean stiffness (Δµ) before and after therapy adjusted to 100 day follow-up times was calculated for each organ. At 9 months post ASCT, a clinician with extensive experience in assessing AL amyloidosis, blinded to the MRE results, used internationally accepted methodology(16-18) to assess amyloid organ involvement and therapy response in the heart, liver, and kidney of each patient. A linear mixed effect model with Δµ as the outcome variable, and organ type, and amyloid involvement as fixed effects was used to determine the impact of ASCT on tissue stiffness. A Wilcoxon rank sum test was also applied by comparing the Δµ from organs with known amyloid involvement to those without. A p-value of less than 0.05 was considered statistically significant.Results:
Center-slice elastogram images of the left ventricle (LV) myocardium, liver (L), spleen (S), and kidney (K) for all 5 volunteers at baseline (B) and at their follow-up (FU) visit are shown in Figure 1. Absolute change in mean organ stiffness (kPa) for each of the 5 patients is plotted (circles) in Figure 2. A visual comparison between the percent change in endogenous T1-relaxation, cardiac ejection fraction and MRE measurements are given in Figure 3. In patients numbers 2, 3, and 4, the EF reduced post therapy, while the T1 increased in patients 2 and 3, and decreased in patient 4, at the 3 month follow-up timepoint. Table 1 gives the output coefficients from the linear fixed-effect model. This model shows that organs with clinically detected organ involvement had a significant decrease in stiffness at the 3 month imaging timepoint as measured by MRE. A simpler comparison between the changes in absolute stiffness between organs that had organ involvement with those that did not, are plotted in Figure 4. Organs with amyloid involvement all significantly decreased in stiffness (p = 0.047).Discussion and Conclusions:
This study demonstrates that organs with known amyloid involvement under effective plasma cell directed therapy like ASCT become less stiff as measured by MRE. Furthermore, these results indicate that ASCT affects the biomechanics of multiple organs (kidney, liver, heart, and spleen) and that MRE is a sensitive and feasible quantitative technique for monitoring these changes as early as 3 months post-therapy. In this cohort all organs with amyloid involvement eventually responded to therapy, although 1 (patient #2) responded after the 9-month clinical assessment. This suggests that MRE may be a sensitive tool for detecting early organ response. The 3 patients with cardiac amyloid involvement had reduced ejection fractions (<3.9%) at their 3-month follow-up despite having lower stiffness. Also, one patient with 14% decrease in endogenous T1 showed the least change in cardiac stiffness. Interactions between biomechanical changes and the MRI cardiac functional measurements are still not well understood and require future study. The results provide motivation for further evaluation of MRE-based biomarkers for assessing treatment response in AL amyloidosis patients.Acknowledgements
We would like to thank Kathy Brown for recruiting and scheduling all patient exams. This work was supported by the National Institutes of Health grants K12HD65987-11 and by internal grants funded by Mayo Clinic, Department of Radiology.References
1. Dispenzieri A, Gertz MA, Buadi F. What do I need to know about immunoglobulin light chain (AL) amyloidosis? Blood Reviews 2012;26(4):137-154.2. Sher T, Gertz MA. Recent advances in the diagnosis and management of cardiac amyloidosis. Future Cardiology 2014;10(1):131-146.
3. Fitzpatrick AW, Park ST, Zewail AH. Exceptional rigidity and biomechanics of amyloid revealed by 4D electron microscopy. Proceedings of the National Academy of Sciences of the United States of America 2013;110(27):10976-10981.
4. Kolipaka A, Aggarwal SR, McGee KP, Anavekar N, Manduca A, Ehman RL, Araoz PA. Magnetic resonance elastography as a method to estimate myocardial contractility. Journal of magnetic resonance imaging : JMRI 2012;36(1):120-127.
5. Kolipaka A, Mcgee KP, Araoz PA, Glaser KJ, Manduca A, Romano AJ, Ehman RL. MR Elastography as a Method for the Assessment of Myocardial Stiffness: Comparison with an Established Pressure-Volume Model in a Left Ventricular Model of the Heart. Magnet Reson Med 2009;62(1):135-140.
6. Elgeti T, Beling M, Hamm B, Braun J, Sack I. Cardiac magnetic resonance elastography: toward the diagnosis of abnormal myocardial relaxation. Investigative radiology 2010;45(12):782-787.
7. Elgeti T, Knebel F, Hattasch R, Hamm B, Braun J, Sack I. Shear-wave amplitudes measured with cardiac MR elastography for diagnosis of diastolic dysfunction. Radiology 2014;271(3):681-687.
8. Elgeti T, Laule M, Kaufels N, Schnorr J, Hamm B, Samani A, Braun J, Sack I. Cardiac MR elastography: comparison with left ventricular pressure measurement. Journal of cardiovascular magnetic resonance 2009;11:44.
9. Couade M, Pernot M, Messas E, Bel A, Ba M, Hagege A, Fink M, Tanter M. In vivo quantitative mapping of myocardial stiffening and transmural anisotropy during the cardiac cycle. IEEE transactions on medical imaging 2011;30(2):295-305.
10. Song P, Zhao H, Urban M, Manduca A, Pislaru S, Kinnick R, Pislaru C, Greenleaf J, Chen S. Improved Shear Wave Motion Detection Using Pulse-Inversion Harmonic Imaging with a Phased Array Transducer. IEEE transactions on medical imaging 2013;32(12):2299-2310.
11. Hollender PJ, Wolf PD, Goswami R, Trahey GE. Intracardiac echocardiography measurement of dynamic myocardial stiffness with shear wave velocimetry. Ultrasound in medicine & biology 2012;38(7):1271-1283.
12. Arani A, Arunachalam SP, Chang ICY, Baffour F, Rossman PJ, Glaser KJ, Trzasko JD, McGee KP, Manduca A, Grogan M, Dispenzieri A, Ehman RL, Araoz PA. Cardiac MR elastography for quantitative assessment of elevated myocardial stiffness in cardiac amyloidosis. Journal of magnetic resonance imaging : JMRI 2017;46(5):1361-1367.
13. Wassenaar PA, Eleswarpu CN, Schroeder SA, Mo X, Raterman BD, White RD, Kolipaka A. Measuring age-dependent myocardial stiffness across the cardiac cycle using MR elastography: A reproducibility study. Magnetic resonance in medicine : official journal of the Society of Magnetic Resonance in Medicine / Society of Magnetic Resonance in Medicine 2016;75(4):1586-1593.
14. Arani A, Magnuson J, Trzasko J, Sui Y, Glaser K, Manduca A, Ehman RL, Venkatesh S, Araoz P. Left Ventricular Myocardial Stiffness Decreases after Stem Cell Therapy in Amyloidosis Patients: Monitored with Cardiac MR Elastography. 2021; Virtual.
15. Arani A, Glaser KL, Arunachalam SP, Rossman PJ, Lake DS, Trzasko JD, Manduca A, McGee KP, Ehman RL, Araoz PA. In vivo, high-frequency three-dimensional cardiac MR elastography: Feasibility in normal volunteers. Magnetic resonance in medicine : official journal of the Society of Magnetic Resonance in Medicine / Society of Magnetic Resonance in Medicine 2016.
16. Gertz MA, Comenzo R, Falk RH, Fermand JP, Hazenberg BP, Hawkins PN, Merlini G, Moreau P, Ronco P, Sanchorawala V. Definition of organ involvement and treatment response in immunoglobulin light chain amyloidosis (AL): a consensus opinion from the 10th International Symposium on Amyloid and Amyloidosis. American journal of hematology 2005;79(4):319-328.
17. Palladini G, Dispenzieri A, Gertz MA, Kumar S, Wechalekar A, Hawkins PN, Schönland S, Hegenbart U, Comenzo R, Kastritis E, Dimopoulos MA, Jaccard A, Klersy C, Merlini G. New Criteria for Response to Treatment in Immunoglobulin Light Chain Amyloidosis Based on Free Light Chain Measurement and Cardiac Biomarkers: Impact on Survival Outcomes. Journal of Clinical Oncology 2012;30(36):4541-4549.
18. Palladini G, Hegenbart U, Milani P, Kimmich C, Foli A, Ho AD, Rosin MV, Albertini R, Moratti R, Merlini G. A staging system for renal outcome and early markers of renal response to chemotherapy in AL amyloidosis. Blood, The Journal of the American Society of Hematology 2014;124(15):2325-2332.
Figures
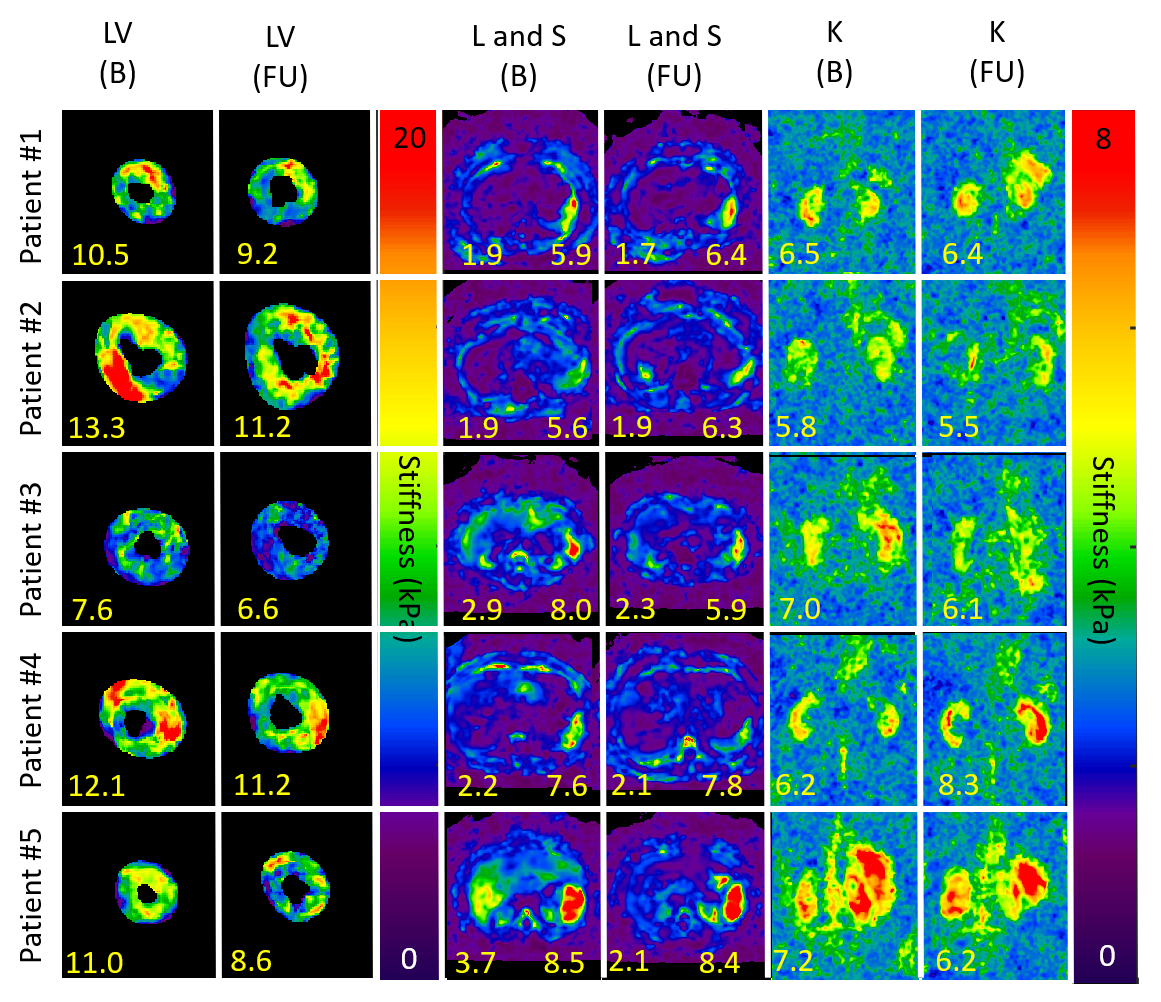
Figure 1: Center-slice elastogram images of the left
ventricle (LV) myocardium, the liver (L), spleen (S), and kidney (K) for all 5
patients at baseline (B) and at their 3 month follow-up (FU). The means stiffness (kPa) for each timepoint and
tissue is given in yellow numbers. Quantitative stiffness maps demonstrate a decrease
in LV myocardial and kidney stiffness in all patients. In patient #5, with
known liver involvement, their liver stiffness decreased significantly at FU.
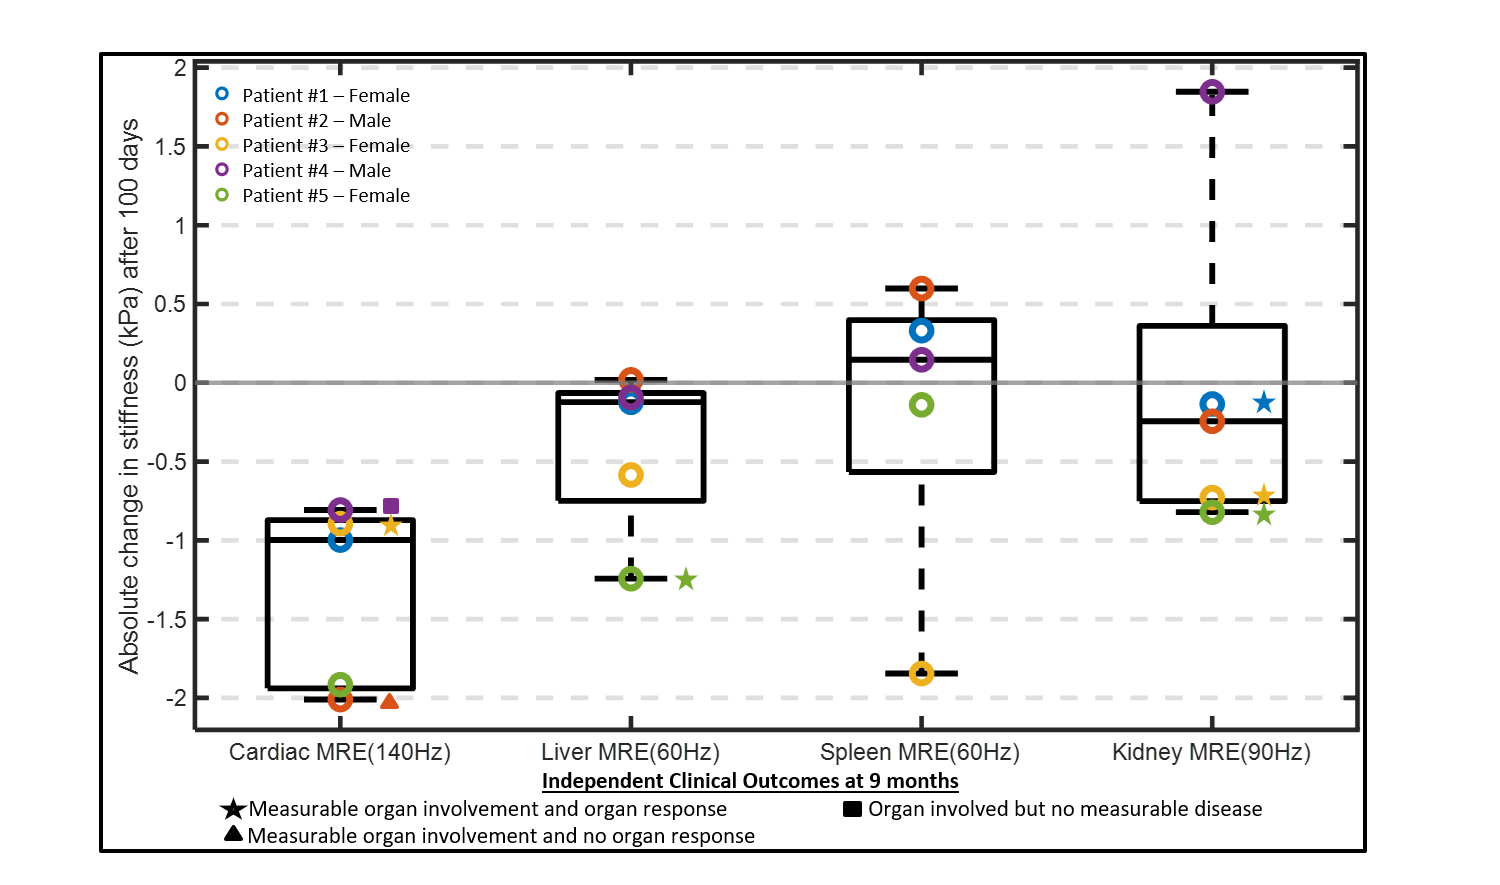
Figure 2: Absolute change (kPa) in mean organ stiffness (circles)
in 5 patients. The clinical assessment of measurable organ involvement at
baseline with an organ response “star”, and without an organ response “triangle”,
at 9 months is denoted next to each measurement. Organ involvement with no clinically
measurable disease is denoted as a “square”. All
unmarked data points mean that the organ was not clinically involved. Organ involvement
was not accessed in the spleen.
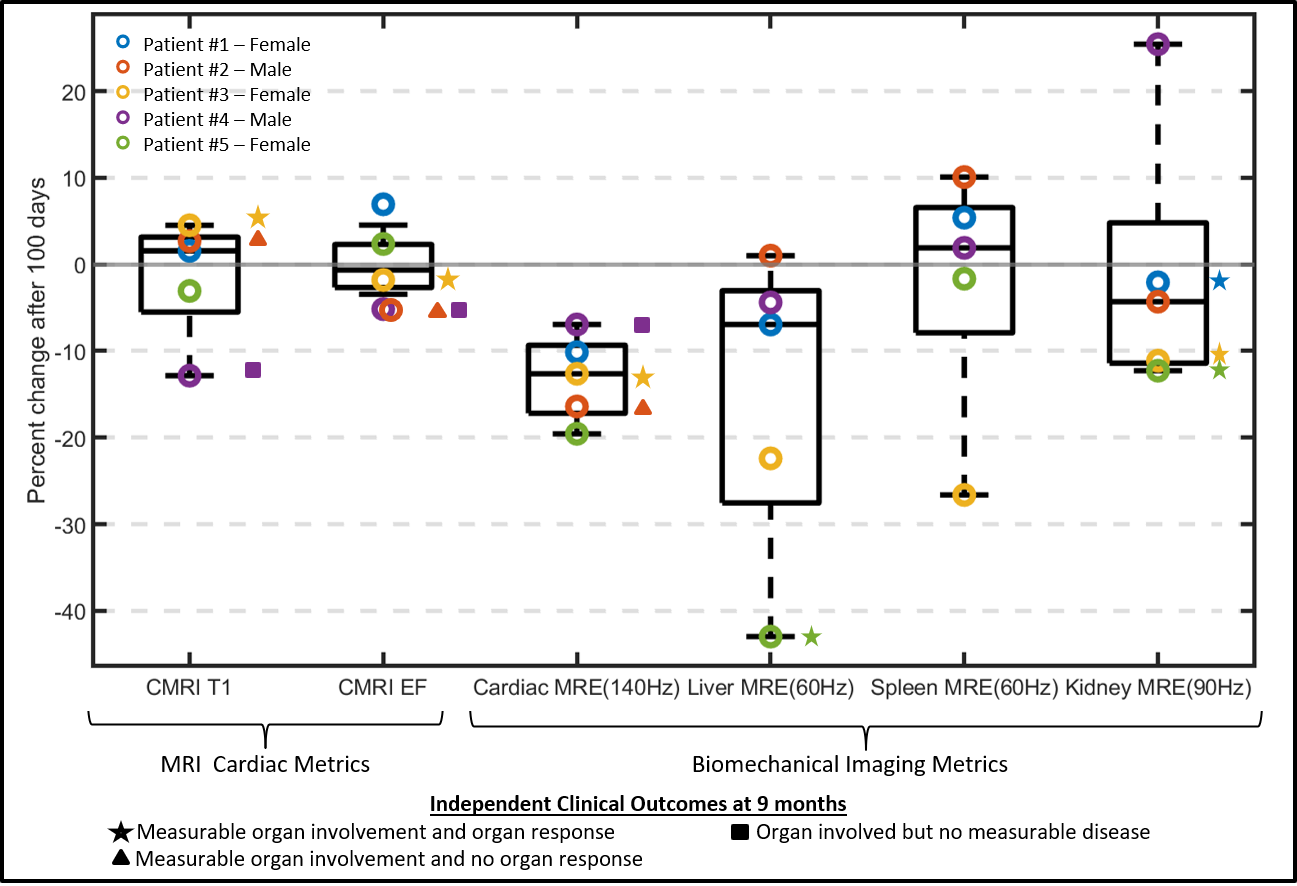
Figure 3: Percent change in endogenous T1-relaxation (CMRI
T1), cardiac ejection fraction (CMRI EF) and MRE metrics in cardiac, liver,
spleen, and kidneys of 5 patients pre- and post- ASCT therapy. In patients
numbers 2, 3, and 4, we can see that the EF reduced post therapy, while the T1
increased in patients 2 and 3, and decreased in patient 4 at 3 month follow-up.
All unmarked data points mean that the organ was not clinically involved. Organ
involvement in the spleen was not measured.
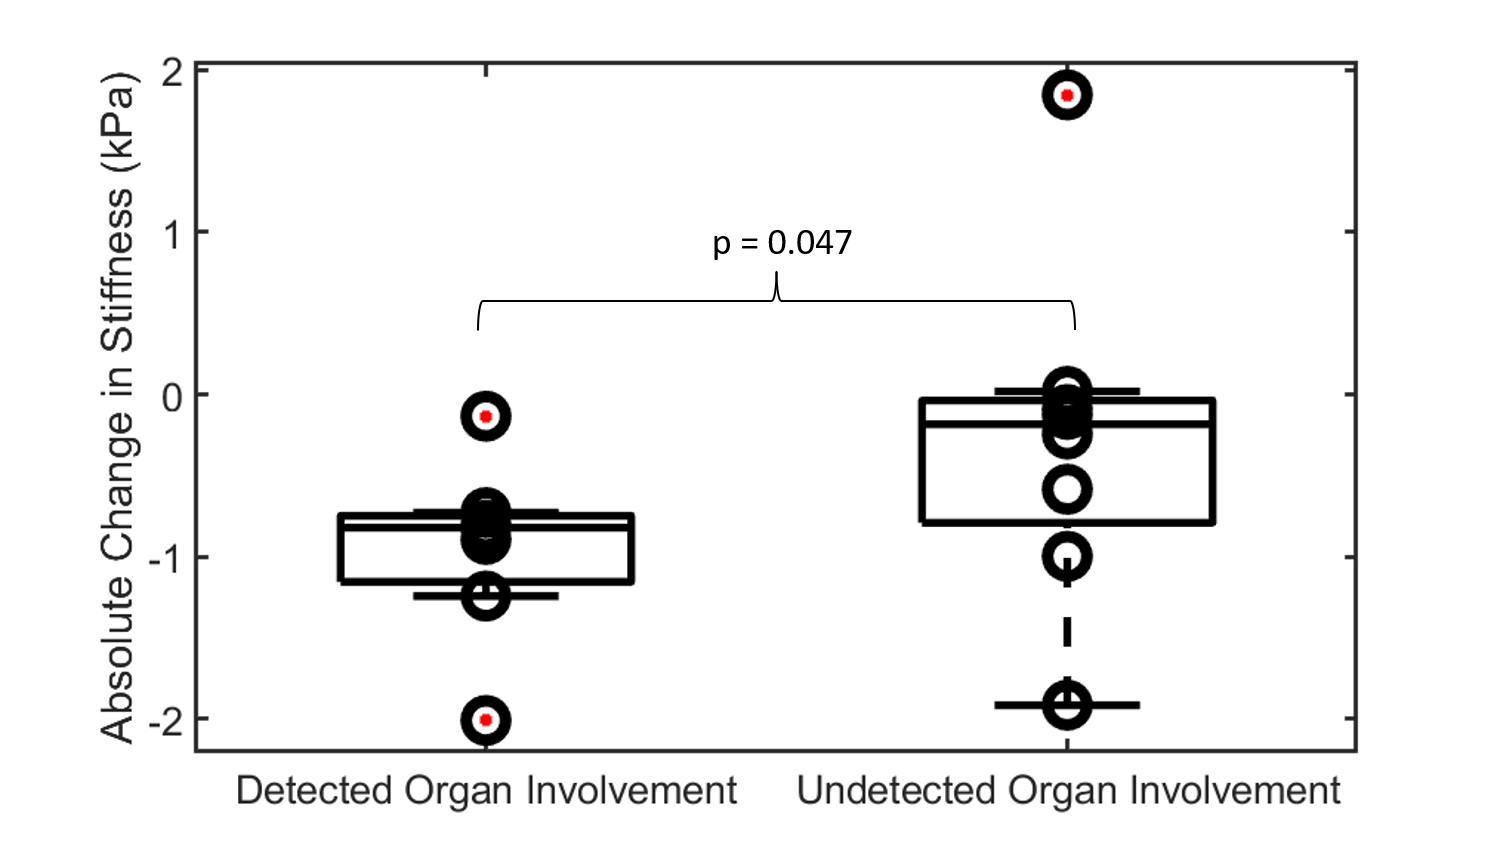
Figure 4: Absolute change in stiffness in liver, kidney and
cardiac tissue with known organ involvement compared to clinically undetected
organ involvement. Organs with clinically detected organ involvement showed a
significant decrease in stiffness (p = 0.047).

Table 1: Output coefficients from linear fixed effect
model. This model shows that organs with
clinically detected organ involvement had a significant decrease in stiffness
at the 3 month imaging timepoint as measured by MRE.
DOI: https://doi.org/10.58530/2022/4478