4476
Diagnostic Performance of PDFF and Multi-Frequency 3D-MRE in the Detection of NASH and NASH-Required Therapy in a Large Cohort of 380 Patients1Radiology, Mayo Clinic, Rochester, MN, United States, 2Surgical Pathology, Mayo Clinic, Rochester, MN, United States, 3Radiology, UC San Diego, La Jolla, CA, United States, 4Gastroenterology and Hepatology, Mayo Clinic, Rochester, MN, United States
Synopsis
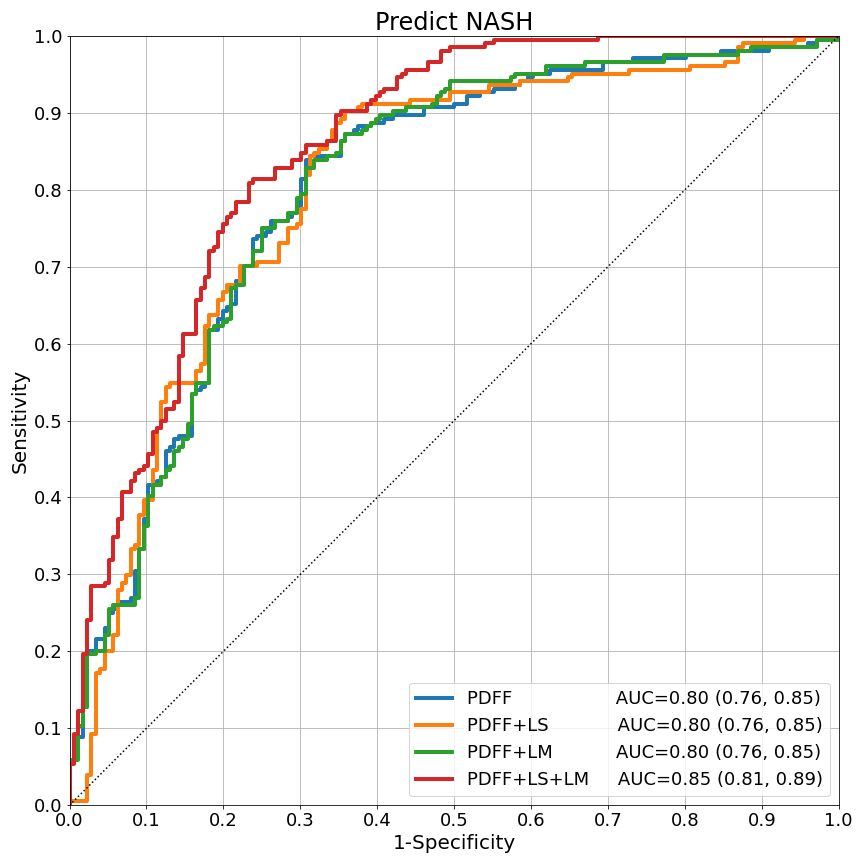
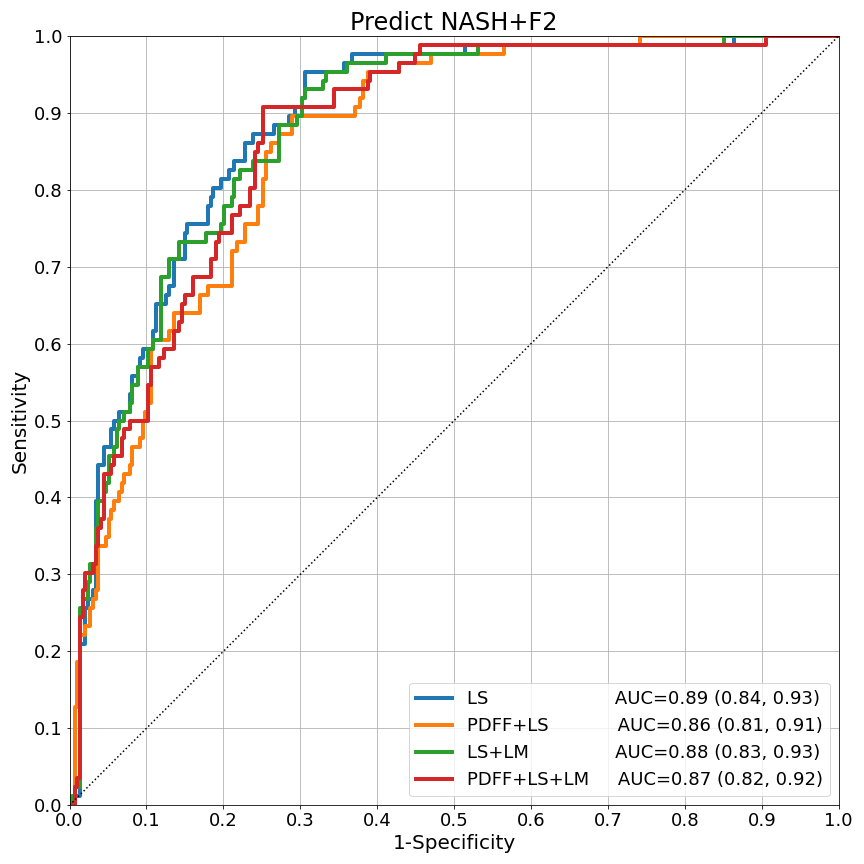
Liver biopsy and multi-parametric MRI/MRE were performed on 380 patients at risk of NASH. Histopathological diagnoses of NASH were collected along with proton density fat fraction (PDFF), and 3D-MRE measured liver stiffness (LS) and loss modulus (LM). While PDFF alone showed good ability to predict NASH (AUC: 0.80 [0.76, 0.85]), the addition of MRE measurements increased the diagnostic performance with strong statistical significance (AUC: 0.85 [0.81, 0.89], p<0.0004). LS alone was also found to be the strongest predictor of NASH-required treatment (AUC: 0.89 [0.84, 0.93], p<0.05), further establishing the critical role of MRE for clinical management of liver disease.
Introduction
Nonalcoholic fatty liver disease (NAFLD) is the most common form of chronic liver disease, affecting approximately 25% of the world population, and characterized by excessive fat build up and inflammation of liver tissue1. NAFLD patients are at risk of progressing to nonalcoholic steatohepatitis (NASH), which may lead to cirrhosis of the liver, hepatocellular carcinoma, or death2. It has been estimated that 20% of NAFLD patients make this progression3. Increasing severity of fibrosis in NASH patients increases the risk of severe outcomes and decreases the possibility of disease regression4-8. It is therefore critical to identify NASH patients early in their progression to effectively administer treatment. Liver biopsy and subsequent histological analysis is the current gold standard for diagnosing NASH. However the procedure is invasive, sensitive to sampling-error, and prone to subjective bias among readers8. Non-invasive biomarkers such as MRI-assessed proton density fat fraction (PDFF) and MRE-assessed liver stiffness (LS) and loss modulus (LM) arise in this context as alternatives for assessing hepatic steatosis and inflammation, respectively. In particular, 3D-MRE liver stiffness is accepted as the most accurate non-invasive biomarker for grading fibrosis9-11, and may be a predictor of NASH as well12. The purpose of our study was to test the diagnostic performance of PDFF, LS, and LM as predictors of NASH and NASH-required treatment.Methods
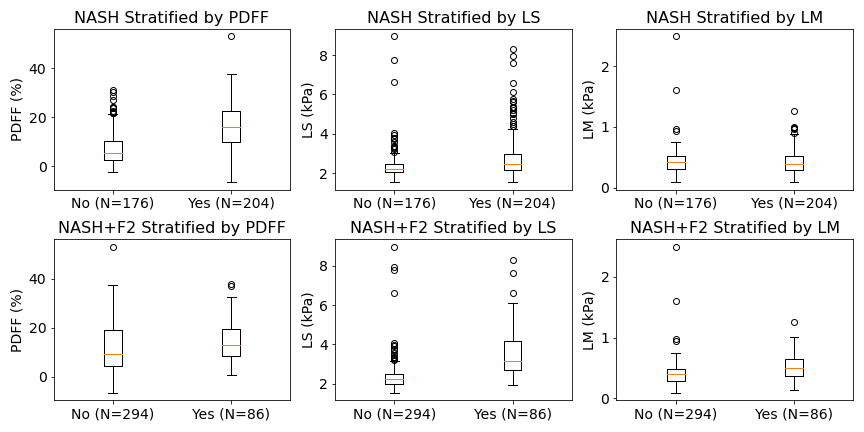
We analyzed data from 380 NAFLD patients who underwent percutaneous needle liver biopsy and MRI/MRE exams after having given written, informed consent. Readers performing histological analyses recorded steatosis grade (0-3), inflammation (0-3), ballooning (0-2), fibrosis stage (0-4), and ultimately a diagnosis of NASH (yes/no). Hepatic PDFF (%) was calculated from manually drawn ROIs in 9 segments. The complex shear stiffness of the liver G* - whose magnitude is called "liver stiffness" (LS, kPa) and whose imaginary part is called loss modulus (LM, kPa) - was assessed by 3D-MRE. LS was measured at the standard clinical driving frequency 60Hz. LM was measured at 40Hz in light of previous work showing that its value at low frequencies (30-40Hz) is more sensitive to NASH detection12. Thus PDFF, LS, and LM were taken as predictors in models of NASH and NASH-required treatment (NASH and fibrosis grade 2 or higher, denoted here NASH+F2). Pearson and Spearman correlations among the predictors and outcomes were analyzed. With NASH and NASH+F2 as outcomes, logistic regression models for every combination of predictors were trained with ridge regularization and leave-one-out cross-validation. Model performance was defined by the AUC and compared with a DeLong test. Final re-training of each model was performed on the whole dataset to estimate the standardized predictor odds ratios to compare predictor importance. α=0.05 was used for all confidence intervals and the threshold of statistical significance.Results
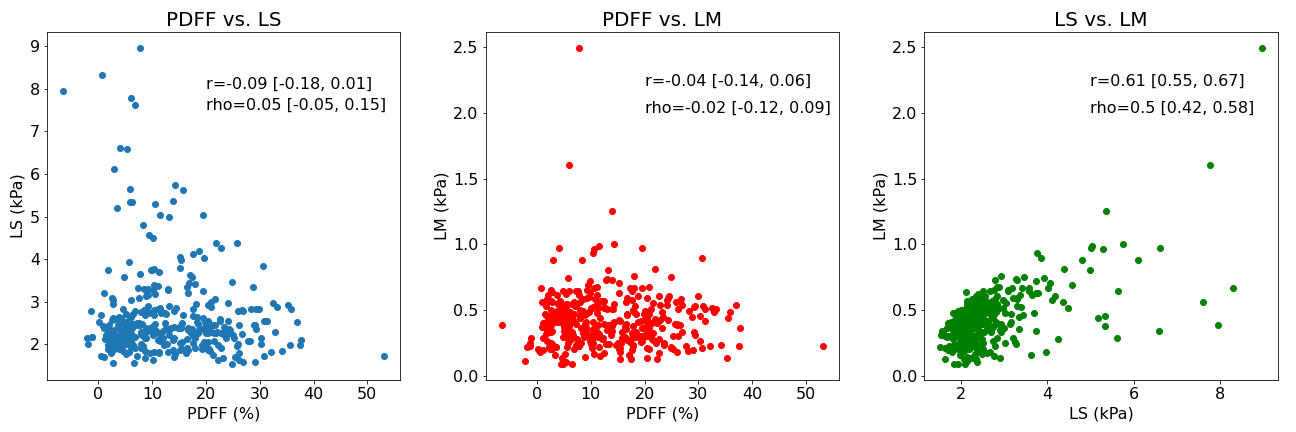
Test results show that PDFF alone already has good performance in predicting NASH (AUC=0.80 [0.76, 0.85]). Models combining PDFF+LS and PDFF+LM had similar performance (both AUC=0.80 [0.76, 0.85]). The full model with all predictors PDFF+LS+LM showed increased performance (AUC=0.85 [0.81, 0.89]). The DeLong test comparing AUCs among models confirmed that the increase in performance of PDFF+LS+LM over PDFF, PDFF+LS, or PDFF+LM had strong statistical significance (p<0.0004). In the full model, the standardized odds ratios (PDFF=4.2, LS=3.8, LM=0.4) confirm PDFF as the most important NASH predictor followed by LS and LM. This hierarchy was echoed by the ordering of Pearson (PDFF=0.48, LS=0.21, LM=-0.04) and Spearman (PDFF=0.53, LS=0.25, LM=-0.04) correlations with respect to NASH. PDFF also correlated weakly with MRE variables (Pearson LS=-0.09, LM=-0.04; Spearman LS=0.05, LM=-0.02), suggesting MRE measurements bring new predictive information to bear. LS alone dominated as the key predictor of NASH+F2, correlating with this outcome strongly (Pearson=0.47, Spearman=0.54). Its diagnostic performance was strong (AUC=0.89 [0.84, 0.93]), and better than the next best model LS+LM (AUC=0.88 [0.83, 0.93]) with statistical significance (p=0.04).Discussion
Models for NASH and NASH+F2 prediction were trained using three liver imaging biomarkers and tested with a rigorous cross-validation regime. Results confirm that PDFF is a critical measurement in the diagnosis of NASH, consistent for a disease characterized by steatosis build-up. They also demonstrate that MRE improves the diagnostic performance significantly, suggesting that the hepatocellular injury and inflammatory properties of NASH are not sufficiently captured by PDFF alone. Indeed it is precisely these properties that MRE has excelled in characterizing. The fact that performance was enhanced only when both LS and LM were included suggests that the full information contained in the complex shear stiffness G* is required, whereas a single component alone is not impactful. The dominant role of LS in the prediction of NASH+F2 is also not surprising due to the ability of LS to strongly identify fibrosis stage and its moderate association with NASH itself. The inclusion of PDFF or LM, which are also moderately correlated with NASH+F2, appears to have introduced more noise than signal in this prediction.Conclusion
This study showed the enhanced detection of NASH made possible by the addition of MRE measurements of liver tissue to PDFF. LS was also demonstrated to be the most critical component in the identification of NASH patients with clinically significant fibrosis.Acknowledgements
This study is funded by NIH grants EB017197 (M.Y.), EB001981(R.L.E.), DK115594 (A.M.A.), DK059615 (V.S.), and DoD grant W81XWH-19-1-0583-01 (M.Y.).References
1. Younossi Z, Koenig A, Abdelatif D, Fazel Y, Henry L, Wymer M. Global epidemiology of nonalcoholic fatty liver disease-meta-analytic assessment of revalence, incidence, and outcomes. Hepatology 2016;64:73-84.
2. Ekstedt M, Nasr P, Kechagias S. Natural history of NAFLD/NASH. Curr Hepatol Rep 2017;16(4):391-397s.
3. Bertot L, Adams L. The natural course of non-alcoholic fatty liver disease. Int J Mol Sci 2016;17(5):774.
4. Bataller R, Brenner DA. Liver fibrosis. J Clin Invest 2005;115(2):209-218.
5. Tsukada S, Parsons CJ, Rippe RA. Mechanisms of liver fibrosis. Clin Chim Acta 2006;364(1–2):33-60.
6. Friedman SL. Liver fibrosis -- from bench to bedside. J Hepatol 2003;38(Suppl 1):S38-S53.
7. Poynard T, McHutchison J, Manns M, et al. Impact of pegylated interferon alfa-2b and ribavirin on liver fibrosis in patients with chronic hepatitis C. Gastroenterology 2002;122(5):1303-1313.
8. Dixon JB, Bhathal PS, Hughes NR, O’Brien PE. Nonalcoholic fatty liver disease: Improvement in liver histological analysis with weight loss. Hepatology 2004;39(6):1647-1654.
9. Singh S, Venkatesh S, Loomba R, et al. Magnetic resonance elastography for staging liver fibrosis in non-alcoholic fatty liver disease: A diagnostic accuracy systematic review and individual participant data pooled analysis. Eur Radiol 2016;26(5):31-40.
10. Dulai P, Sirlin C, Loomba RMRI. MRE for non-invasive quantitative assessment of hepatic steatosis and fibrosis in NAFLD and NASH:Clinical trials to clinical practice. J Hepatol 2016;65(1006–16):1006-1016.
11. Liang Y, Li D. Magnetic resonance elastography in staging liver fibrosis in non-alcoholic fatty liver disease: A pooled analysis of the diagnostic accuracy. BMC Gastroenterol 2020;20:89.
12. Allen A, Shah V, Therneau T, et al. The role of three-dimensional magnetic resonance Elastography in the diagnosis of nonalcoholic steatohepatitis in obese patients undergoing bariatric surgery. Hepatology 2019;71(2).510–21.
13. Loomba R, Cui J, Wolfson T, et al. Novel 3D Magnetic Resonance Elastography for the Noninvasive Diagnosis of Advanced Fibrosis in NAFLD: A Prospective Study. Am J Gastroenterol. 2016 Jul;111(7):986-94. doi: 10.1038/ajg.2016.65. Epub 2016 Mar 22. PMID: 27002798; PMCID: PMC5001170.
14. Chen J, Yin M, Talwalkar JA, et al. Diagnostic Performance of MR Elastography and Vibration-controlled Transient Elastography in the Detection of Hepatic Fibrosis in Patients with Severe to Morbid Obesity. Radiology. 2017 May;283(2):418-428. doi: 10.1148/radiol.2016160685. Epub 2016 Nov 18. PMID: 27861111; PMCID: PMC5395333.
15. Dzyubak B, Li J, Chen J, et al. Automated analysis of multiparametric magnetic resonance imaging/magnetic resonance elastography exams for prediction of nonalcoholic steatohepatitis. J Magn Reson Imaging 2021;jmri.27549. Epub ahead of print. https://doi.org/10.1002/jmri. 27549.
Figures