4468
Pericarotid fat density was associated with carotid plaque vulnerability, especially IPH and TRFC1the Affiliated Hospital of Xuzhou Medical University, Xuzhou, China, 2GE Healthcare,Precision health institution,China., Shanghai, China
Synopsis
Inflammation play important roles in the vulnerability of atherosclerotic plaque. Pericoronary fat is associated with coronary heart disease and high-risk plaque, however the value of pericarotid fat density (PFD) remains uncertain. We evaluated the association between PFD on computed tomography angiography (CTA), with the vulnerable composition of carotid plaques. We found that the PFD was independently associated with vulnerability of carotid plaque especially for IPH and TRFC, suggesting that pericarotid fat tissue may play a key role in the occurrence of vulnerable plaques. The identification of local perivascular inflammation may help identify patients who may benefit from targeted therapy.
Acknowledgements
No acknowledgement found.References
References
[1] Ross R. Atherosclerosis--an inflammatory disease. N Engl J Med. 1999. 340(2): 115-26.
[2] Skiba DS, Nosalski R, Mikolajczyk TP, et al. Anti-atherosclerotic effect of the angiotensin 1-7 mimetic AVE0991 is mediated by inhibition of perivascular and plaque inflammation in early atherosclerosis. Br J Pharmacol. 2017. 174(22): 4055-4069.
[3] Xiong W, Zhao X, Villacorta L, et al. Brown Adipocyte-Specific PPARγ (Peroxisome Proliferator-Activated Receptor γ) Deletion Impairs Perivascular Adipose Tissue Development and Enhances Atherosclerosis in Mice. Arterioscler Thromb Vasc Biol. 2018. 38(8): 1738-1747.
[4] Margaritis M, Antonopoulos AS, Digby J, et al. Interactions between vascular wall and perivascular adipose tissue reveal novel roles for adiponectin in the regulation of endothelial nitric oxide synthase function in human vessels. Circulation. 2013. 127(22): 2209-21.
[5] Henrichot E, Juge-Aubry CE, Pernin A, et al. Production of chemokines by perivascular adipose tissue: a role in the pathogenesis of atherosclerosis. Arterioscler Thromb Vasc Biol. 2005. 25(12): 2594-9.
[6] Konishi M, Sugiyama S, Sato Y, et al. Pericardial fat inflammation correlates with coronary artery disease. Atherosclerosis. 2010. 213(2): 649-55.
[7] Lu MT, Park J, Ghemigian K, et al. Epicardial and paracardial adipose tissue volume and attenuation - Association with high-risk coronary plaque on computed tomographic angiography in the ROMICAT II trial. Atherosclerosis. 2016. 251: 47-54.
[8] Oikonomou EK, Williams MC, Kotanidis CP, et al. A novel machine learning-derived radiotranscriptomic signature of perivascular fat improves cardiac risk prediction using coronary CT angiography. Eur Heart J. 2019. 40(43): 3529-3543.
Figures
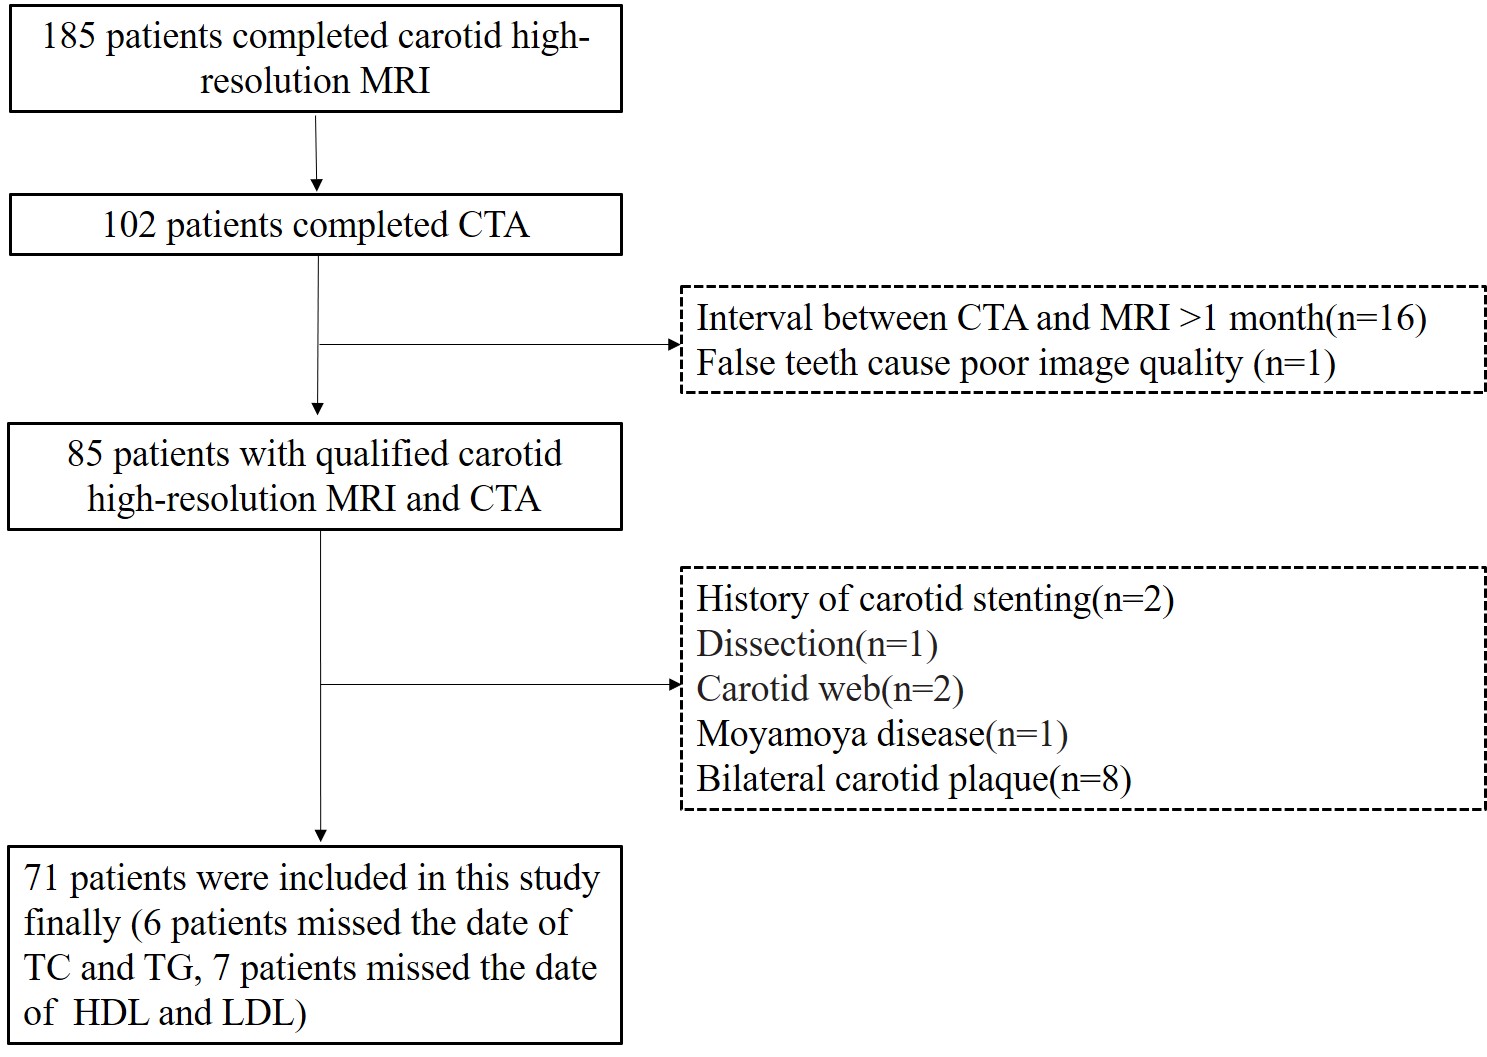
Figure 1. Flow chart of this study. TC, total cholesterol; TG, triglycerides; HDL: high density lipoprotein; LDL: low density lipoprotein.
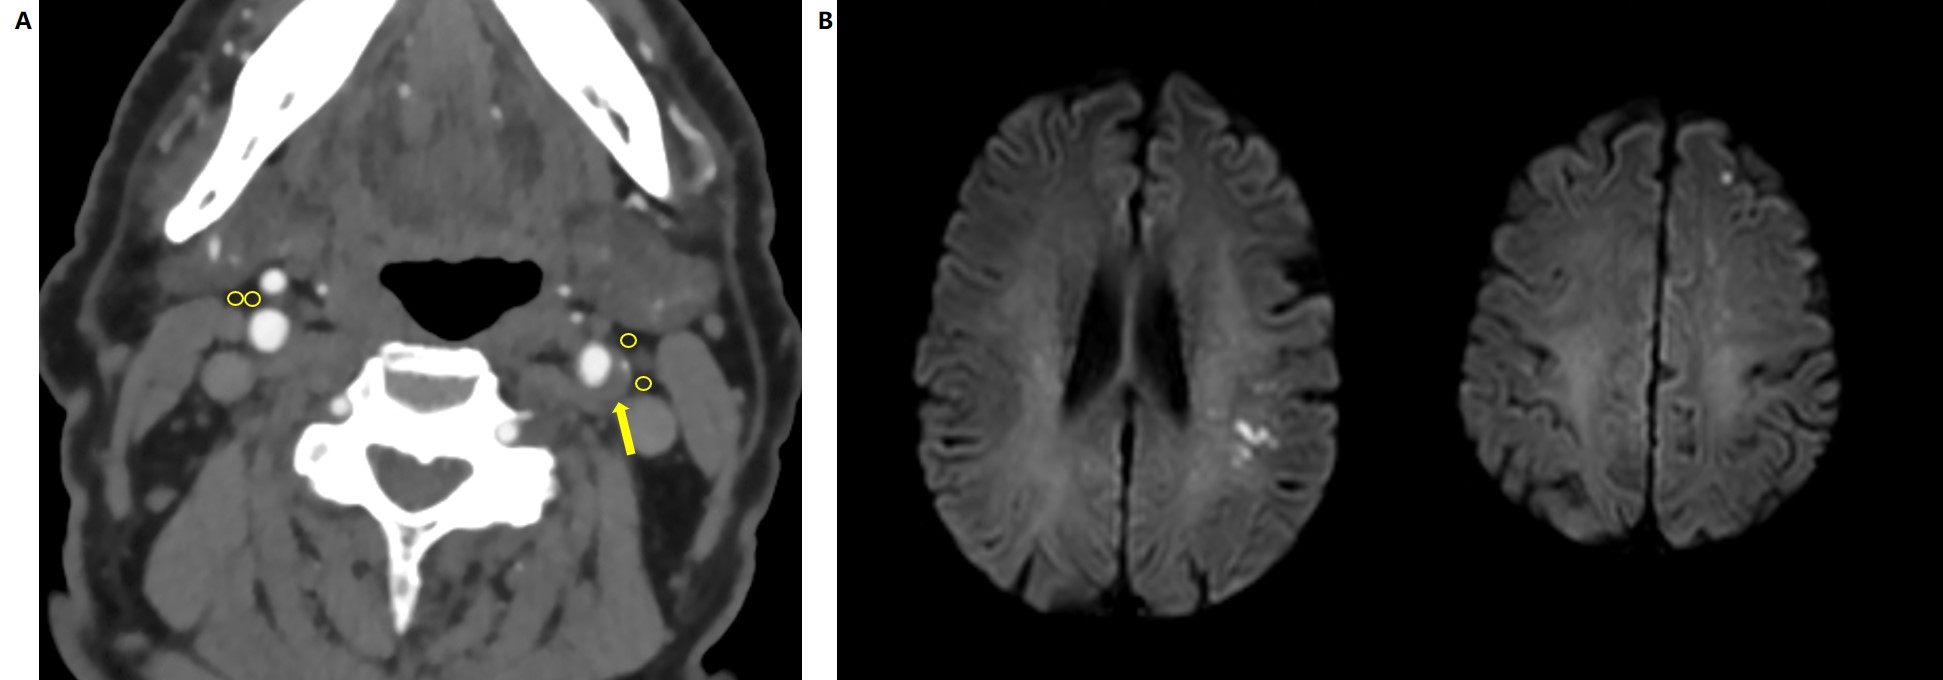
Figure 2. A 77-year-old man was detected left frontotemporal lobe acute infarction on MRI (B). CTA imagings (A) showed carotid plaque in the left internal carotid artery (ICA). Two ROIs were placed in the perivascular fat of the maximal plaque of left ICA on the axial slice (yellow arrow). Then, same two ROIs were placed in the perivascular fat of contralateral non-stenotic ICA. In this case, the two ROIs of left stenotic ICA and right non-stenotic were -23 HU, -30 HU and -85.0 HU, -87.0 HU, respectively.
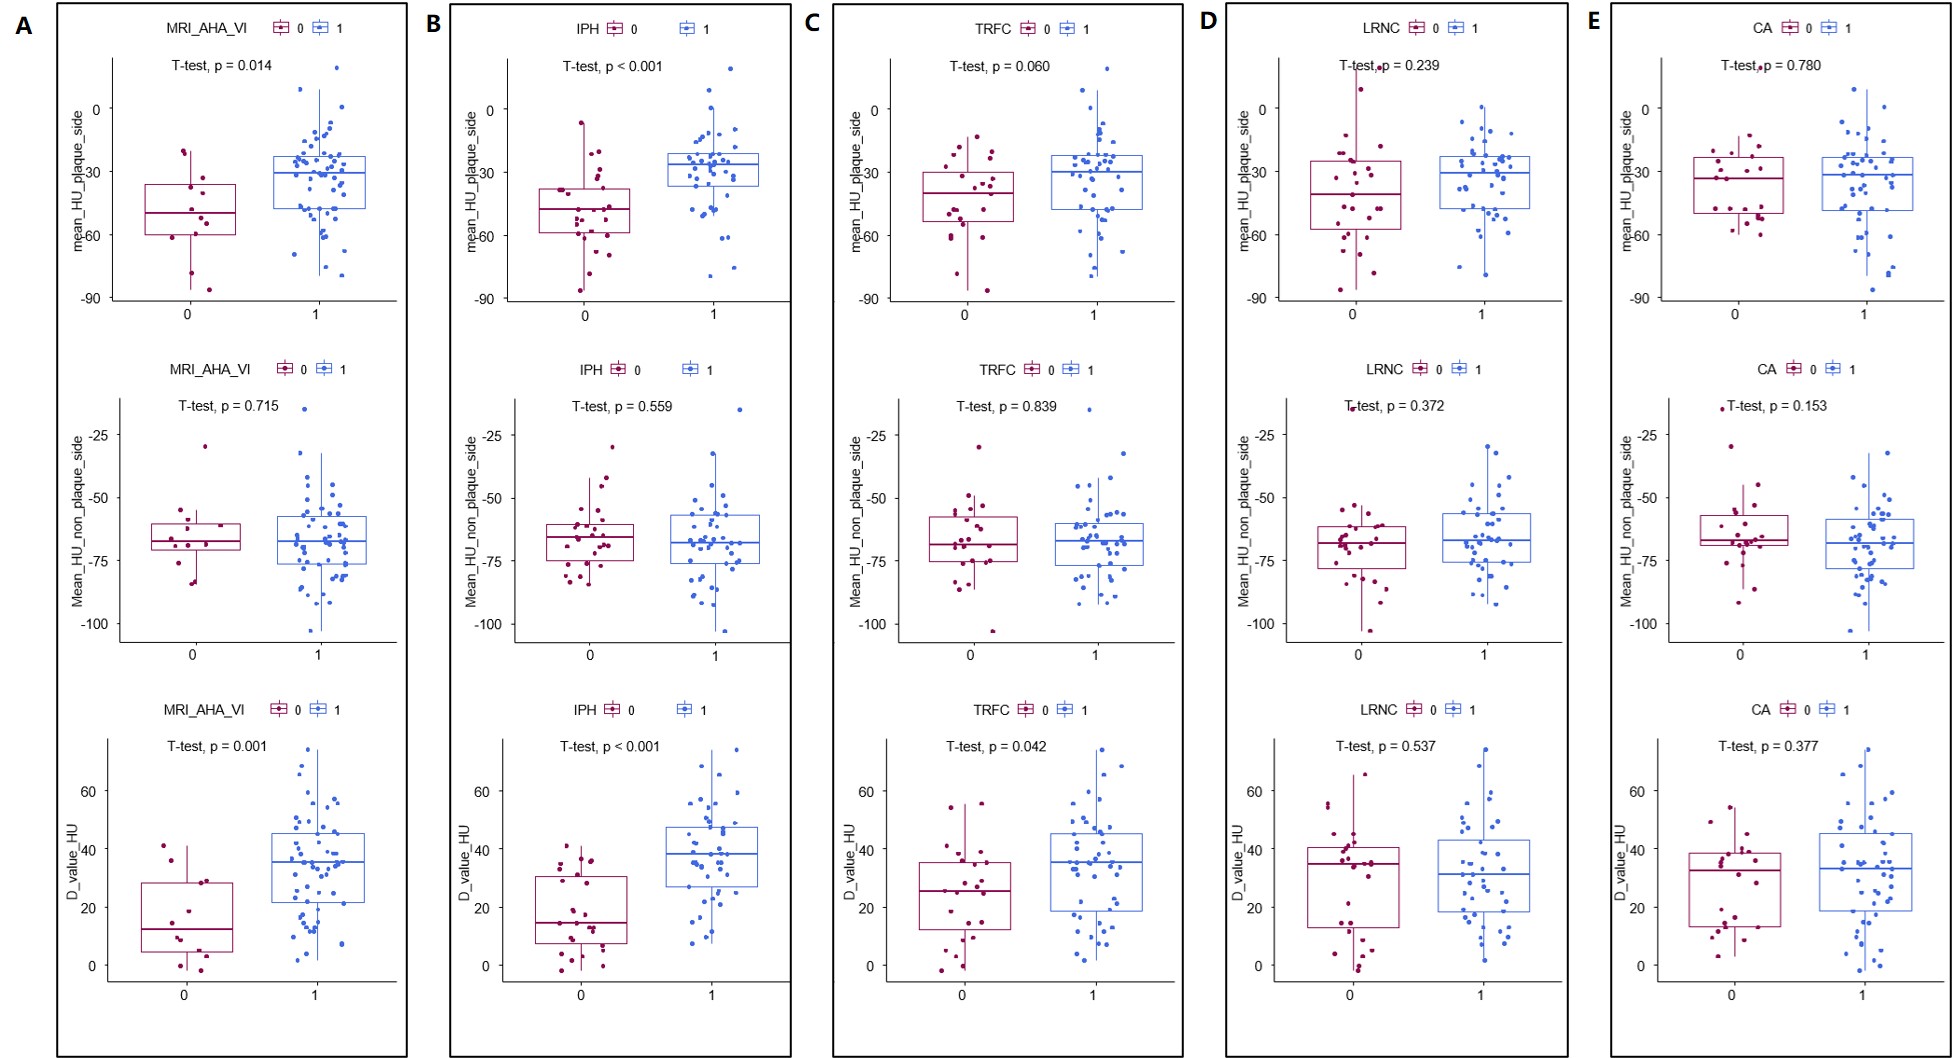
Figure 3. Scatter plots of pericarotid fat density in 5 subgroups. (A) AHA type (non-AHA VI VS AHA VI); (B) intraplaque hemorrhage (IPH VS non-IPH); (C) thinning and/or rupture of the fibrous cap (non-TRFC VS TRFC); (D) lipid-rich necrotic core (non-LRNC VS LRNC); (E) calcification (non-CA VS CA).
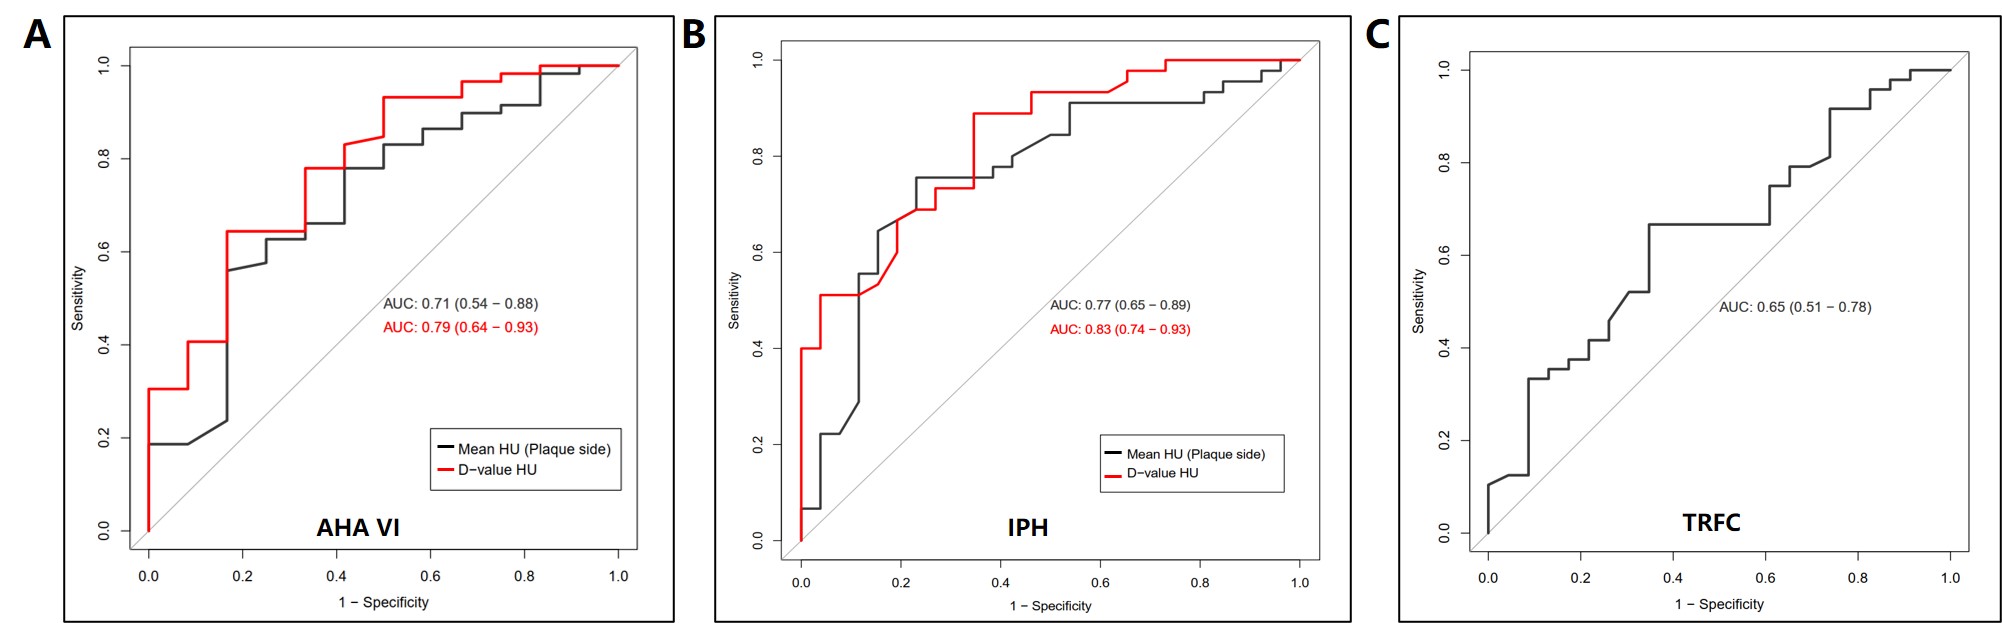
Figure 4 The ROC curve of Pericarotid Fat Density (Measured in HU) for prediction AHV VI (A), IPH (B), and TRFC (C). AHA VI: American Heart Association VI plaque; IPH: intraplaque hemorrhage, TRFC: thinning and/or rupture of the fibrous cap.