4466
Quantitative assessment of intracranial venous sinus thrombosis using MR 3D T1 SPACE imaging1Radiology, The Second Hospital of Dalian Medical University, Dalian, China, 2Radiology, Affiliated Zhongshan Hospital of Dalian University, Dalian, China, 3MR Scientific Marketing, Siemens Healthineers, Beijing, China
Synopsis
This study explores the feasibility of MR 3D T1 SPACE sequence in diagnose and differential diagnosis of Cerebral sinus venous thrombosis (CSVT) . The clinical phase of CVST in accordance with onset of symptom often lags behind image characters. Results showed that no obvious scientific difference was found among clinical phase groups. However, the differences between the acute, subacute and chronic imaging groups were statistically significant. Besides, CE rate of CVST in superficial veins was found higher than that in deep veins. MR 3D T1 SPACE has the potential to improve the accuracy of early diagnosis of CVST.
Introduction
Cerebral sinus venous thrombosis (CSVT) is a relatively rare disease with a particularly high incidence in young adults [1, 2] .Recent research have found that there is an increasing incidence rate among children and females of childbearing age group, and low-income countries[2, 3]. Although the incidence of CVT patients with focal defects or coma shows a downward trend and the mortality rate decreases over time, its clinical concealed and non-specific characteristics may lead to potentially fatal neurological diseases [3]. So far, neuroimaging is the gold standard for diagnosing CSVT [5]. MRI and magnetic resonance venogram (MRV) are currently considered to be the first choice for the diagnosis of CSVT, and the appearance of thrombus on different MRI sequences is time dependent[4, 5]. However, MR diagnosis is not without difficulty, because smaller thrombus, deep cerebral veins or adjacent cortical veins images are unclear, and it is easy to miss the signal and cause false positive. Recently, isotropic 3D imaging with high SNR and different flip-angle evolutions (SPACE) with low SAR have been developed, and it supports reconstruction at any direction, which is conducive to the display of lesions in small anatomical structures areas. The purpose of this study is to retrospectively analyze the 3D T1 SPACE imaging characteristics of CVST in different clinical or imaging stages and different positions.Methods
30 patients (12 women and 9 men, 36.8 ±14 years old) were enrolled in this study. All participants have written informed consent before each examination. All MRI images were acquired on MAGNETOM Verio 3T MR Scanner (Siemens Healthineers, Erlangen, Germany) through a 32-element head coil array. Pre-contrast and post-contrast 3D T1 SPACE sequence was applied, and the parameters are as follows: TR =600ms; TE =8.8ms; flip angle=120°; slice thickness =0.6-0.8mm; matrix size=256×320; and FOV= 210×210mm2, and contrast agent was used (gadobutrol Gadovist 1.0; Schering, Basel, Switzerland 0.1mmol/kg). Cerebral venous sinus was divided into 12 vein sections. Signal intensity of the normalized signal intensity on pre-contrast T1 3D SPACE images (SpreCE) and that on post-contrast T1 3D-SPACE images (SpostCE) were measured in CSVT, gray matter (GM) and pituitary infundibulum (PI). Enhancement rate of CSVT was quantified using the following equation: CE rate= (SpostCE-SpreCE)/SpreCE*100% (CE:contrast enhancement). The CE rate of CSVT was divided by that of grey matter (CE related to GM) and pituitary infundibulum (CE related to PI), respectively [6]. The CSVT of 12 vein slices were divided into acute, subacute, and chronic groups. The vessels were divided into 2 groups by their location in superficial and deep venous system. The differences of SpreCE, SpostCE, CE rate, CE related to GM, and CE related to PI in acute, subacute, and chronic clinical/imaging phase groups were compared by using Kruskal-Wallis H test, and Bonferroni test was further performed for pairwise comparisons between subgroups. SpreCE, SpostCE, CE rate, CE related to GM, and CE related to PI between superficial and deep venous systems were compared by two independent samples rank sum test. P<0.05 was considered statistically significant.Results
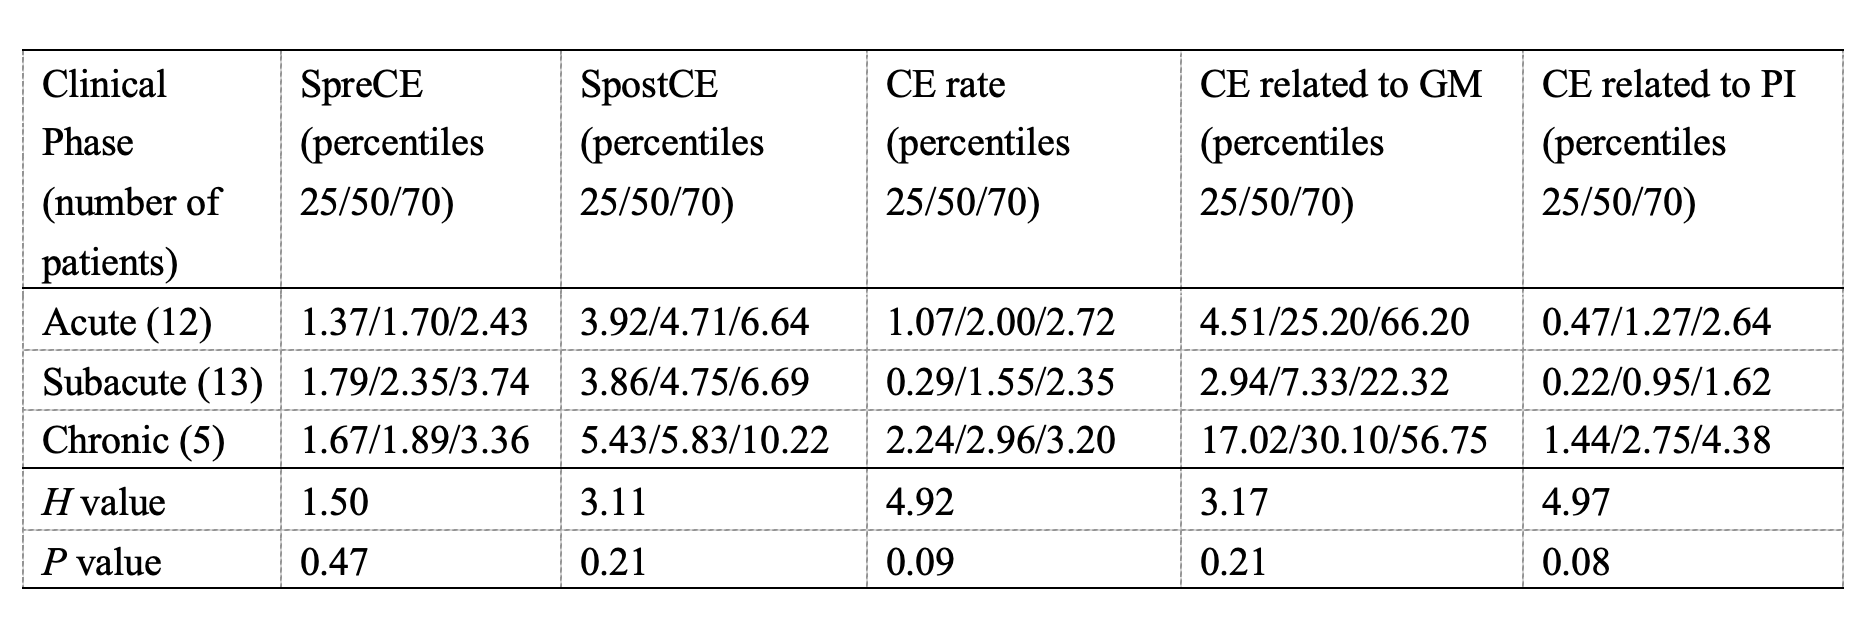
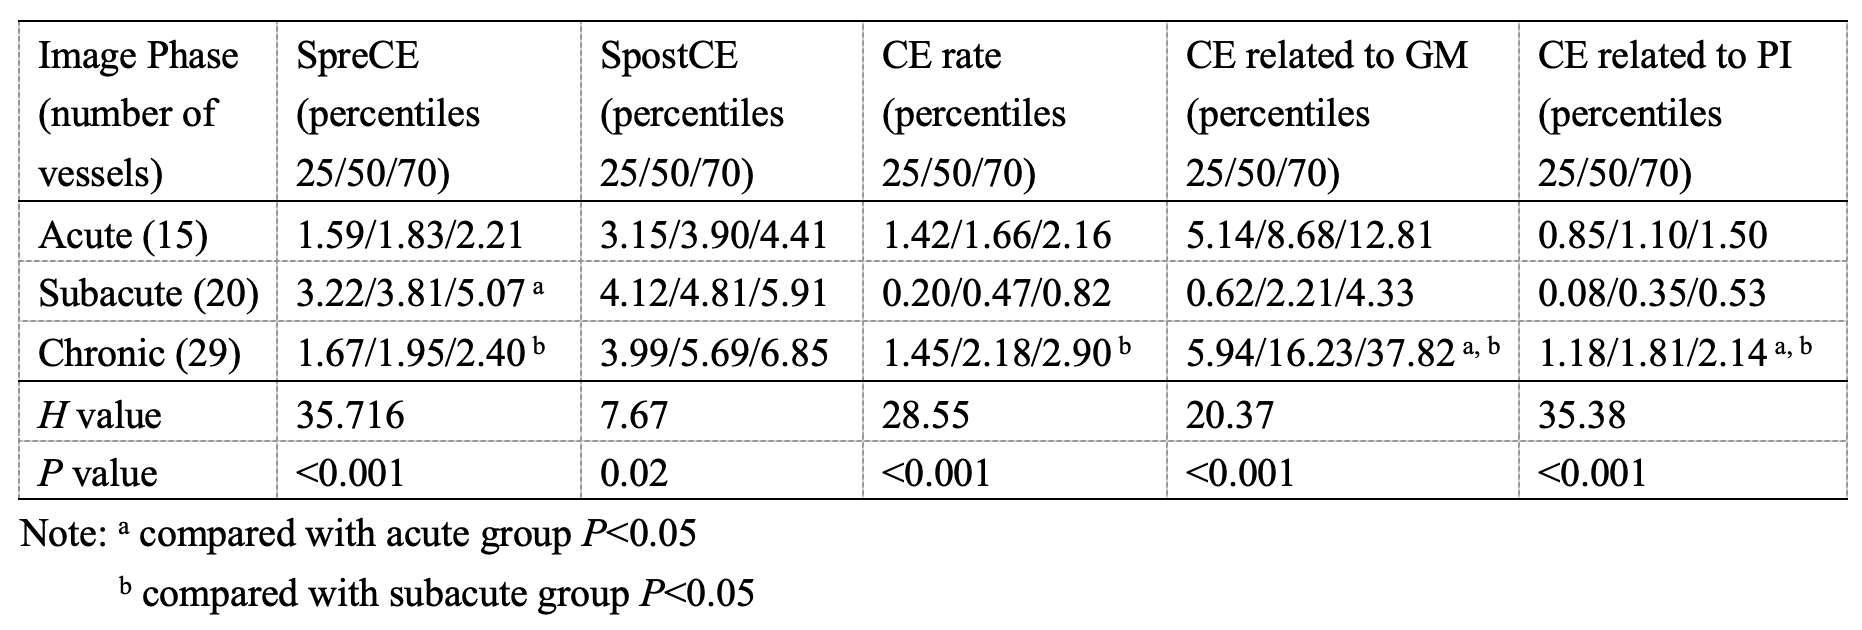
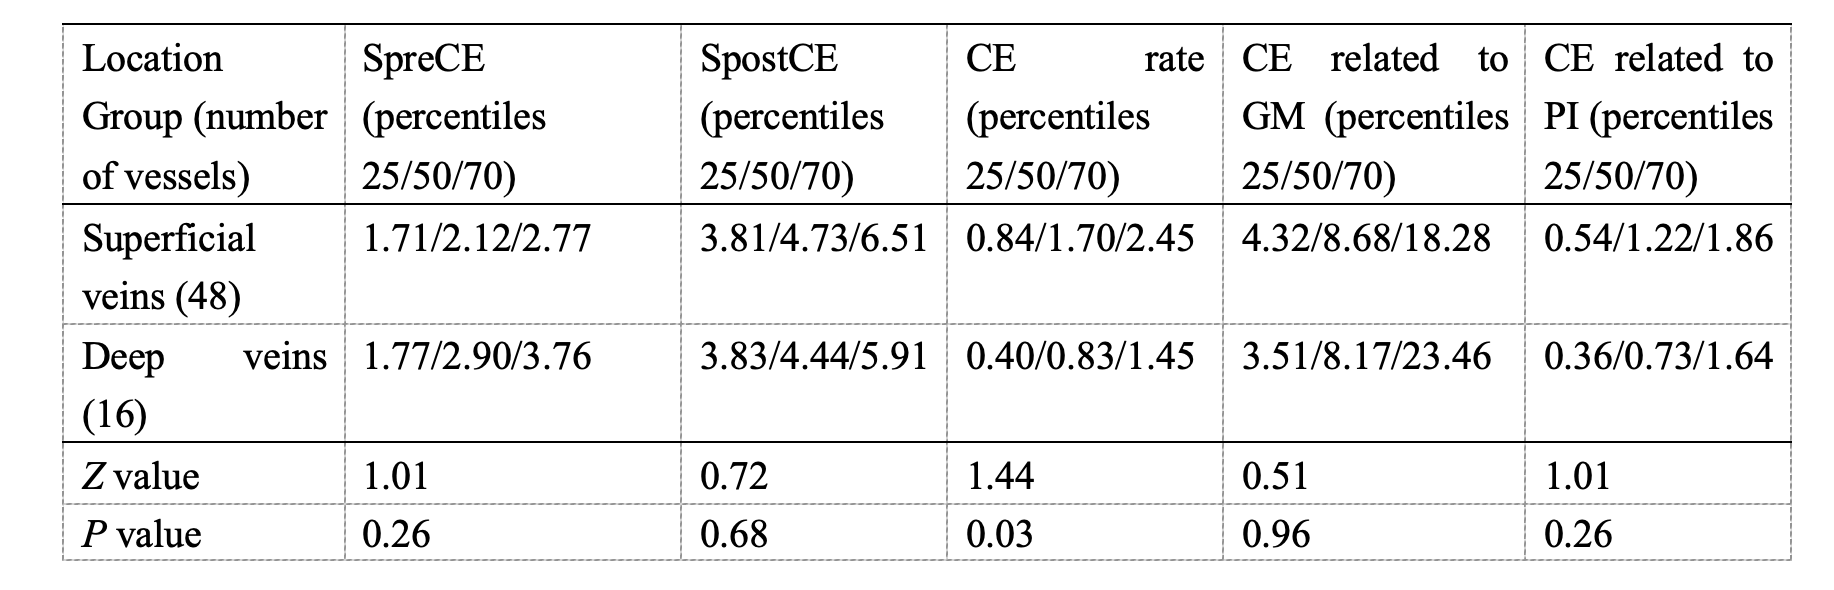
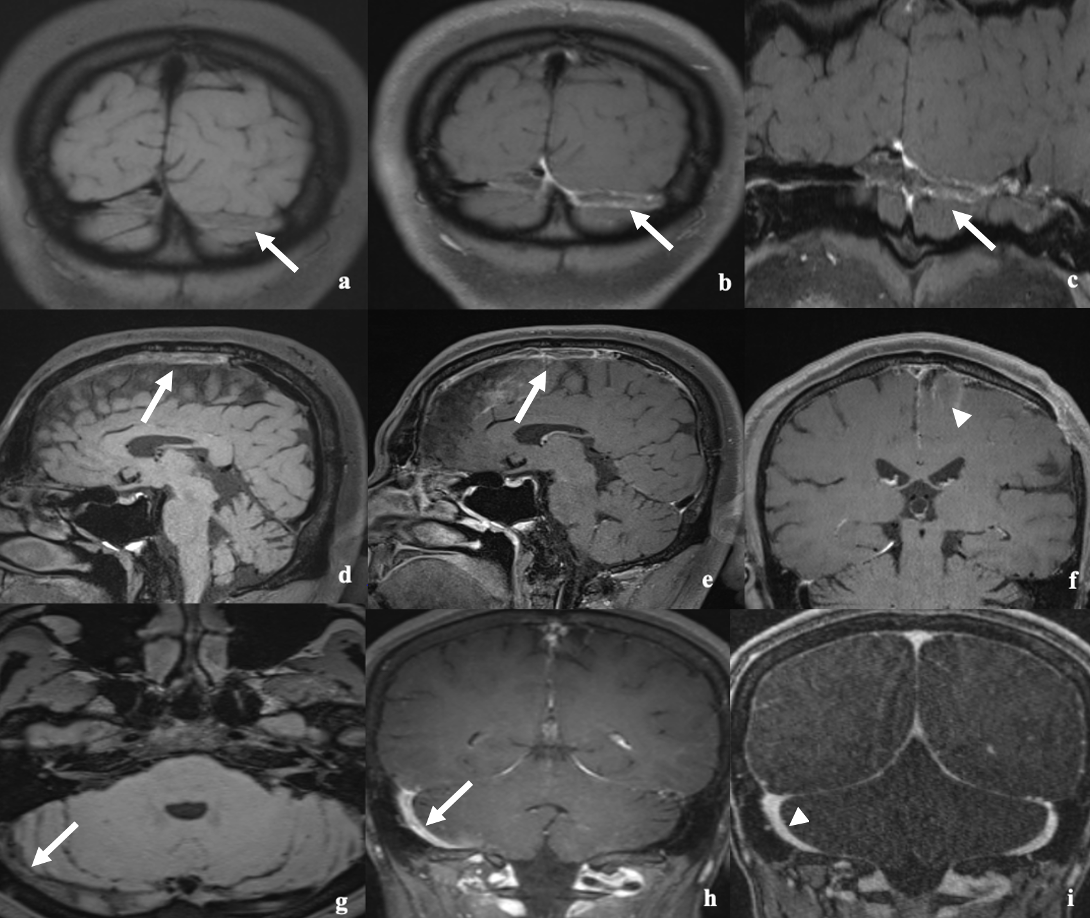
The clinical symptoms appear within 2 hours to 60 years in these patients. 64 CSVT segments were identified in 30 patients. According to clinical symptoms, patients were divided into acute phase (n=12), subacute phase(n=13), and chronic phase(n=5). No significantly statistical difference among these groups was found on SpreCE, SpostCE, CE rate, CE related to GM, or CE related to PI, as shown in Table 1. Based on the preset image characteristics of the CSVT,CSVT segments were defined as acute (n=15), subacute (n=20), and chronic phase (n=29) (see Table 2, Figure 1). SpreCE, SpostCE, CE rate, GM-related CE, and PI-related CE were statistically different in different image phases(P<0.01). SpreCE was higher in the subacute phase than that in the acute or chronic phase (P<0.001). The CE rate in the chronic phase was significantly higher than that in subacute phase (P<0.001). The CE related to GM and CE related to PI in the chronic phase were higher than the other two phases (P<0.001). The 12 measured cross-section thrombosis lesions were divided into superficial vein group (n=48) and deep vein group (n=16). CE rate of superficial veins was higher than that of deep veins (Z=1.44, P=0.03), as shown in Table 3.Discussion and Conclusions
CSVT is a potentially fatal neurological disease, which is often misdiagnosed due to its non-specific manifestations. Timely diagnosis and treatment can reduce morbidity and mortality, and significantly improve the prognosis of patients. In this study, we found that clinical manifestations often lag behind imaging signs. This suggests that the patient may have suffered from CVST a few days to years before the appearance of obvious clinical symptoms. 3D T1 SPACE technique can diagnose CVST well early and identify its different imaging stages. In conclusion, MR 3D T1 SPACE has the potential to become a fast, efficient, and non-invasive technology to improve the accuracy of early diagnosis of CVST.Acknowledgements
We sincerely thank the participants in this study.References
1. Capecchi M, Abbattista M, Martinelli I (2018) Cerebral venous sinus thrombosis. J Thromb Haemost 16:1918-1931.
2. Idiculla PS, Gurala D, Palanisamy M et al (2020) Cerebral Venous Thrombosis: A Comprehensive Review. Eur Neurol 83:369-379.
3. Ferro JM, Aguiar de Sousa D (2019) Cerebral Venous Thrombosis: an Update. Curr Neurol Neurosci Rep 19:74.
4. Leach JL, Fortuna RB, Jones BV, Gaskill-Shipley MF (2006) Imaging of cerebral venous thrombosis: current techniques, spectrum of findings, and diagnostic pitfalls. Radiographics 26 Suppl 1:S19-41; discussion S42-13.
5. Idbaih A, Boukobza M, Crassard I et al (2006) MRI of clot in cerebral venous thrombosis: high diagnostic value of susceptibility-weighted images. Stroke 37:991-995.
6. Qiao Y, Zeiler SR, Mirbagheri S et al (2014) Intracranial plaque enhancement in patients with cerebrovascular events on high-spatial-resolution MR images. Radiology 271:534-542.
Figures