4461
Differentiating mild and severe nephropathies via multiparametric urea CEST, NOE and quantitative MT imaging1Department of Bioengineering, University of California, Berkeley, Berkeley, CA, United States, 2Berkeley Preclinical Imaging Core (BPIC), University of California, Berkeley, Berkeley, CA, United States
Synopsis
Standardized blood tests lack adequate sensitivity to renal function and its underlying pathophysiology. We examined whether urea CEST, along with NOE CEST and quantitative MT imaging, can be used to quantitatively differentiate cisplatin and aristolochic acid (AA) models of mild and severe nephropathy, respectively. The increase of T1 relaxation time and decrease of qMT contrast were parallel in two models, while the decreased intrarenal gradient of urea CEST and NOE contrast were only observed in AA models. These results indicate that our integrated approach has the potential to noninvasively quantitate renal injuries and characterize different types of renal pathophysiology.
Introduction
Renal diseases are diagnosed via measurement of blood urea nitrogen (BUN) and serum creatinine (SCr). Yet, these methods lack sensitivity until 50% of renal function is lost1 and do not report pathological features of renal injury. This prevents accurate quantitation of progressive kidney failure and requires additional biopsy. Recently, we demonstrated the use of urea CEST contrast at 1 ppm to monitor renal function and underlying disease.2 In this study, we examined whether this approach, in conjunction with NOE CEST and quantitative MT (qMT) imaging, can detect pathological changes in kidneys in the settings of mild and severe injury progression and quantitatively differentiate these two.Methods
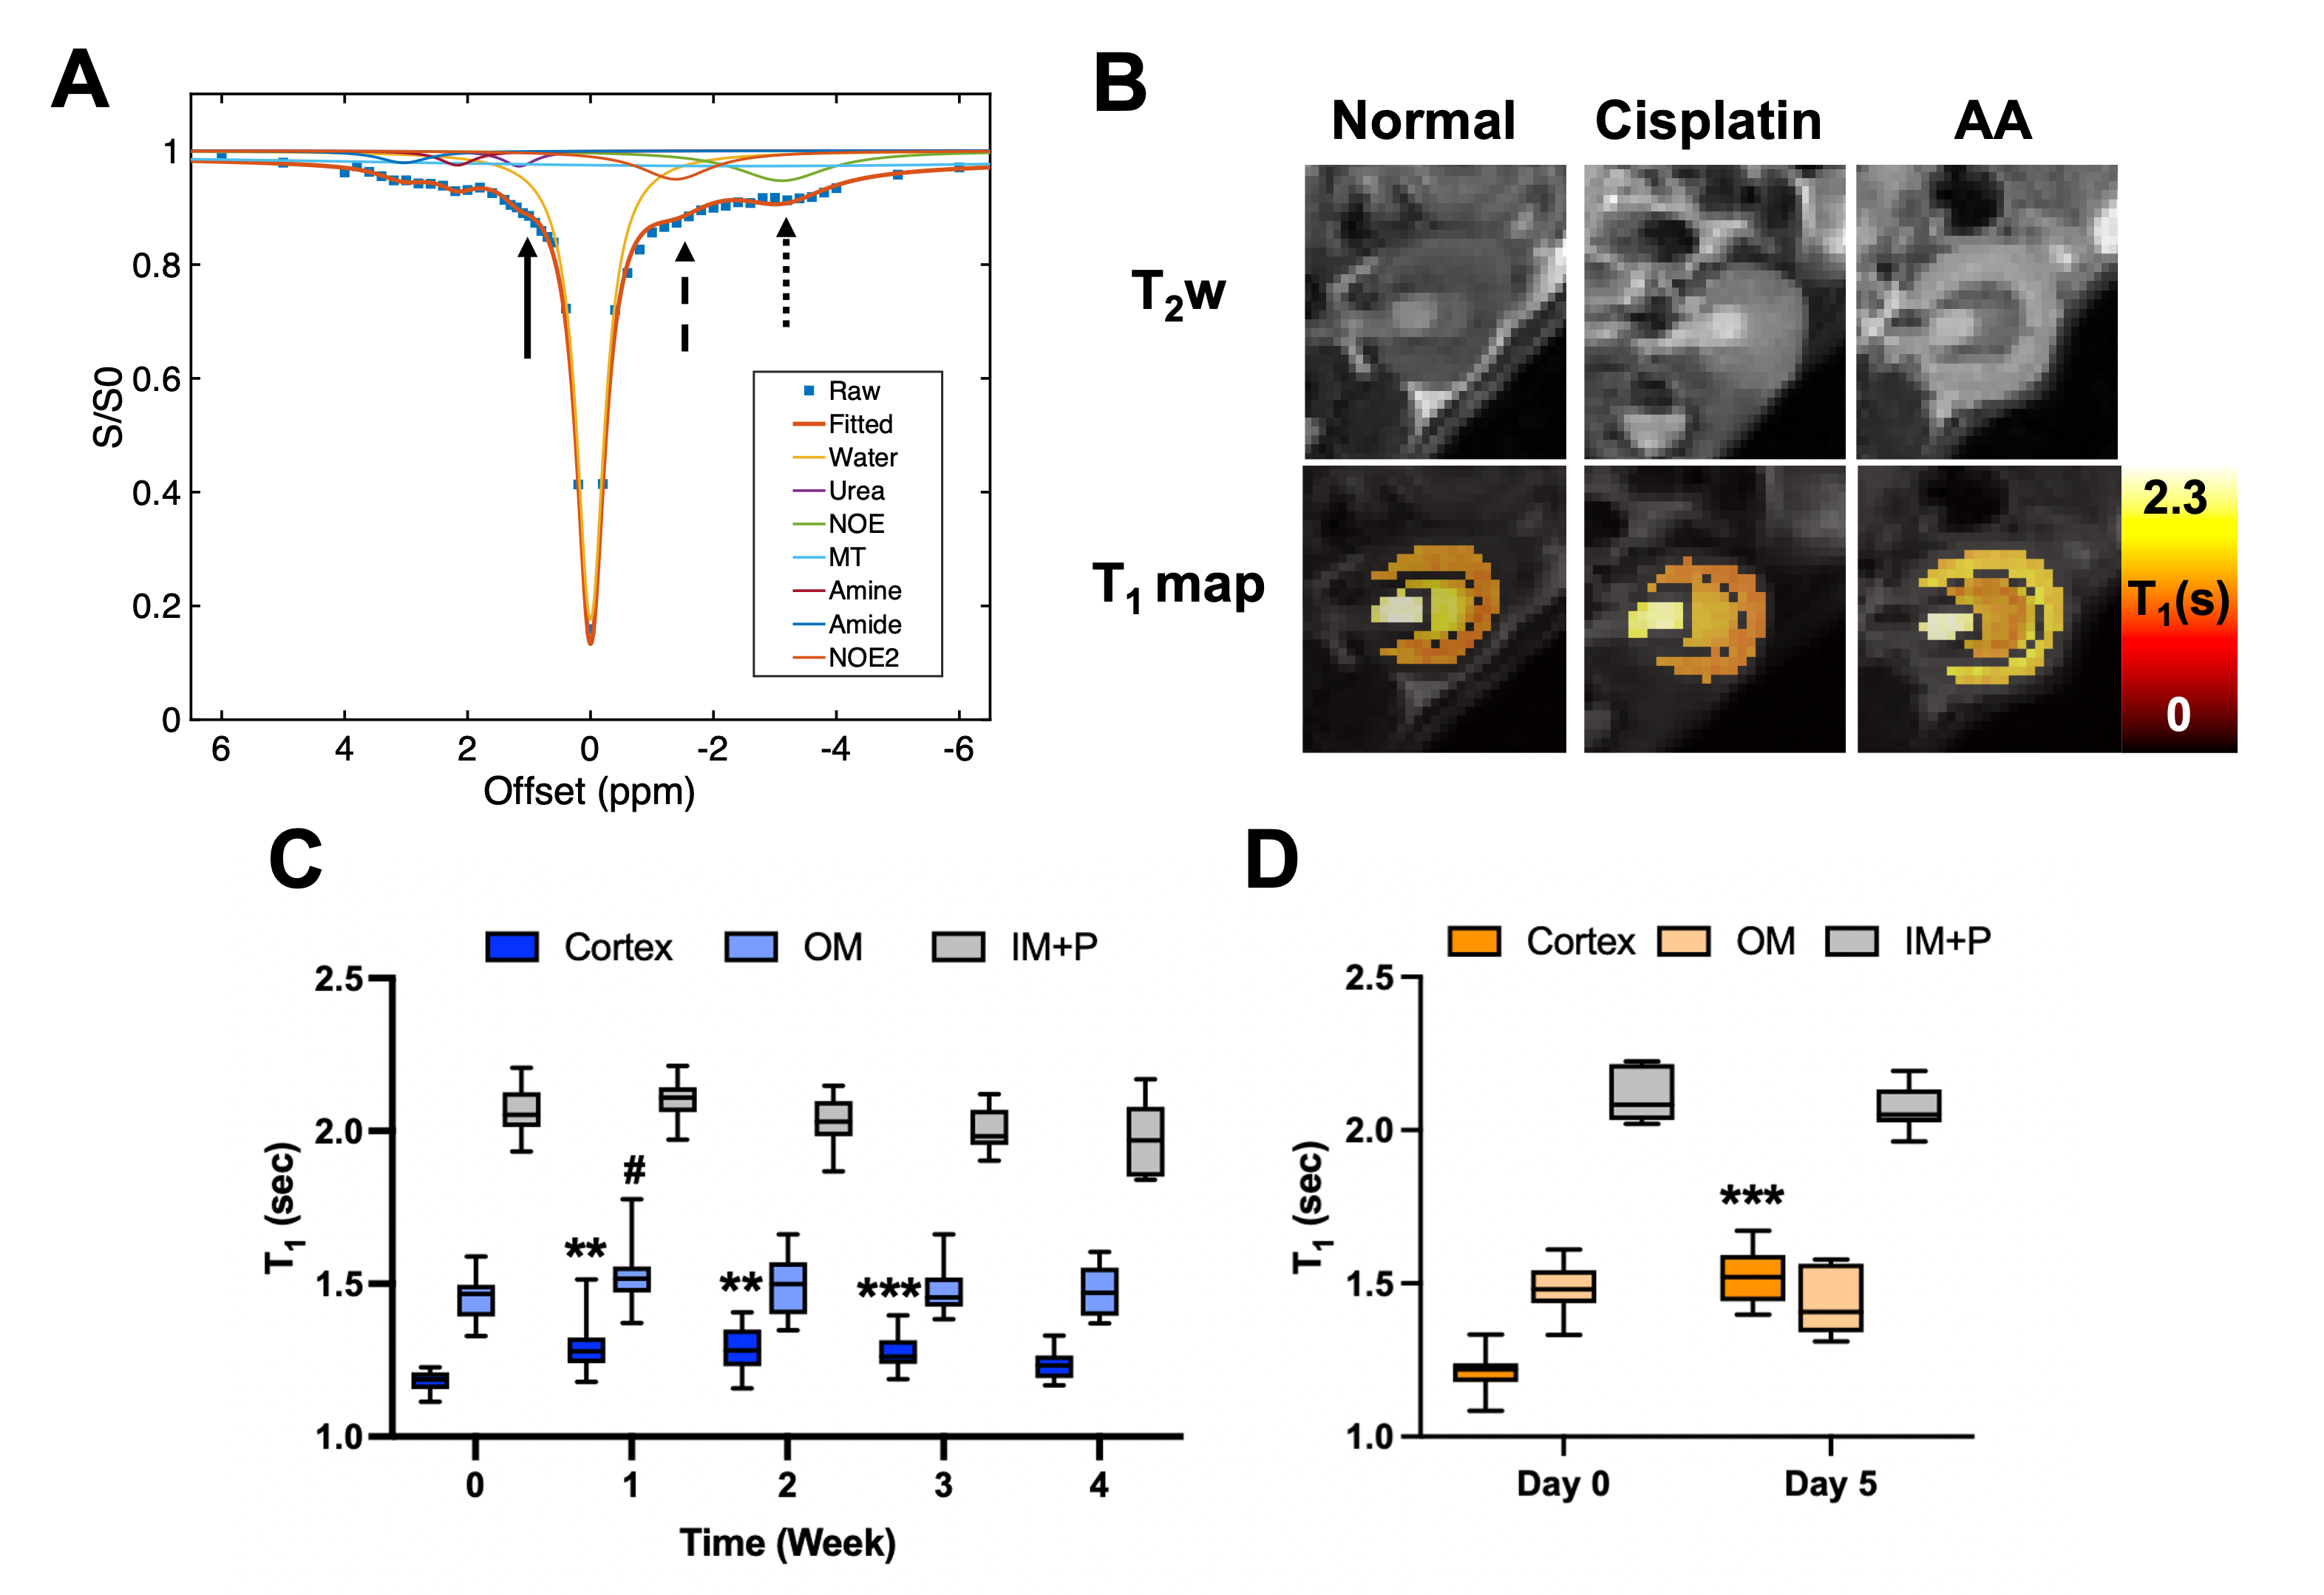
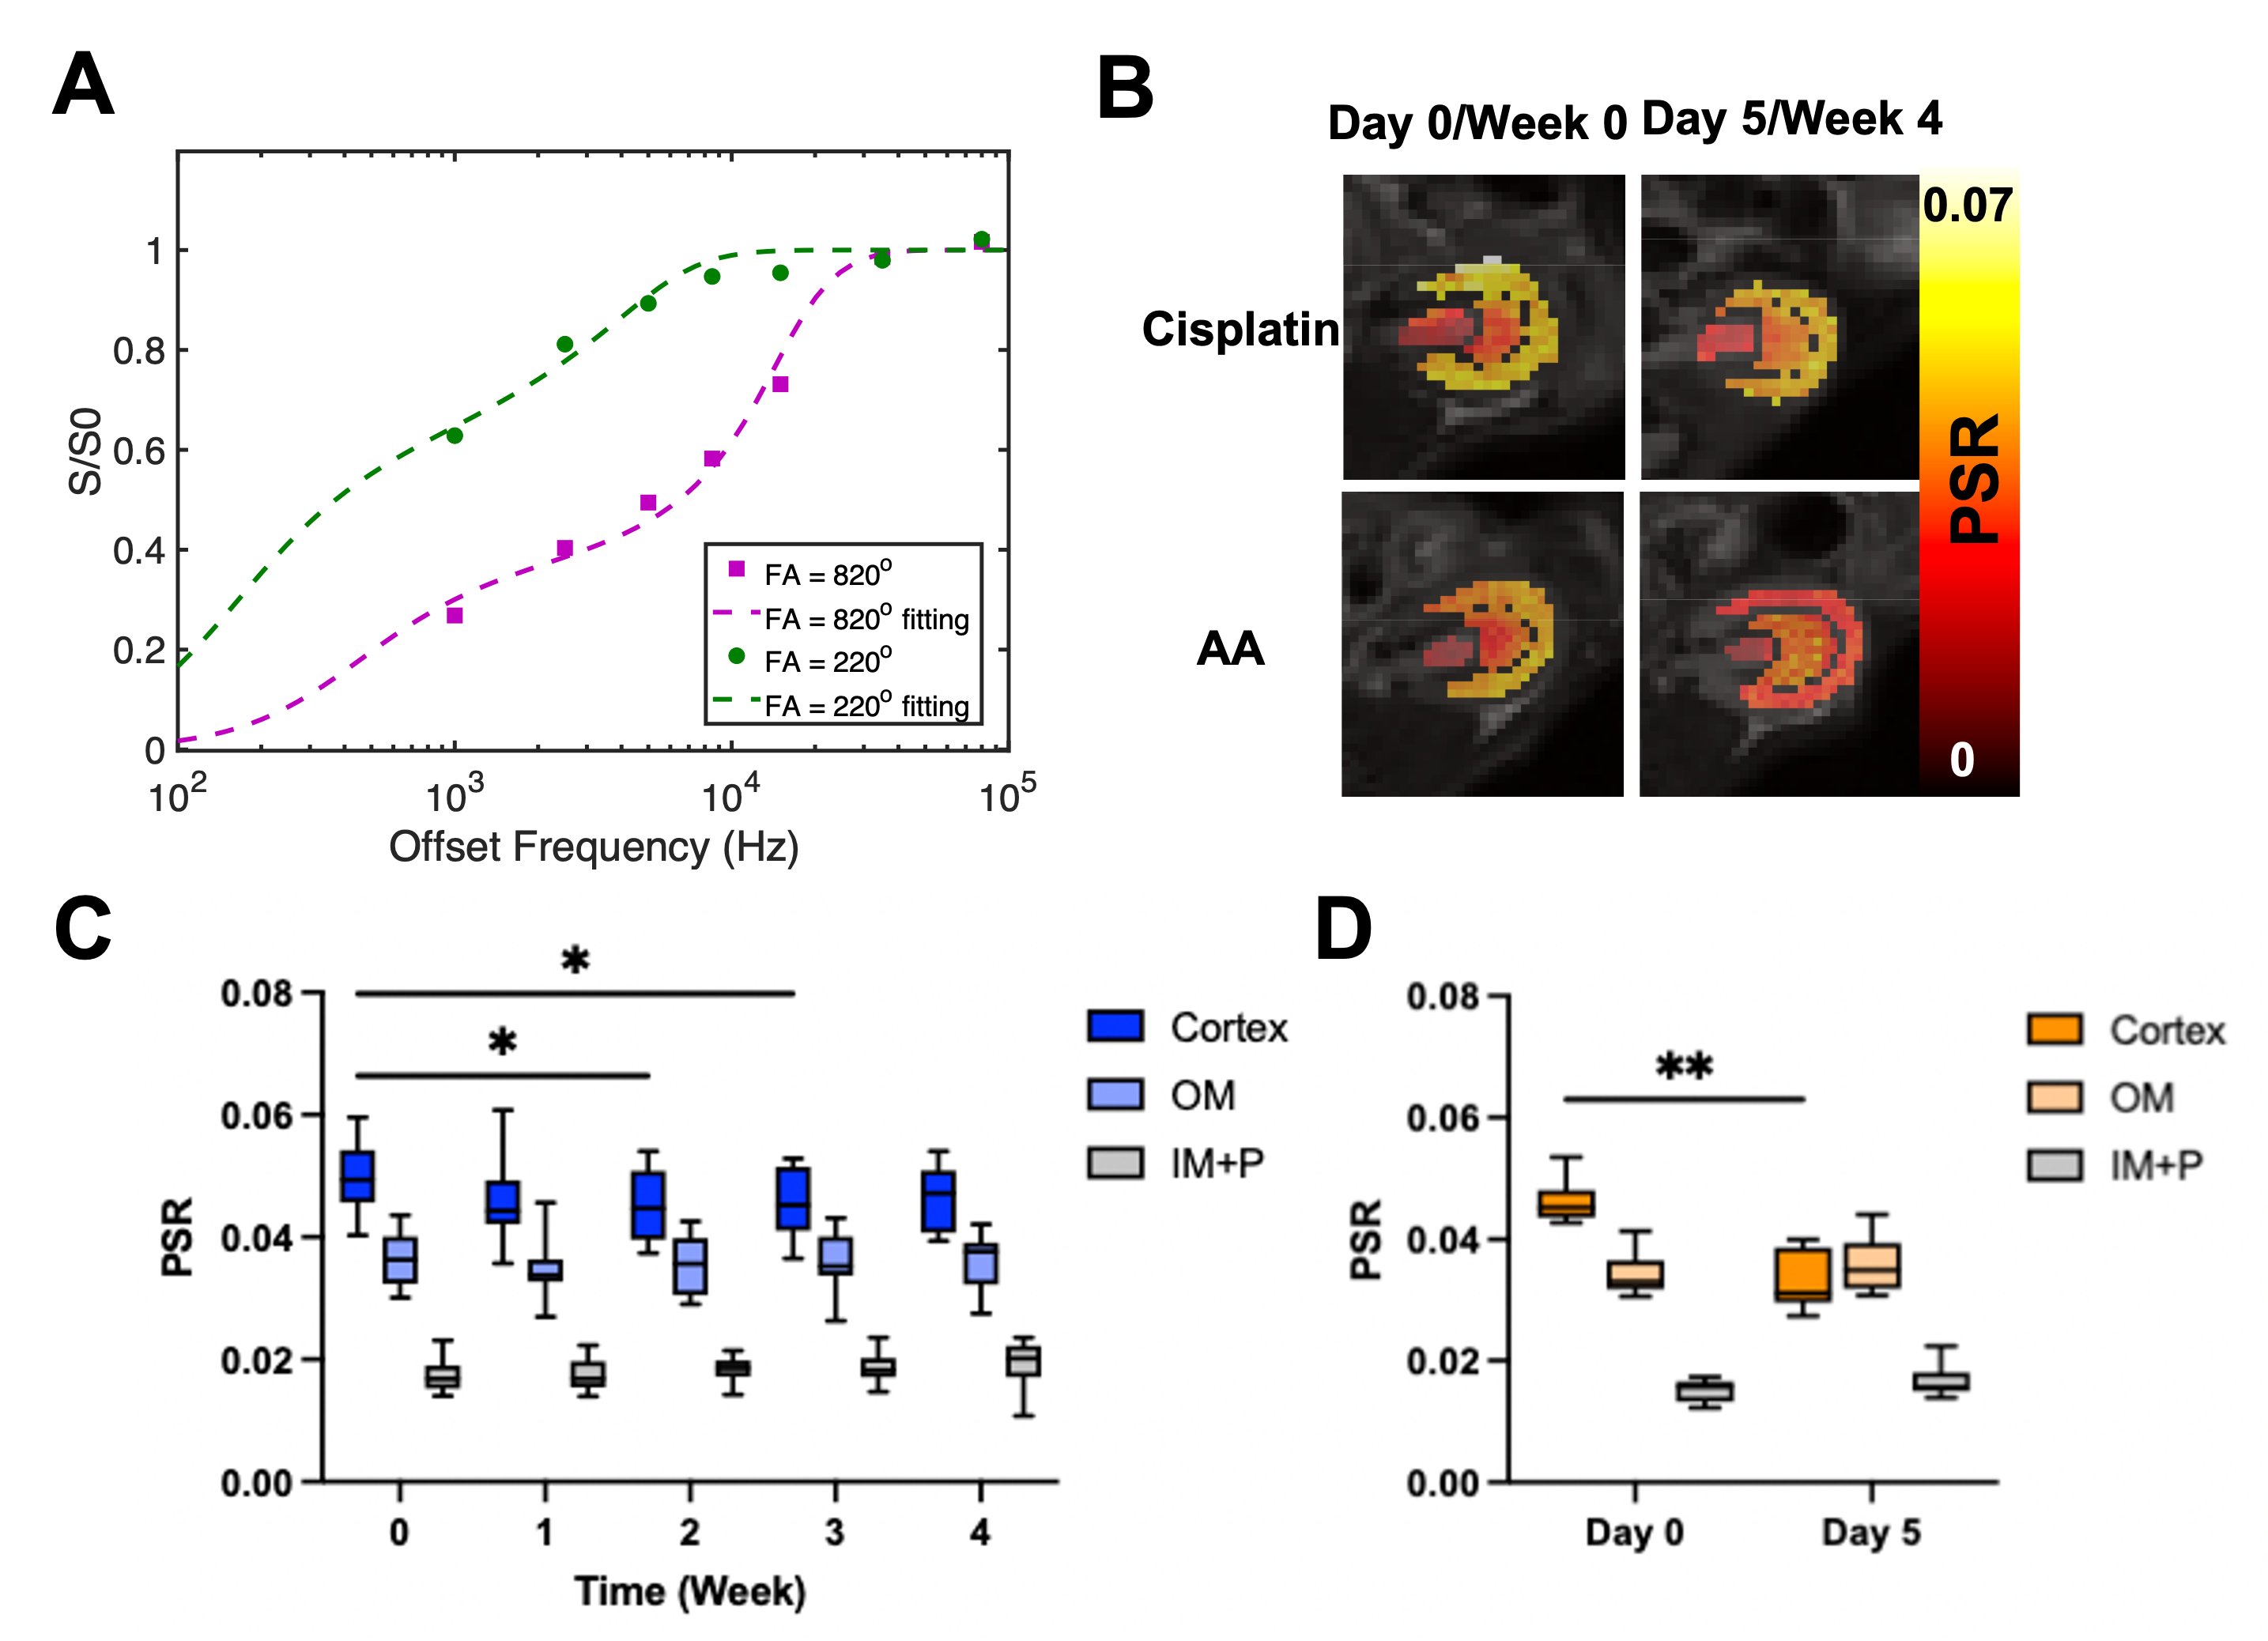
Cisplatin (Fresenius Kabi, Bad Homburg, Germany) was used for inducing chronic and mild renal injuries3, and aristolochic acid (AA; Acros Organics, Geel, Belgium) for acute and severe renal injuries.4 For cisplatin group, 10—12-week-old male C57BL6/J mice (n = 26) were i.p. injected with 10 mg/b.w. kg of cisplatin every week from week 0 to 3. Blood was collected every week for measurement of BUN and SCr (n = 10). The other mice (n = 16) were scanned every week up to week 4. Mice were infused with either 150 μL saline (n = 8) or 2M 150 μL urea (n = 8) during each scan to see renal response via urea CEST. For the AA model, mice of the same age and species (n = 20) were i.p. injected with 5 mg/b.w. kg of AA every day from day 0 to 4. Blood collection (n = 10) and MR scans with saline (n = 5) or urea (n = 5) infusion, were performed at days 0 and 5. MR scans were performed at 7T with a 40 mm volume coil (Bruker PharmaScan, Ettlingen, Germany). To control diuretic states, every MR scan was preceded by 12-hour fasting. T2-weighted images (RARE, TR/TE = 2500/52 ms, NA = 2, slice thickness = 2 mm, FOV = 35 x 35 mm), T1 maps (Inversion recovery, TR/TE = 4.3/2.1 ms, 15 TIs from 100 to 8000 ms, Matrix = 128 x 128), CEST Z-spectra (TR/TE = 7.4/3.1 ms, NA = 2, 59 offset frequencies, 70 0.6 μT 50-ms Gaussian sat pulses with DC = 50%, Matrix= 128 x 128) were acquired before and 20 minutes after the infusion of saline or urea. B0 and B1 maps (WASABI method5, 3.7 μT, 5 ms-long cw sat pulse, the same readout as CEST, 41 offset frequencies from -2 to 2 ppm) and MT-weighted images (FLASH, TR/TE = 24/2.5 ms, FA = 7o, NA= 24) at two saturation powers (FA = 220o and 820o, 10 ms Gaussian pulse) were also acquired. Kidneys were segmented into the cortex, outer medulla (OM) and inner medulla and papilla (IM+P). ROI-averaged CEST z-spectra were fitted to 7-pool Lorentzian functions (Figure 2A), and apparent exchange-dependent relaxation (AREX) method6 was applied to measure the T1-corrected CEST contrast. Voxel-wise qMT data were fitted to a two-pool Ramani equation (Figure 5A)7 to derive the pool size ratio (PSR; the ratio of semi-solid macromolecule pool to free water pool).Results
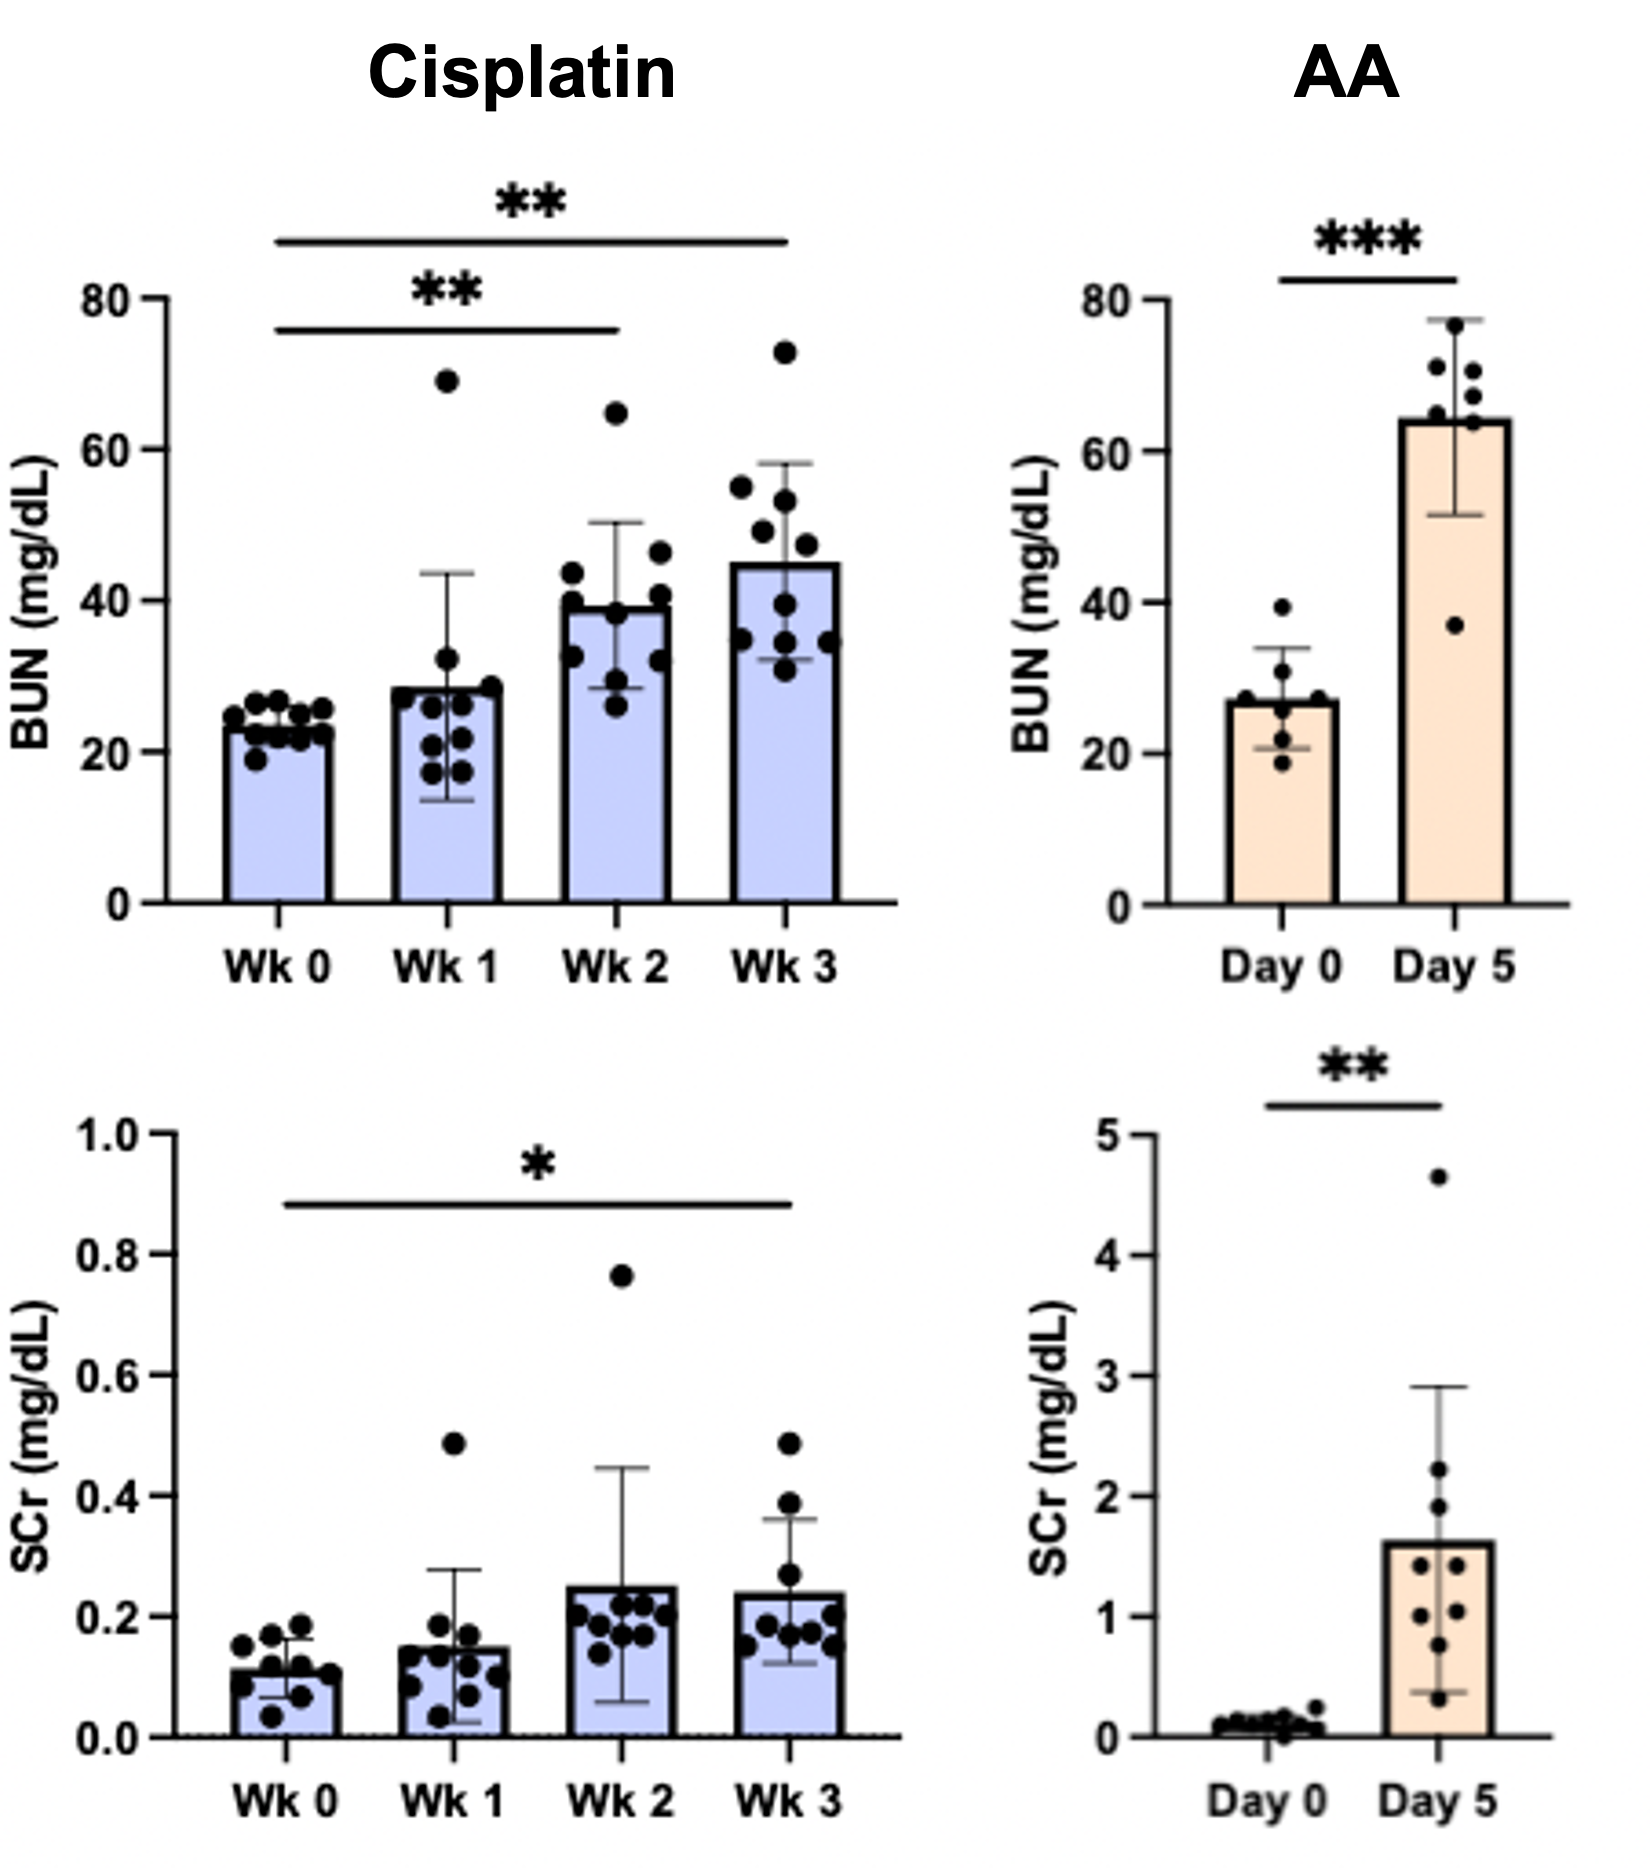
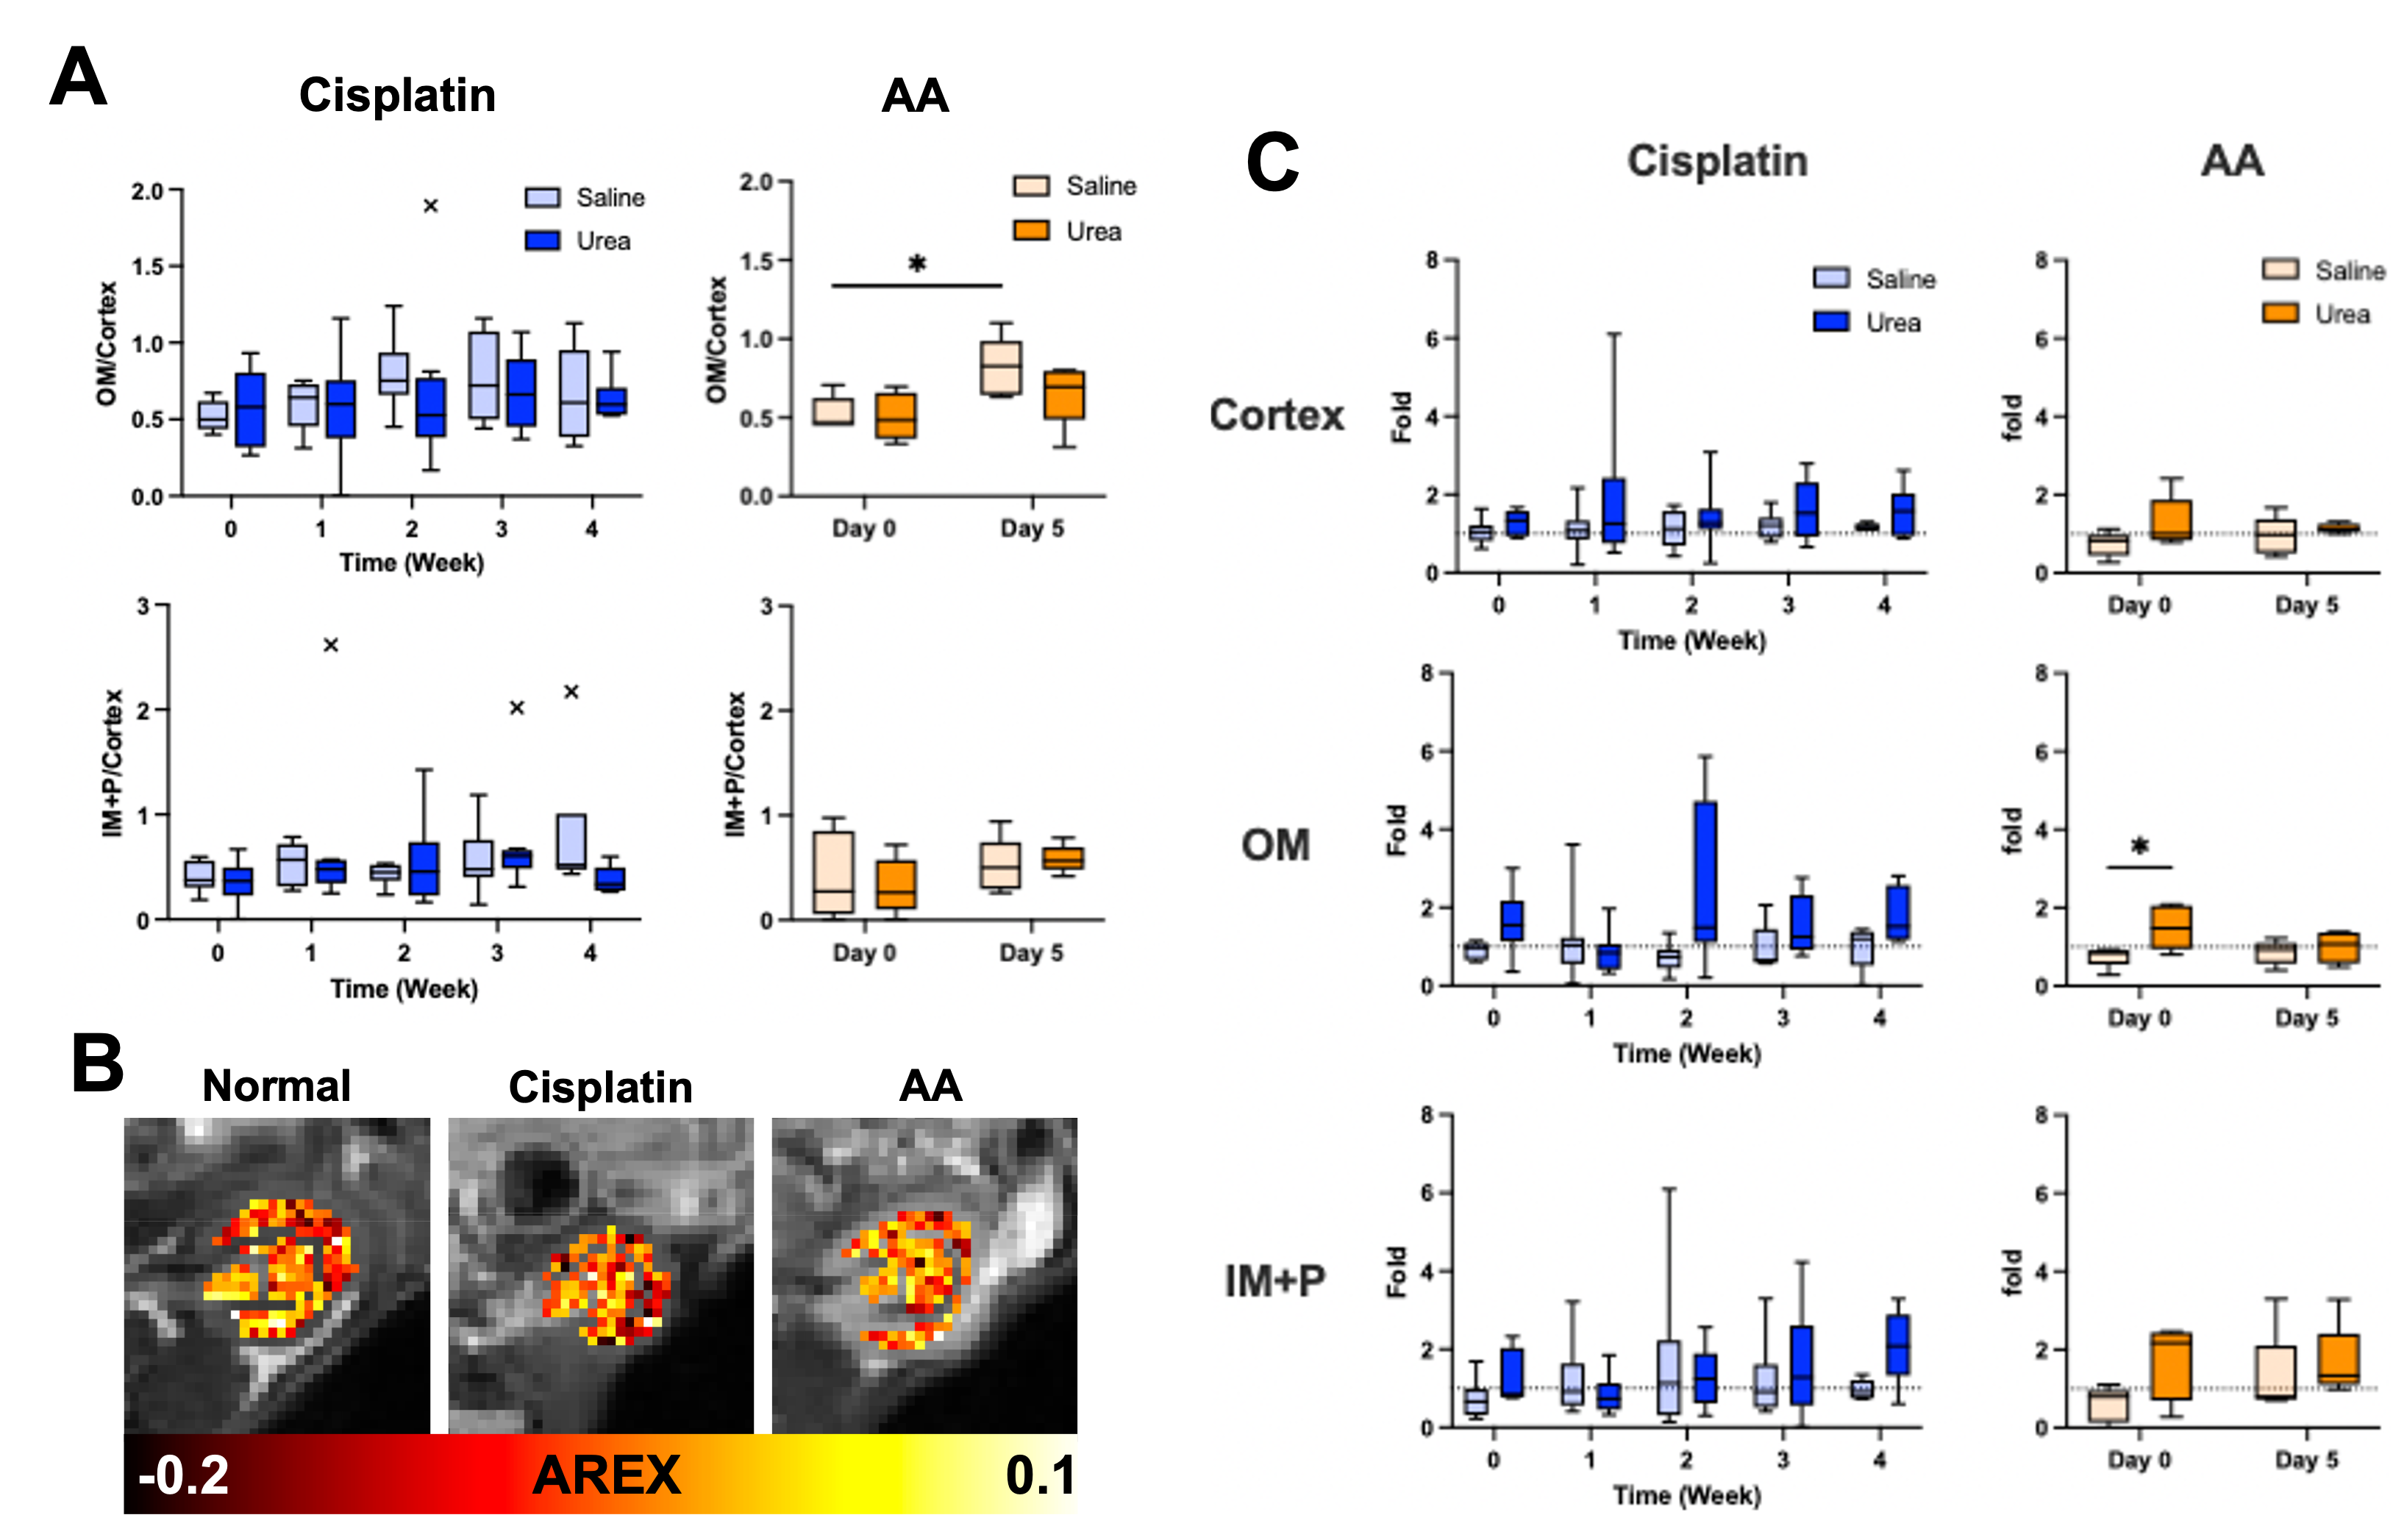
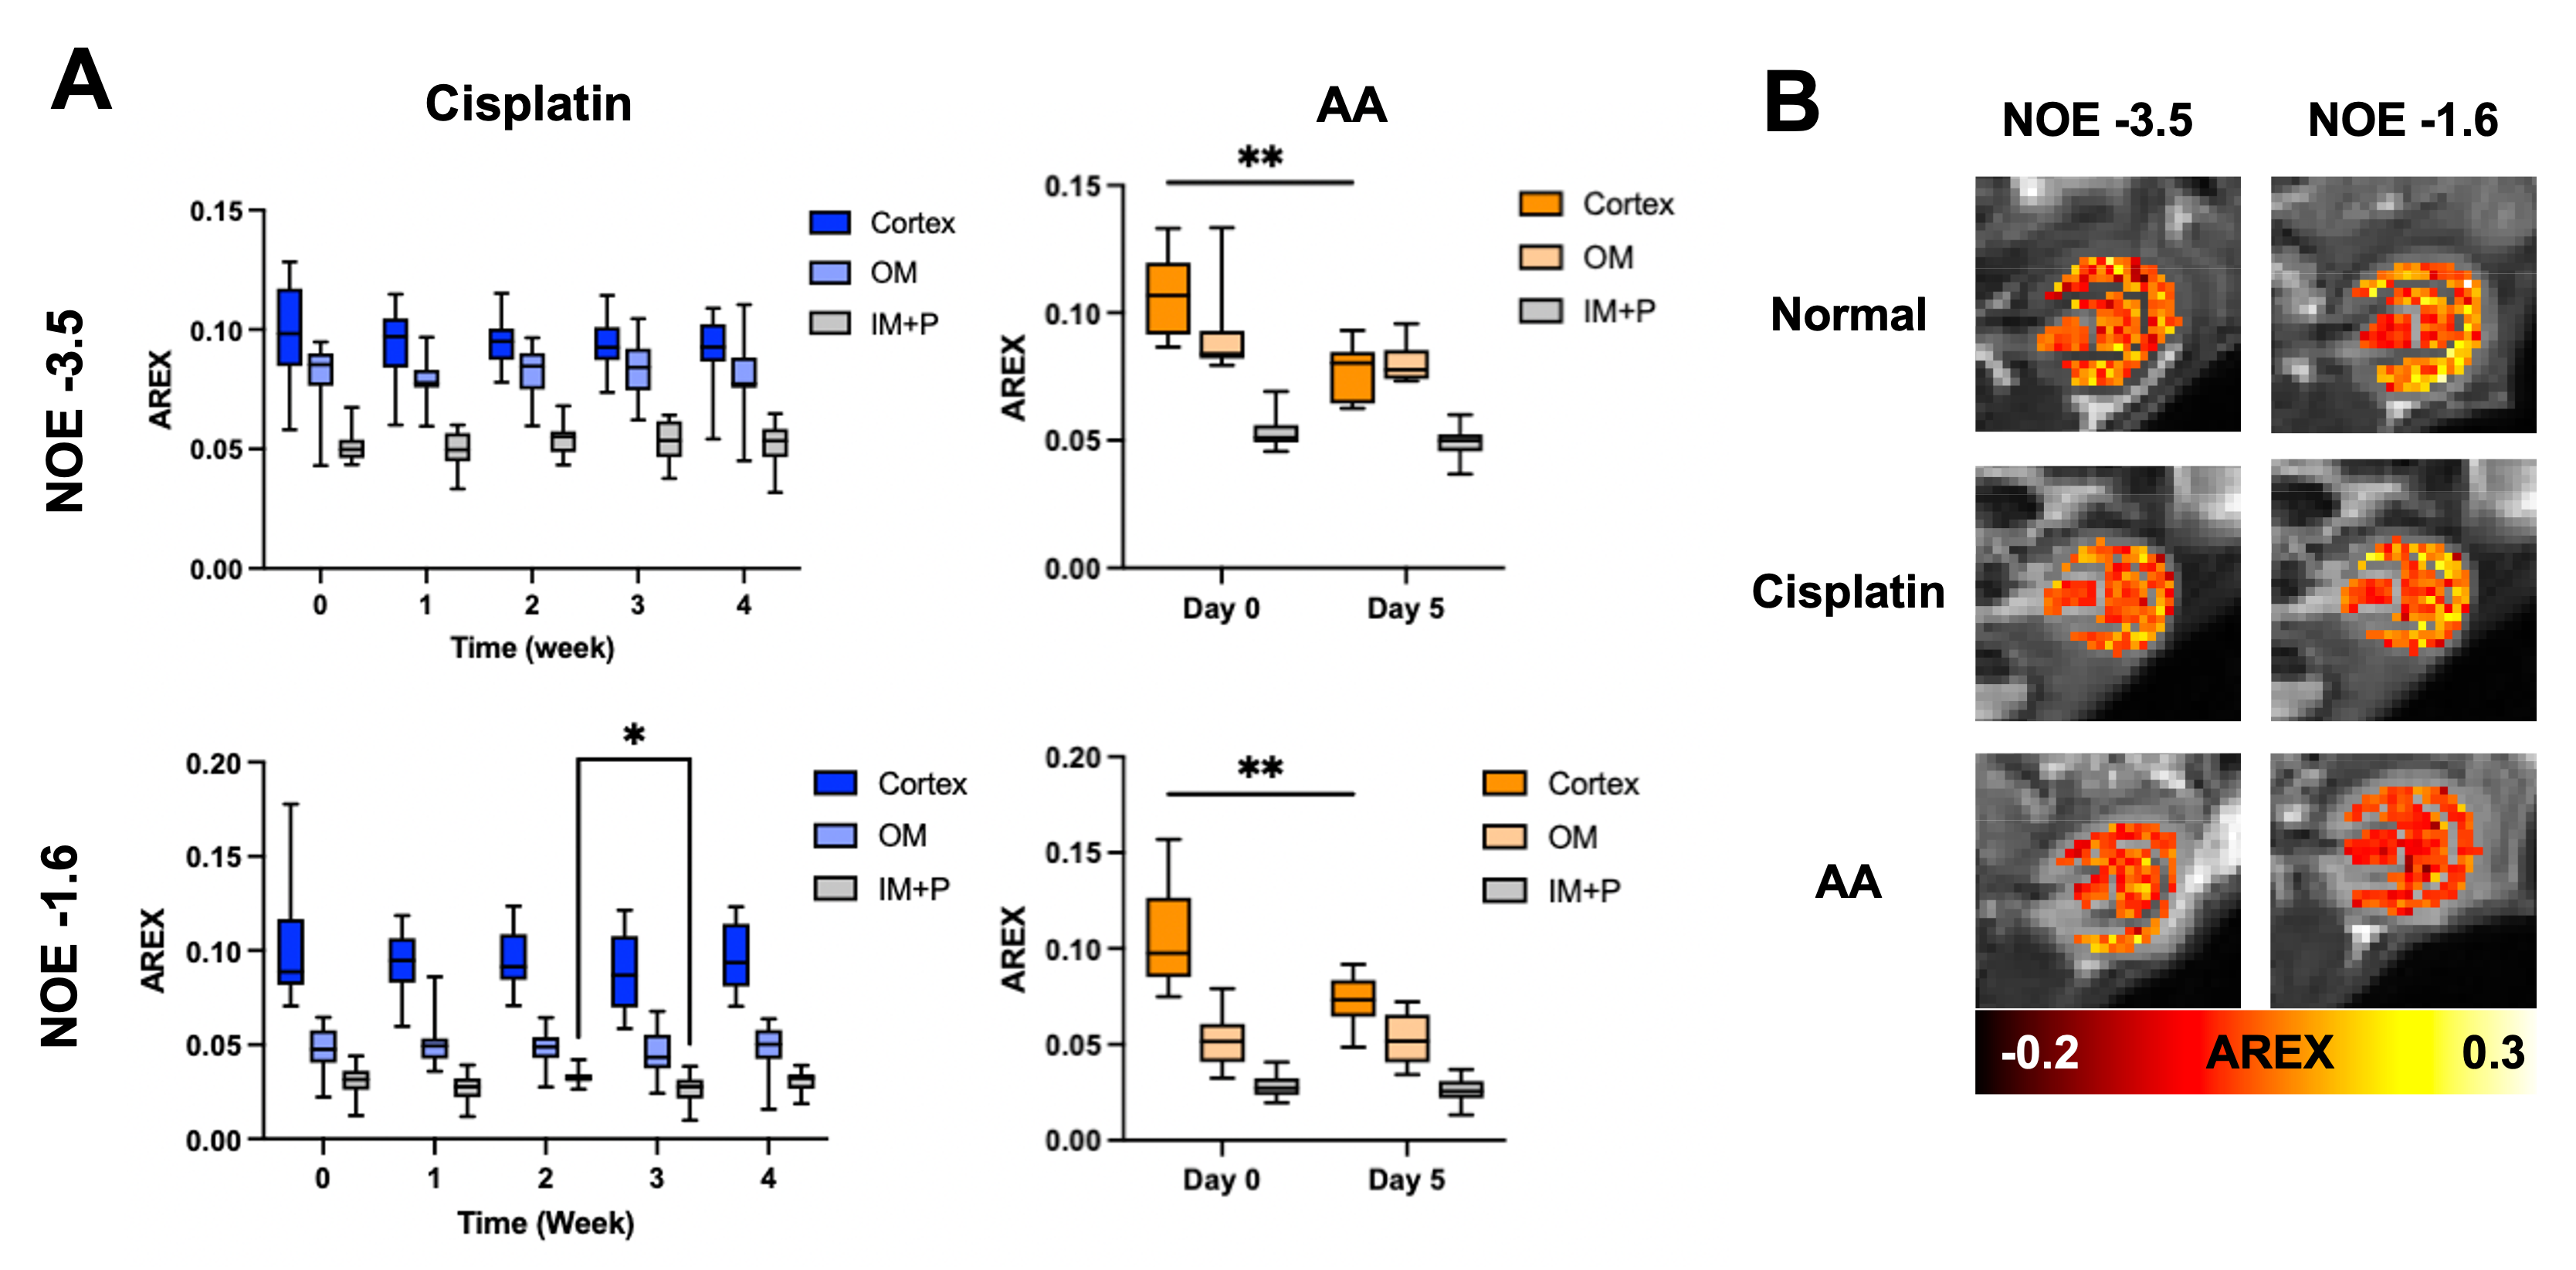
Both cisplatin and AA induced a significant increase of BUN and SCr, with the AA group showing a larger increase in both measurements (Figure 1). The distinct contrast between the cortex and OM in T2-weighted images from normal mice disappeared in the cisplatin group, while the AA group shows the reversed contrast between those two regions (Figure 2B). Both cisplatin (~100 ms) and AA groups (~300 ms) showed a significant increase of T1 times in the cortex (Figure 2B-D). While the cisplatin group does not show any changes in the spatial gradient of urea AREX, the AA model shows a disrupted gradient between the cortex and OM (Figure 3A,B). The fold change of urea AREX between pre- and post-infusion of saline and urea did not show significant changes over time in both groups (Figure 3C). The AA model showed a substantial decrease in both NOE contrasts at -3.5 and -1.6 ppm, while no changes were observed in the cisplatin group (Figure 4). PSR measurements from the qMT data showed a significant decrease in the cortex in both groups, with a larger decrease shown in the AA group (Figure 5).Discussion
The mild and severe nephropathies were well established by cisplatin and AA, respectively, as shown in the differential increase of BUN and SCr. Both nephropathy models showed an increase of T1 time and a decrease of PSR in the cortex, which may indicate pathologies involving the expansion of free water volume such as tubular dilatation and edema.8 Yet, the change of these two measurements was significantly larger in the AA model, indicating more severe renal injuries. This greater severity is also supported by the decrease of NOE contrasts and the disruption of the urea AREX gradient that are seen in the AA group only. These findings indicate that our method can distinguish mild and severe nephropathies and may identify differences in the underlying pathophysiology. Histology will be performed to confirm the diagnostic potential of our method in the future.Conclusion
Urea CEST, NOE and qMT imaging can differentiate mild and severe renal injuries.Acknowledgements
This study was supported by NIH 1R01HL28592, AHA 19TPA34850040 and NIH UH2EB028908.References
1. Stevens LA, Coresh J, Greene T, Levery AS. Assessing kidney function—Measured and estimated glomerular filtration rate. N Engl J Med. 2006;354:2473-2483.
2. Shin S, Wendland MF, Vandsburger MH. Delayed urea differential enhancement CEST (dudeCEST)-MRI with T1 correction for monitoring renal urea handling. Magn Reson Med. 2021;85(5):2791-2804.
3. Sears SM, Sharp CN, Krueger A, et al. C57BL/6 mice require a higher dose of cisplatin to induce renal fibrosis and CCL2 correlates with cisplatin-induced kidney injury. Am J Physiol Renal Physiol. 2020;319(4):F674-F685.
4. Baudoux TER, Pozdzik AA, Arlt VM, et al. Probenecid prevents acute tubular necrosis in a mouse model of aristolochic acid nephropathy. Kidney International. 2012;82:1105-1113.
5. Schuenke P, Windschuh J, Roeloffs V, et al. Simultaneous Mapping of Water Shift and B1 (WASABI)—Application to Field-Inhomogeneity Correction of CEST MRI Data. Magn Reson Med. 2017;77(2):571-580.
6. Zaiss M, Xu J, Goerke S, et al. Inverse Z-spectrum analysis for spillover-, MT-, and T1-corrected steady-state pulsed CEST-MRI — application to pH-weighted MRI of acute stroke. NMR Biomed. 2014;27(3):240-252.
7. Wang F, Wang S, Zhang Y, et al. Noninvasive quantitative magnetization transfer MRI reveals tubulointerstitial fibrosis in murine kidney. NMR Biomed. 2019;32(11):1-13.
8. Ueki M, Ueno M, Horishita J, Maekawa N. Curcumin ameliorates cisplatin-induced nephrotoxicity by inhibiting renal inflammation in mice. J BioSci Bioeng. 2013;115(5):547-551.
Figures