4460
R1rho Dispersion in Spinal Cord and Nerve1Translational Neuroscience, Barrow Neurological Institute, Phoenix, AZ, United States, 2Barrow Neurological Institute, Phoenix, AZ, United States, 3Radiology and Radiological Sciences, Vanderbilt University Medical Center, Nashville, TN, United States
Synopsis
Previous studies have demonstrated that at high fields (3T and beyond), dispersion of R1rho with different locking fields may reflect chemical exchange processes in biological tissues. This study aimed to investigate if R1rho dispersion is measurable in the spinal cord and nerve bundles. The results show that the dispersion is significant and measurable in both tissues, suggesting that R1rho dispersion has potential to characterize changes in composition or other physicochemical properties in nerve injuries and/or neurological disorders.
INTRODUCTION
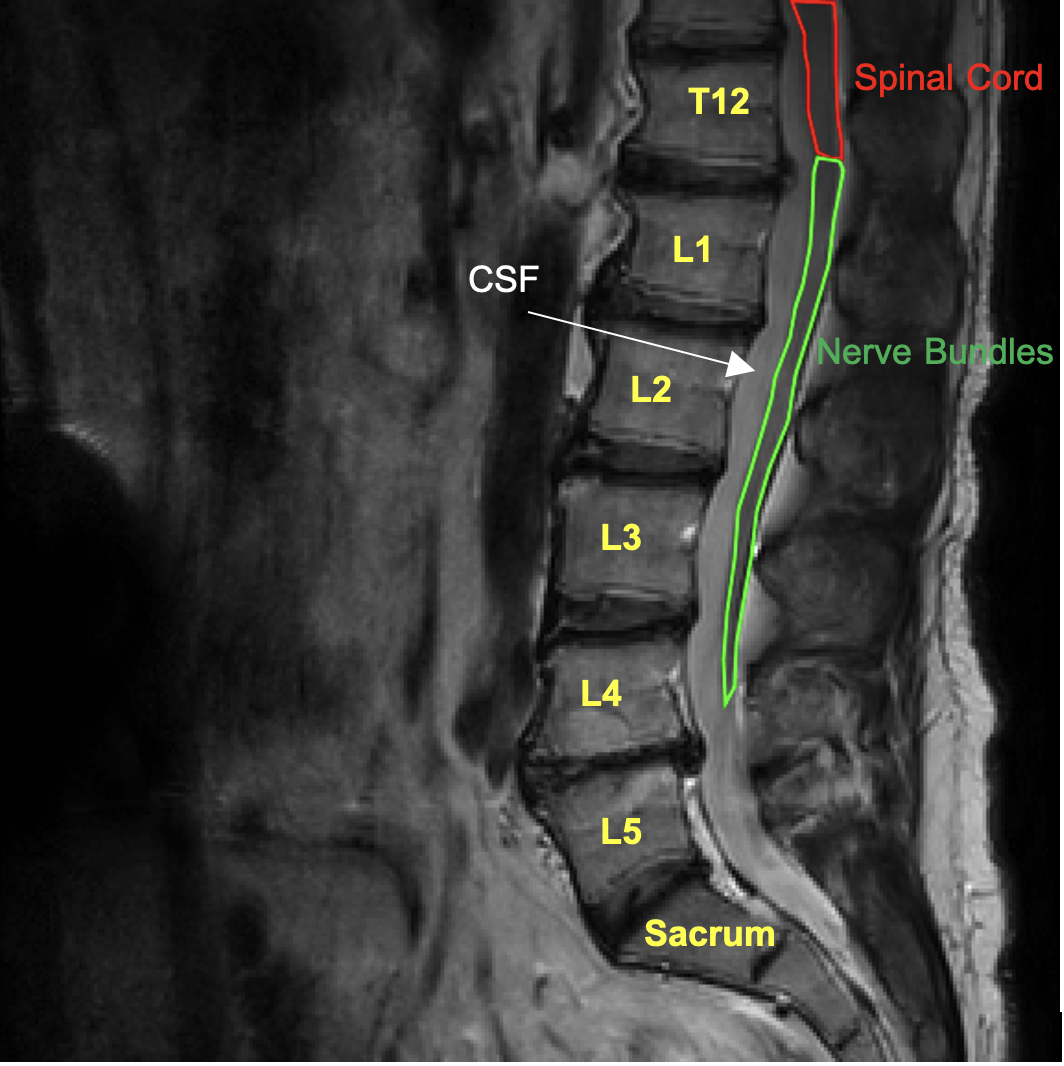
The spinal cord is an extension of the central nervous system (CNS), which consists of the brain and spinal cord. The spinal cord begins at the bottom of the brain stem and ends in the lower back, as it tapers to form a cone called the conus medullaris. At the bottom of the spinal cord (conus medullaris) is the cauda equina that is a collection of nerves1. Measurements of R1rho, the relaxation rate in the rotating frame using spin lock methods, complement other metrics of tissue relaxation. Moreover, variation of R1rho (the R1rho dispersion) can in principle provide a quantitative characterization of tissue composition and alterations associated with pathology2-4. Our recent studies suggest that at high fields (≥ 3T) R1rho dispersion specifically reflects the contribution of chemical exchange to transverse relaxation, and likely reflects the concentration of exchangeable species in tissue that exchange at an appropriate rate5-7. R1rho dispersion has been used previously in tissues to assess glycosaminoglycan (GAG, a side chain of proteoglycan) content, but it has not been applied to studies of spinal cord or nerves. In this study, we examined the R1rho dispersion in healthy volunteers to evaluate the feasibility of using R1rho dispersion in future applications of neurological disorders.METHODS
MRI was performed on a Philips 3T Ingenia scanner with a ds-posterior spine coil (Philips Healthcare, Best, The Netherlands). Two healthy volunteers underwent R1rho imaging using an MRI sequence as described previously8. The parameters are field of view = 322x378mm2, pixel size = 1x1mm2, thickness = 5mm, matrix = 256x256. Five spin-lock times (TSLs) = [1ms, 11ms, 21ms, 31ms, 41ms] were used with a TSE (turbo spin echo) sequence for data acquisition. Repetition time (TR) = 3000ms, and echo time (TE) = 5.8ms, TSE factor = 16 (low-high profile), and CS-SENSE factor = 2, bandwidth = 122Hz/pixel, signal average = 1, resulting in a total scan time of 04m 32s. Considering the power limit of the RF (radiofrequency) amplifier and SAR, we chose four spin-lock frequencies (FSLs) ranging from 0Hz - 400Hz to examine the dispersion. R1rho values were calculated by fitting the acquired signals to a mono-exponential decay on a pixel-wise basis, and finally, mean values of R1rho in spinal cord and nerve regions (see Fig.1) were extracted for comparisons.RESULTS
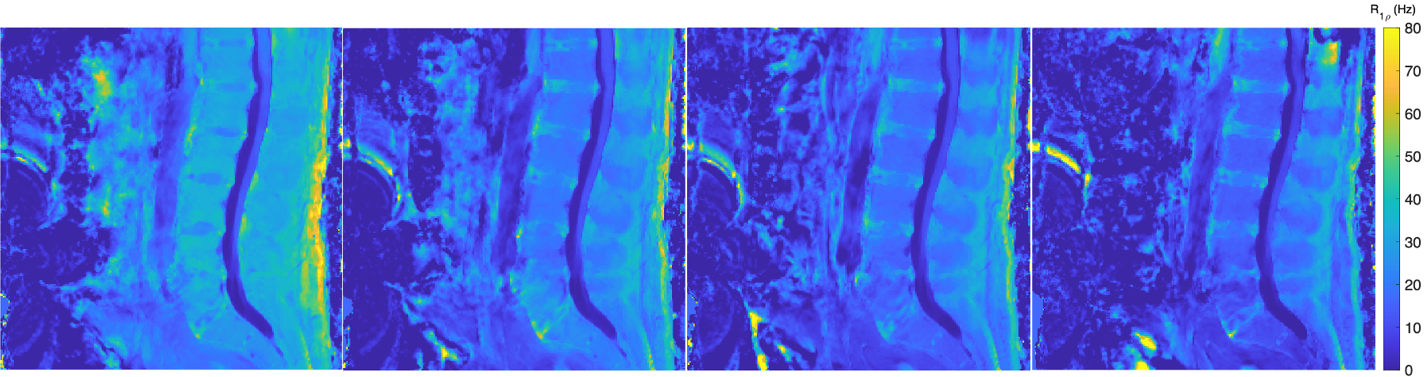
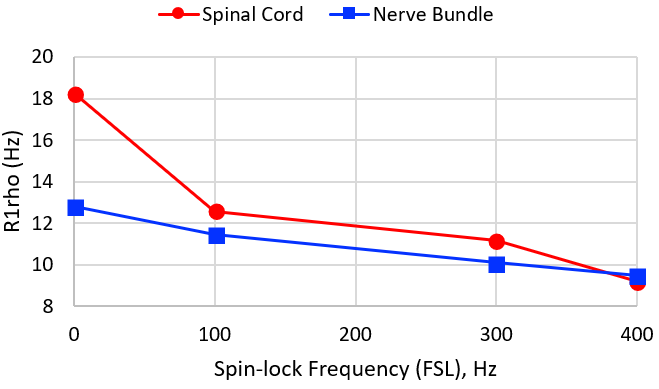
Fig. 2 shows an example of R1rho-weighted images of a healthy volunteer (male, 46 years old). The R1rho maps under different FSLs are displayed in Fig. 3. And Fig. 4 demonstrates the R1rho dispersion curves for both the spinal cord and the nerve bundles, with the dispersion being greater in the spinal cord than in the nerve bundles.DISCUSSION
This preliminary study showed that R1rho dispersion was significant and measurable at 3T in both the spinal cord and the nerve bundles, but spinal cord shows a larger dispersion than in the nerve bundle. This may reflect differences in composition and exchange rates of protons. For example, spinal cord may contain more exchangeable hydroxyl protons associated with cholesterol in myelin. The results from the study suggest that R1rho dispersion may have potential to characterize de/remyelination and nerve injuries/repairs in neurological disorders.CONCLUSION
R1rho dispersion was observed in both the spinal cord and nerve bundles at 3T, which has the potential to contribute to the better diagnosis and management of neurological disorders.Acknowledgements
Barrow Neurological Foundation (455003033568).References
1. Anatomy of the Spine and Peripheral Nervous System. https://www.aans.org/en/Patients/Neurosurgical-Conditions-and-Treatments/Anatomy-of-the-Spine-and-Peripheral-Nervous-System. Accessed November 9, 2021.
2. Duvvuri U, Goldberg AD, Kranz JK, et al. Water magnetic relaxation dispersion in biological systems: the contribution of proton exchange and implications for the noninvasive detection of cartilage degradation. Proc Natl Acad. 2001; 98(22): 12479-12484.
3. Cobb JG, Xie J, Gore JC. Contributions of chemical exchange to T1rho dispersion in a tissue model. Magn Reson Med. 2011; 66(6):1563-1571.
4. Hills BP, Babonneau F. A quantitative study of water proton relaxation in packed beds of porous particles with varying water content. Magn Reson Imaging. 1994; 12(6): 909-922.
5. Cobb JG, Xie J, Gore JC. Contributions of chemical and diffusive exchange to T1rho dispersion. Magn Reson Med. 2013; 69(5):1357-1366.
6. Wang P, Block J, Gore JC. Chemical exchange in knee cartilage assessed by R1rho (1/T1rho) dispersion at 3T. Magn Reson Imaging. 2015; 33(1): 38-42.
7. Wang P, Zhu H, Kang H, Gore JC. R1rho dispersion and sodium imaging in human calf muscle. Magn Reson Imaging. 2017; 42:139-143.
8. Witschey WR, Borthakur A, Elliott MA, et al. Artifacts in T1rho-weighted imaging: compensation for B1 and B0 field imperfections. J Magn Reson. 2007;186(1): 75-85.
9. Learn How To Read Your Lumbar MRI. https://www.chirogeek.com/MRI%20READING/mriReading.html. Accessed November 9, 2021.
Figures